
Who doesn’t enjoy a stable paycheck, says the guy who spent the last 40 years with his current employer?
Well, my trusty spreadsheet tried to see whether stability is a good career strategy by reviewing a half-century’s worth of federal employment stats back to 1976 for the 50 states and the District of Columbia.
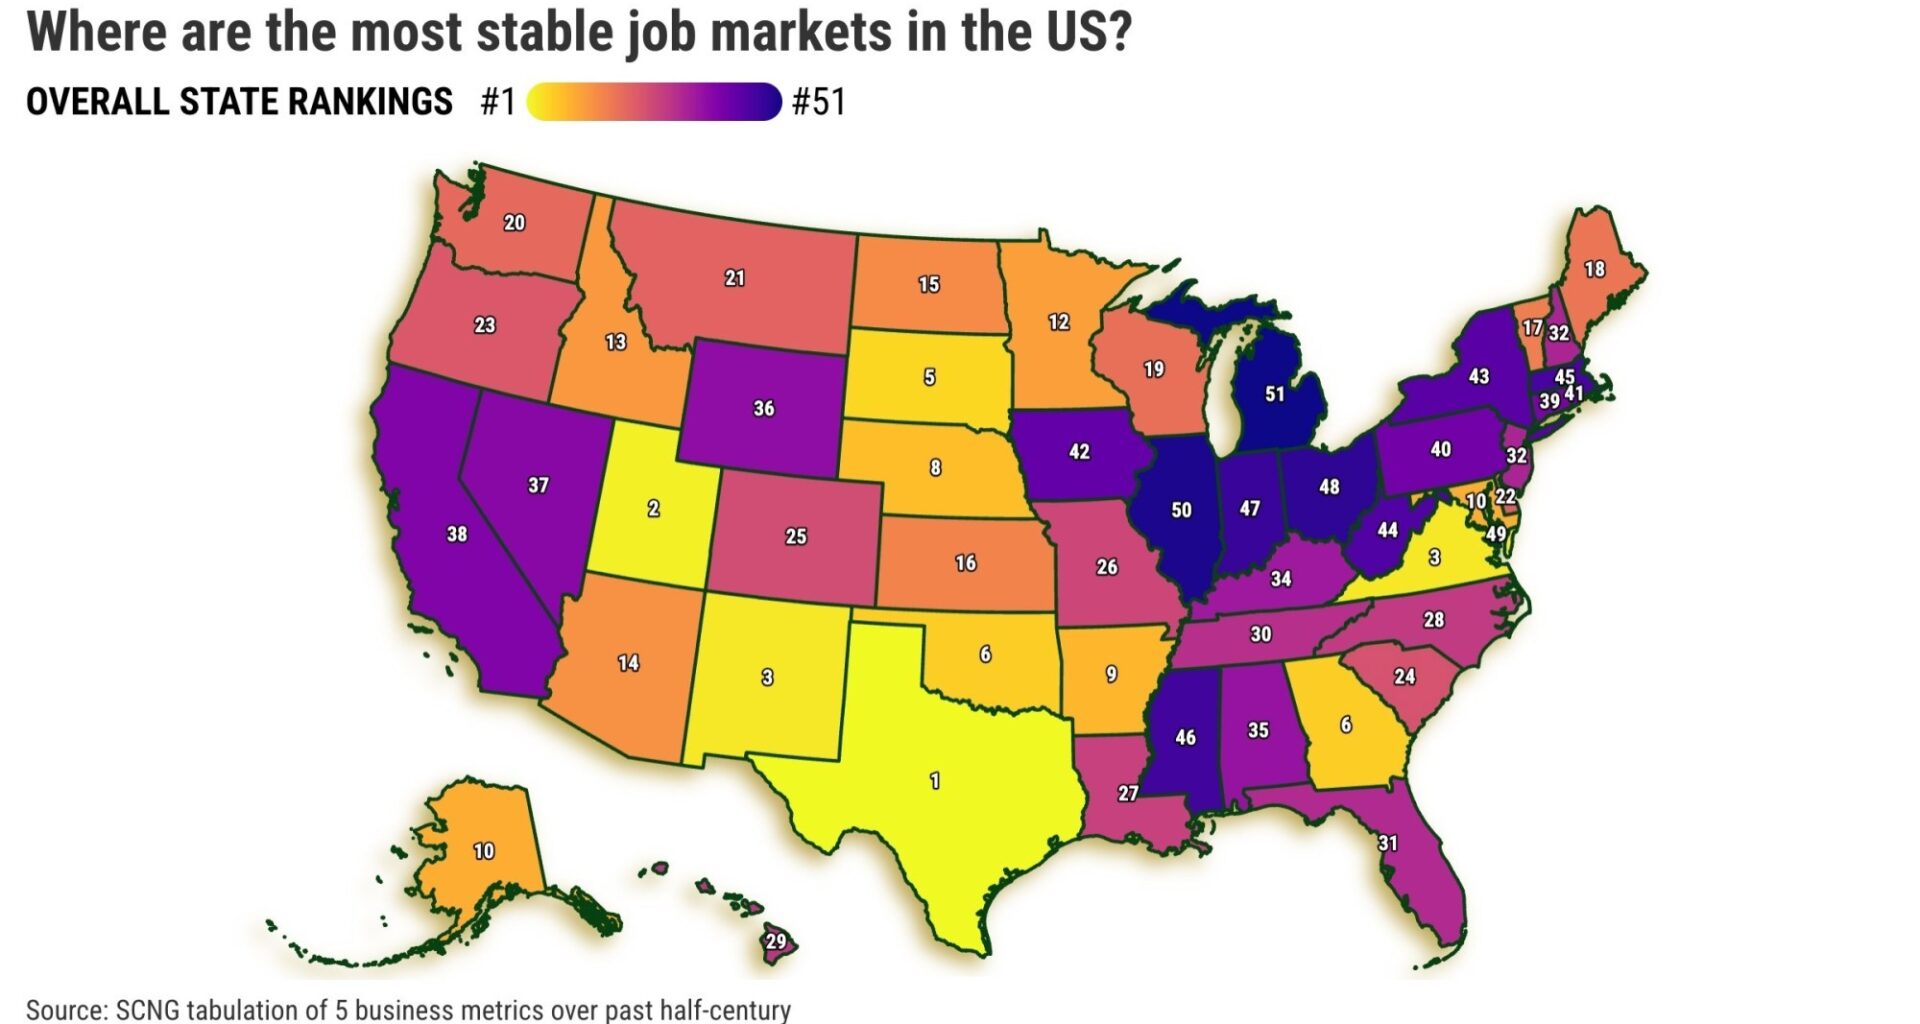
The scorecard sliced the data in five ways and found that if you want a steady paycheck, California might not be your best bet. The Golden State was the 14th most volatile job market.
The scorecard found the most serene job markets were in Texas, Utah and New Mexico. On the other hand, employment was most unpredictable in Michigan, Illinois and the District of Columbia.
Before you update your resume or plan a move, keep in mind that any “best state” ranking is part science and part guesswork. They’re best seen as a spark for discussion, not an indicator of where to live.
What matters more are the economic lessons found in the numbers. Contemplate the five stats that built this scorecard.
Who’s grown up?
When talking about job market quality, it makes sense to start with which states have added the most workers.
Despite the volatility of its job market, California ranked 13th best for employment growth over half a century. Golden State residents with jobs grew at an average annual pace of 1.5%— more than the 1.1% growth the typical American worker experienced.
The fastest annual job growth rates were in Nevada (3.5%), Arizona (2.9%) and Utah (2.6%). Meanwhile, the slowest growth was in West Virginia (0.3%), the District of Columbia (0.5%) and Ohio (0.5%).
Nerdy swings
When statisticians measure volatility, they often use a concept known as “standard deviation” to quantify the magnitude of ups and downs.
Using this method, California had the sixth-most unpredictable job market over 50 years – 27% more volatile than the national average.
Where were the wildest deviations over a half century? Nevada (88% above the U.S. norm), Hawaii (46%) and Michigan (38%).
And the most stable markets? South Dakota (61% below the U.S. norm), Nebraska (52% below) and Kansas (44% below).
The best times
“Hot” is part of any job market’s appeal.
To measure peak performance, consider one-year job gains at the 95th percentile, which is 5% below the highest growth. This smooths out unusual events such as economic bubbles or rapid recoveries from big job dips.
By this math, California had the 10th-best growth spurt at 5.8% a year, topping the 4.2% typical American hiring spree enjoyed over a half-century.
The highest peaks were in Arizona (8%), Nevada (7.4%) and Alaska (7.3%). Smallest? South Dakota (2.2%), Pennsylvania (2.7%) and North Dakota (2.7%).
The worst times
Conversely, to measure job market lows consistently, one-year employment gains at the fifth percentile, 5% above the worst, were analyzed. This minimizes economic shocks such as global crashes and pandemics.
By this math, California had the 11th-deepest jobs bottom, down 2.9% in a year, deeper than the 1.9% the typical American worker suffered.
Lowest lows? Michigan (off 5%), District of Columbia (off 4.4%) and Nevada (off 3.7%). And the mildest declines? South Dakota (down 0.4%), Texas (down 0.6%) and Nebraska (down 0.8%).
Mind the gap
The divide between the good years and the rough ones is a simple way to see how wild a job market’s ups and downs are.
Looking at this good times/bad times gap over the half century, California had the seventh-largest difference – 37% higher than the national average.
The biggest gaps? Nevada (75% above the norm), the District of Columbia (53% above) and Florida (48% above). The smallest? South Dakota (59% below the norm), Nebraska (44% below) and North Dakota (38% below).
Risk and reward
However, there’s a price to pay for stability.
Picture ranking all the states by how bumpy their job markets are, averaging those deviation and gap scores, and then splitting them into three groups.
First, the 17 states with the smallest job swings. Those “calm” places — volatility 23% below average — collectively enjoyed 1% a year employment growth over the past half century.
Next, check out the nation’s wildest markets — the 17 states with the biggest swings, running 25% above average.
They posted much stronger job growth: 1.5% a year.
The lesson? Dynamic markets bring both pain and gain. It’s Economics 101: take risks, get rewards.
Jonathan Lansner is the business columnist for the Southern California News Group. He can be reached at jlansner@scng.com
Try Jonathan Lansner’s Substack collection of economic trends. CLICK HERE!
September’s most popular Southern California real estate stories …
No. 1: Taco Bell relocation its longtime Irvine headquarters
No. 2: Diane Keaton’s former Laguna Beach flip lists for $10 million
No. 3: What’s the best housing market in Southern California?
No. 4: Dolly Parton’s former Solvang cottage compound lists for $2 million
No. 5: Newport Coast home linked to Latin music star Peso Pluma seeks $14 million
No. 6: Ultra-luxe, ‘overengineered’ beachfront Dana Point estate seeks $65 million
No. 7: California wants more fines against Huntington Beach in housing lawsuit
No. 8: Laguna Cliffs Marriott Resort rebrands amid renovation
No. 9: Historic Dana Point home by Hollywoodland developer lists for $2.2 million
No. 10: Newport Beach waterfront estate with multi-boat dock lists for $58 million
No. 11: Costa Mesa approves plan to replace Fairview Center with 2,300 new homes
No. 12: 2-year-old Zia apartment complex sells in Anaheim
No. 13: California tenants suffered 8th-highest rent hikes in US over four decades