

Farmers & Merchants Bank of Long Beach went into the Q3 2026 release priced for perfection, trading on a P/E multiple well above the broader US banks group. The headline result was anything but perfect. The bank reported a sharp earnings loss, with basic earnings per share swinging from US$293.88 in Q2 to a loss of US$304.32 in Q3, driven by a collapse in reported revenue to US$6.79 million.
Yet the stock barely flinched, edging up about 0.5% on the day. That calm price move sits awkwardly against a quarter that places the profit and valuation strain front and center.
Love the long-term track record of Farmers & Merchants Bank of Long Beach but uneasy about a rich P/E multiple paired with a quarterly loss? Compare it to a list of solid balance sheet and fundamentals stocks (25 results) to see how other banks with sturdy fundamentals stack up.
Q3 2026 Earnings Summary Q3 2026 Total Revenue vs. Q3 2025: US$6.79 million vs. US$75.57 million (sharp decline in reported revenue) Q3 2026 Net Income vs. Q3 2025: loss of US$36.78 million vs. profit of US$18.13 million (moved from profit to loss) Q3 2026 Basic EPS vs. Q3 2025: loss of US$304.32 per share vs. profit of US$148.46 per share (swing from positive to negative EPS) Net Interest Margin (NIM) Q3 2026 vs. Q3 2025: not disclosed for Q3 2026 vs. 2.47% in Q3 2025 (latest quarterly NIM not reported)
Ask Charlie what Farmers & Merchants Bank’s rich P/E is pricing in.
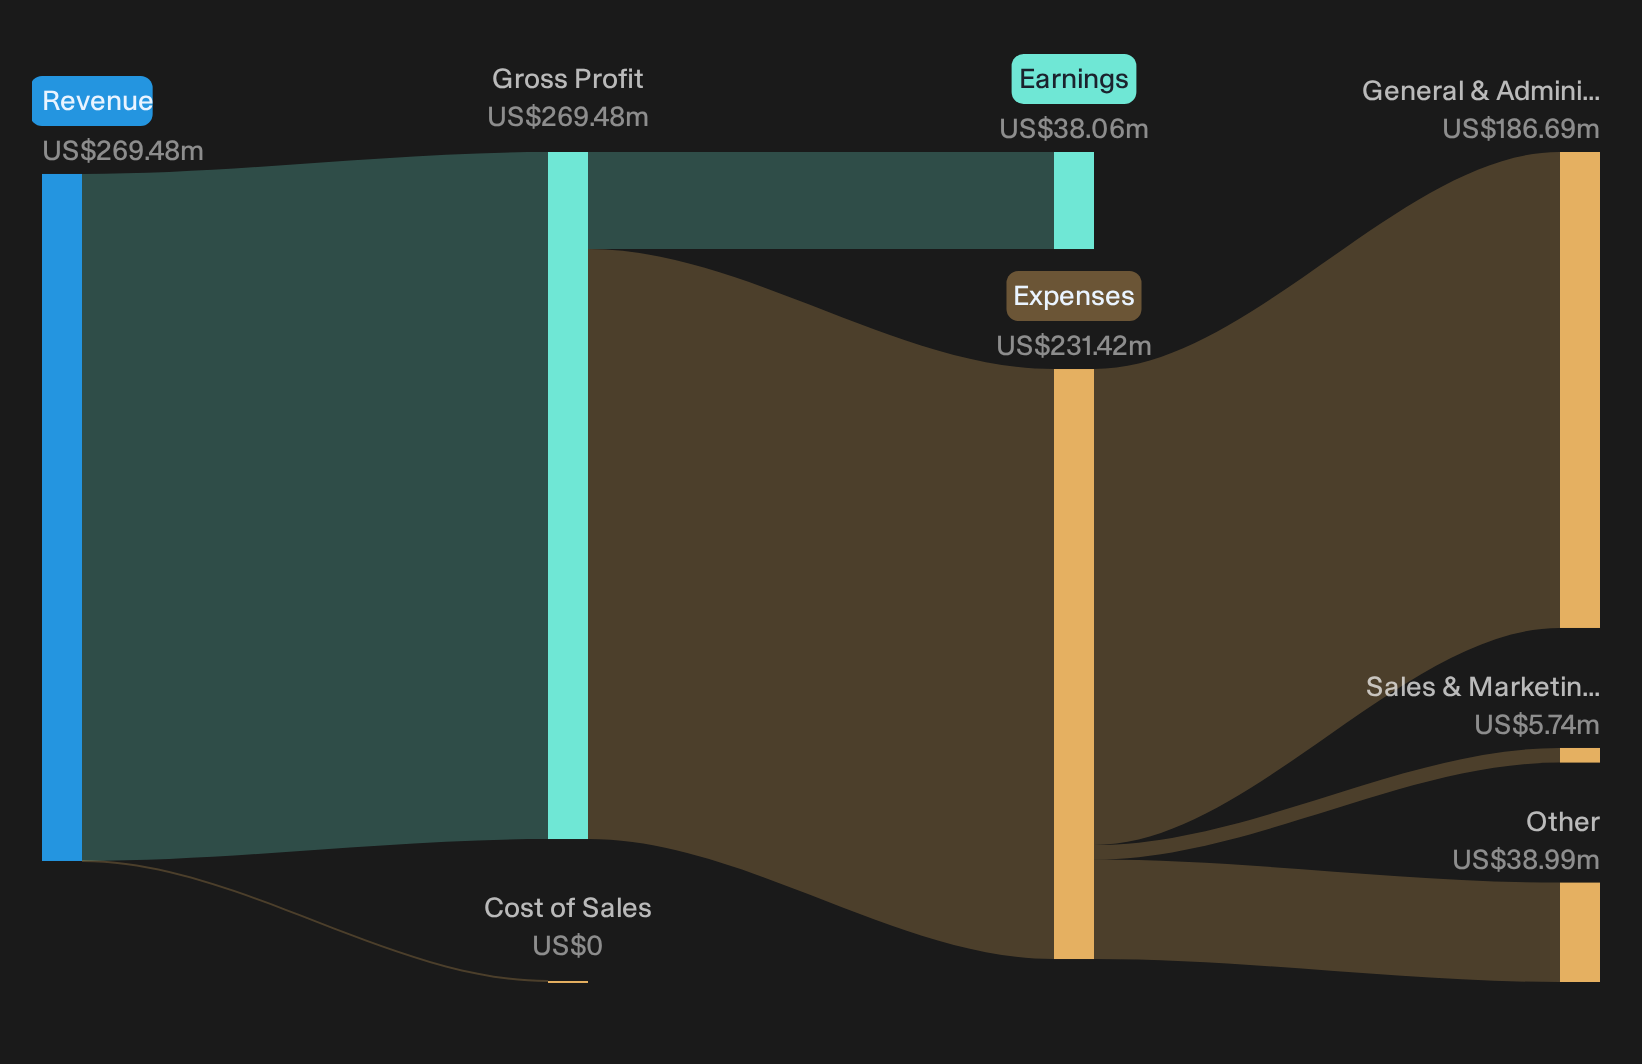 OTCPK:FMBL Trailing 12-Month Revenue & Expenses Breakdown as at Oct 2026 Farmers & Merchants: Stress Test Of The Optimistic Story
The long history and community focus of Farmers & Merchants Bank of Long Beach still signal staying power, yet this quarter cuts against the comfortable, steady-bank narrative. Revenue dropped to US$6.79 million and net income swung to a loss of US$36.78 million, which jars with the idea of quietly dependable earnings. The recent US$1b securities repositioning and ongoing dividend stream, including the 538th consecutive payment, show management leaning into balance sheet flexibility and capital returns. However, the immediate earnings hit makes that long term pitch harder to lean on right now.
Farmers & Merchants: Bearish Concerns Meet Hard Numbers
If you were already worried about concentration and rate sensitivity, this result gives that caution more weight. Profitability moved from a US$18.13 million gain in Q3 2025 to a US$36.78 million loss, and basic EPS flipped from a US$148.46 profit to a US$304.32 loss. Revenue compressed to US$6.79 million and the absence of a disclosed current net interest margin keeps questions around core banking returns alive. The share price barely moved, up 0.53% on the day, yet the earnings profile now looks much harsher than the calm trading suggests.
After a revenue collapse, an earnings loss and no fresh NIM disclosure, it is fair to ask whether Farmers & Merchants Bank of Long Beach is facing a one quarter wobble or something more structural. Review the independent risk analysis for Farmers & Merchants Bank of Long Beach which shows 1 important warning sign Hunt For Disconnects In Plain Sight
Farmers & Merchants Bank of Long Beach highlights how steady share prices can conceal growing earnings pressure. The real opportunity is studying stocks that could be undervalued before the market revises their pricing.
Company 1 – 48% below our estimate – faces higher labor and technology costs as a large public-project backlog prompts investment in productivity tools and workforce capacity. Company 2 – 49% below our estimate – expands an app-focused store network and frequent product launches while aiming to translate heavy delivery, rental and technology spending into stronger unit-level economics. Company 3 – 47% below our estimate – supplies steel reinforcement products as public works demand and data center projects require greater use of engineered structural mesh.
Three companies from the same screener. Open all 34 potentially undervalued companies →
This article by Simply Wall St is general in nature. We provide commentary based on historical data
and analyst forecasts only using an unbiased methodology and our articles are not intended to be financial advice. It does not constitute a recommendation to buy or sell any stock, and does not take account of your objectives, or your
financial situation. We aim to bring you long-term focused analysis driven by fundamental data.
Note that our analysis may not factor in the latest price-sensitive company announcements or qualitative material.
Simply Wall St has no position in any stocks mentioned.
New: AI Stock Screener & Alerts
Our new AI Stock Screener scans the market every day to uncover opportunities.
• Dividend Powerhouses (3%+ Yield)
• Undervalued Small Caps with Insider Buying
• High growth Tech and AI Companies
Or build your own from over 50 metrics.
Have feedback on this article? Concerned about the content? Get in touch with us directly. Alternatively, email editorial-team@simplywallst.com