
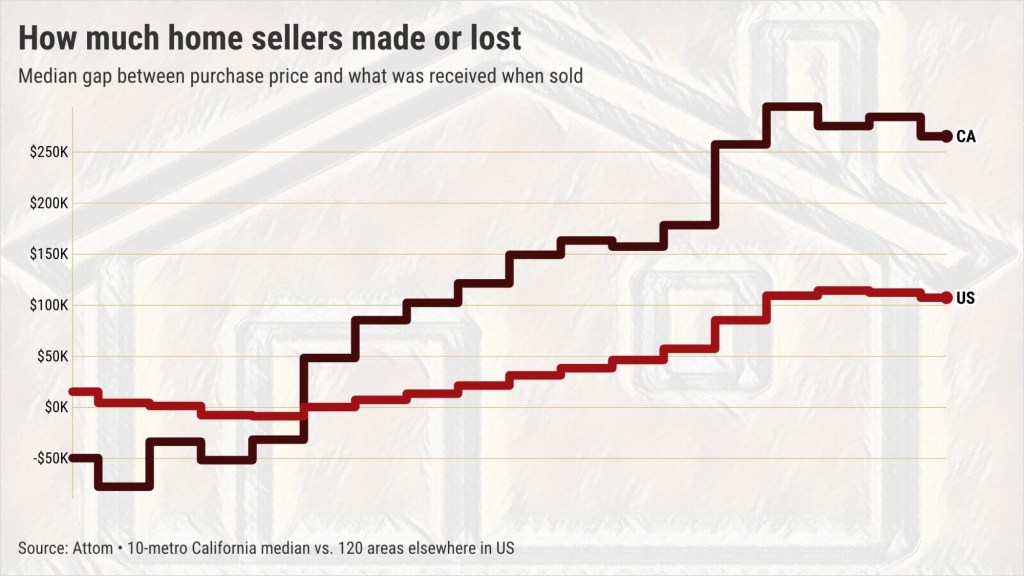
California home sellers made more than double what their American peers made last year – but that gap is shrinking.
My trusty spreadsheet took a peek at stats from Attom dating to 2008 that track the difference between the price a typical homeowner got when they sold vs. their purchase cost in 130 metropolitan areas, including 10 in California. This “profit” gap – and remember we’ve had years at a loss, too – does not include the cost of upgrades, maintenance, mortgage interest or transaction expenses.
For sellers in California’s 10 metros in 2025, the median gain was $265,000. Meanwhile, sellers in the 120 metros outside the nation saw a $107,000 profit.
Yes, that’s $158,000 extra for the typical California seller. But that’s the smallest geographic divide in five years – down from $185,000 in 2022 – as home prices appreciated more rapidly outside of California in recent years.
Price pains
Of course, California’s larger dollar gains come with a cost: purchase prices.
The typical Californian made the big bucks buying a $422,000 median-priced home and selling it for $687,000. Outside of the Golden State, it was a $215,000 purchase and a $322,000 sale.
Additionally, the diminishing profit disparity is seen when evaluating a seller’s gain as a portion of the purchase price.
A 2025 California seller realized a 63% raw gain vs. 50% elsewhere. But since 2008, the typical Golden State sale created a 50% gain, far above the 20% profit nationally.
No matter the yardstick, it’s clear that more American homes produce noteworthy gains. Those fatter profits are a key reason why long-running California housing woes – from affordability challenges to “NIMBY” resistance to new development to income inequality – have spread nationwide.
Not always winners
Do not forget that sellers aren’t always winning. Ownership losses were painful surrounding the Great Recession.
In California, five of the past 18 years had median losses, with sellers across the 10 metros experiencing extremes from a $294,000 gain in 2022 to a $78,000 loss in 2009.
Elsewhere in the U.S., two of the past 18 years resulted in seller losses. Typical results ranged from a $114,000 gain in 2023 and a $9,000 loss in 2012.
Locally speaking
California metros dominated the national profit rankings last year.
The San Jose metro’s $755,000 typical seller’s gain last year was the highest nationally, at 94%. Seller outcomes ranged from a $782,250 gain in 2024 to a $75,000 loss in 2009.
San Francisco’s $463,500 gain was No. 2 nationally. That is a 70% profit, with extremes ranging from a $541,750 gain in 2022 to an $80,000 loss in 2009.
San Diego’s $346,000 gain was No. 3 – a 64% profit. Extremes? $371,000 gain in 2024 to a $73,500 loss in 2009.
Los Angeles-Orange County’s $345,500 gain was No. 4 – a 56% profit. Extremes? $360,250 gain in 2024 to $40,000 loss in 2009.
Elsewhere in the Golden State …
Ventura County: $305,000 gain (No. 6 nationally) – a 55% profit. Extremes? $331,000 gain in 2024 to $74,000 loss in 2009.
Inland Empire: $225,000 gain (No. 10) – a 64% profit. Extremes? $248,000 gain in 2022 to $144,000 loss in 2009.
Sacramento: $200,500 gain (No. 15) – a 54% profit. Extremes? $236,500 gain in 2022 to $94,000 loss in 2011.
Stockton: $195,000 gain (No. 17) – 64% profit. Extremes? $260,000 gain in 2022 to $167,500 loss in 2009.
Fresno: $154,000 gain (No. 31), a 62% profit. Extremes? $174,500 gain in 2022 to $53,000 loss in 2011.
Bakersfield: $132,500 gain (No. 46) – a 61% profit. Extremes? $147,000 gain in 2024 to $82,500 loss in 2009.
Jonathan Lansner is the business columnist for the Southern California News Group. He can be reached at jlansner@scng.com