
Although the Port of Los Angeles and Port of Long Beach collectively had year-over-year declines in the past two months, they nevertheless logged their respective best and second-best quarters on record.
The third quarter for the two ports was capped off with 883,053 containers processed at L.A. and 797,537 at Long Beach, for a combined 1.68 million processed at the port complex in September. This was a collective decline by about 104,000 containers the previous year.
The ports have July to thank for producing a benchmark quarter, which saw a combined total of more than 5.5 million containers moved – up by just over 24,000 containers.
Officials, as usual, attributed the sclerotic nature of this year’s cargo movement to the ever-changing trade policies pushed by President Donald Trump’s administration.
“As trade policy unfolds, we can only predict more unpredictability,” said Gene Seroka, executive director of the Port of L.A., at his monthly media briefing. “When sweeping changes were first announced, importers abruptly stopped their orders from China. When those policies were softened and deadlines extended, cargo volume picked up again. The supply chain has been on a roller coaster all year and that ride continues.”
Dockworkers at the Port of L.A. moved 460,044 loaded import containers in September, while those at the Port of Long Beach logged 388,084 loaded import containers. Both represented declines from the prior year.
Loaded exports at L.A. remained essentially even, with 114,693 containers logged; meanwhile, Long Beach saw a small decline of 85,081 loaded exports. The remaining sum of containers represents empty units coming to or leaving the ports.
Comparative volumes throughout the year have deviated from the usual pattern as importers jockeyed to get ahead of enacted or threatened tariffs. More than a third of all U.S. imports move through L.A. and Long Beach, so any major shift in trade policy will show an immediate impact.
“Tariffs are impacting how consumers and business owners make financial decisions and purchases,” said Port of Long Beach Chief Executive Mario Cordero. “Our Supply Chain Information Highway digital cargo tracker is forecasting a relatively stable October, followed by a slight decline in November due to anticipated weather-related delays and vessel scheduling changes.”
Several months this year, for example, have set individual cargo records as a result of importers racing to get in their products before tariffs made things more expensive. Twice now this year, there have been two consecutive months of declines, reflecting the enactment of the tariffs.
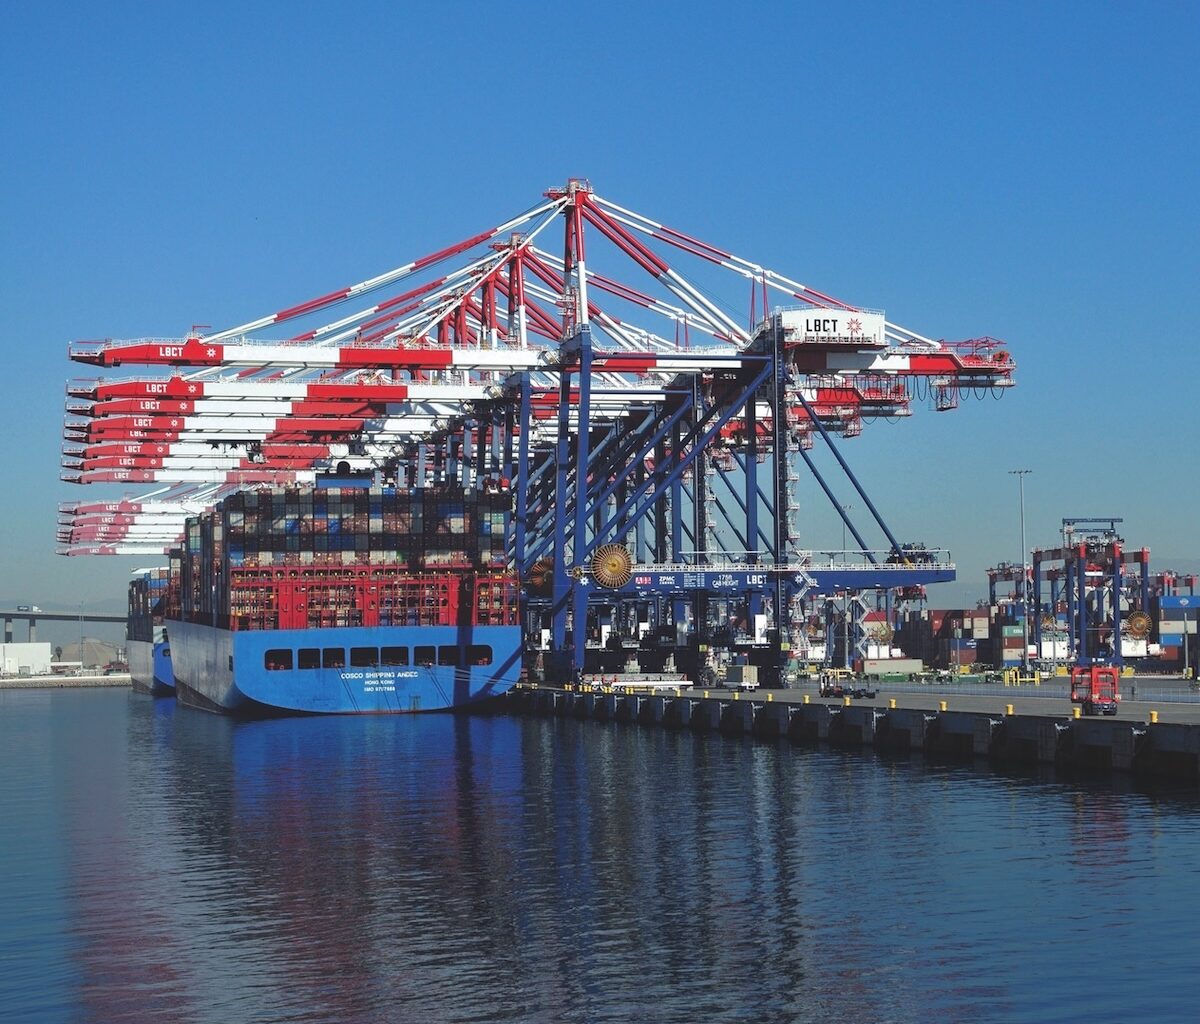
“Approximately 20% of vessels that call at the Port of Los Angeles are China-made,” Seroka noted. “Some cargo-handling equipment and cranes are also manufactured in China. Tariffs in one area tend to lead to rising prices in other segments, in the end making goods more expensive.”
The ports would need to move about 4.74 million containers from October through December to match last year’s total volume. This breaks down to about 1.58 million containers a month, or about 790,000 each per month.
One area of progress for September was how quickly cargo containers leave the ports once they’re offloaded from their ships.
This so-called dwell time averaged about 2.75 days for drayage truck-bound cargo, down from 3.21 days last September and largely in line with most of this year’s rate. Meanwhile, rail-bound cargo saw a major improvement of 3.98 days from last September’s 9.25 days. September’s average was also the second best for rail-bound cargo all year.
“The sustained truck and rail dwell times in September are a clear sign that marine terminals, drayage partners, and rail operators are maintaining high levels of efficiency,” said Natasha Villa, external affairs manager of the Pacific Merchant Shipping Association. “These results underscore the continued collaboration and resilience across the San Pedro Bay logistics network during this year’s peak season as it manages strong cargo flows heading into the final quarter of the year.”