
Important Note: The employment data for the month of March 2026 comes from the survey week that included March 12. The release date for April 2026 data is scheduled for release on May 22.
May 2, 2026 – SACRAMENTO — California’s unemployment rate was 5.3 percent1 in March 2026, which is a 0.1 percentage point decline from the month prior. The State gained 28,700 nonfarm payroll jobs2 in March 2026 according to recent data released by the Employment Development Department (EDD) coming from two separate surveys. Total nonfarm employment for February was revised up (+1,100) to a total loss of 18,800 jobs for the month.
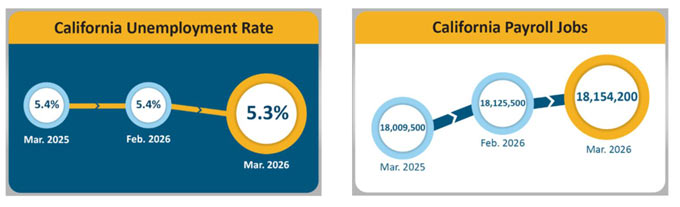
California’s Labor Market, by the Numbers…
Month over, the State’s unemployment rate decrease of 0.1 percentage points mirrors that of the nation. Year over, the State’s unemployment rate declined by 0.1 percentage points whereas the nation experienced a 0.1 percentage point increase.
California has added 91,700 jobs since the beginning of 2026, which averages out to more than 30,560 jobs added per month. It’s the strongest start to a calendar year since 2022.
March’s decline in the number of unemployed Californians (-17,100) marks the fifth consecutive month of reductions with a total decline of 44,000 persons over that timeframe.
Five of California’s 11 industry sectors gained jobs in March, led by strong gains in Private Education & Health Services (+27,800) as a major strike affecting the sector ended. Offices of Other Health Practitioners, Nursing Care Facilities, and Individual and Family Services also showed noticeable gains.
Professional & Business Services (-3,400) suffered the largest month-over loss for the State due to larger-than-usual drops in Computer System Design and Related Services, and Scientific Research and Development Services. Accounting, Tax Preparation, and Bookkeeping Services also experienced losses despite it being tax season at the time.
1. The unemployment rate comes from a separate federal survey of 4,400 California households.
2. The nonfarm payroll job numbers come from a federal survey of 80,000 California businesses.
Data Trends about Jobs in the Economy
Total Nonfarm Payroll Jobs (Comes from a monthly survey, seasonally adjusted, of approximately 80,000 California businesses)
Month-over — Total nonfarm jobs in California’s 11 major industries amounted to 18,154,200 in March – a gain of 28,700 from February. This followed February’s upward revision of 1,100 jobs, resulting in a month-over February loss of 18,800 jobs.
Year-over — Total nonfarm jobs increased by 144,700 (0.8% percent increase) from March 2025 to March 2026 compared to the U.S. year-over gain of 260,000 jobs (0.16% percent increase).
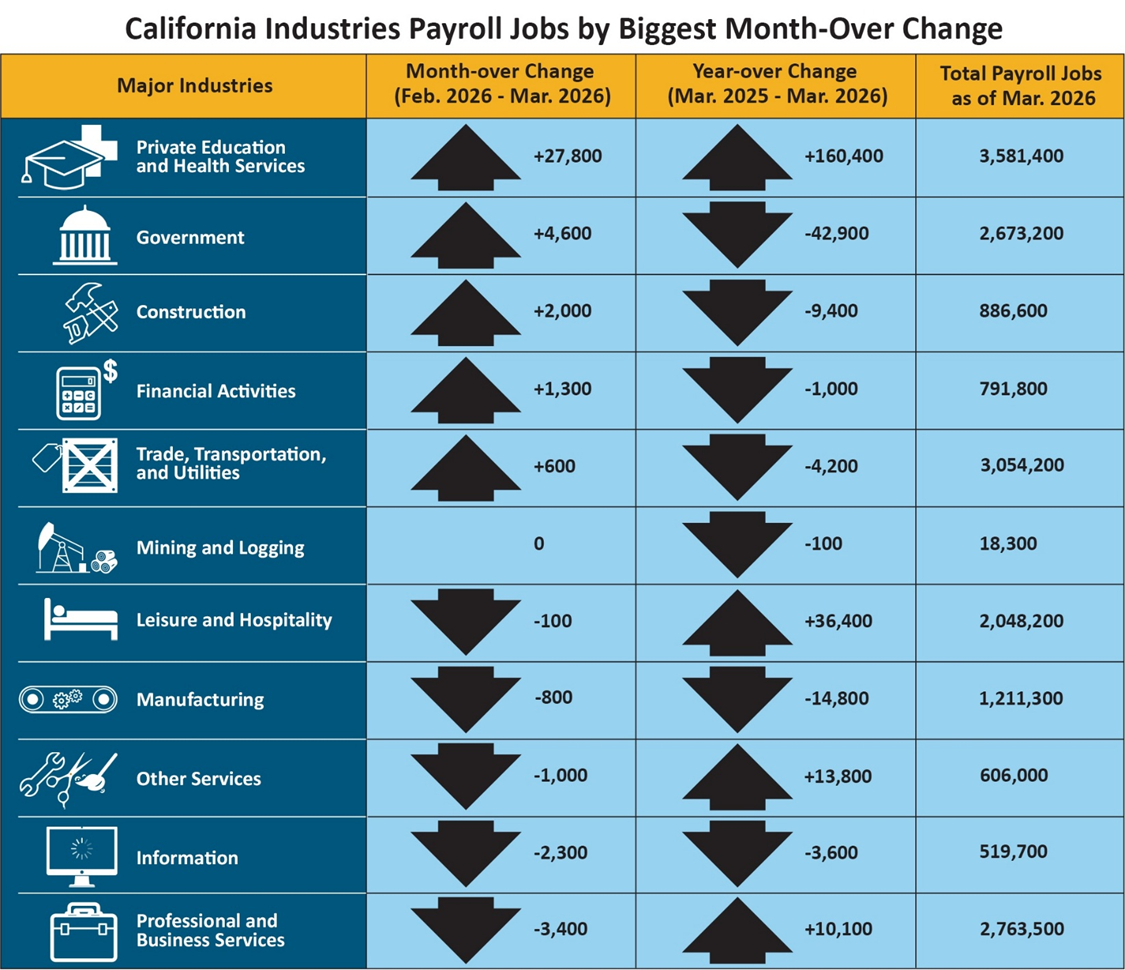
Total Farm Jobs — The number of jobs in the agriculture industry decreased from February by 200 to a total of 414,200 jobs in March. The agriculture industry had 20,800 more farm jobs in March 2026 than it did in March 2025.
Data Trends about Workers in the Economy
Employment and Unemployment in California (Based on a monthly federal survey of 4,400 California households which focuses on workers in the economy)
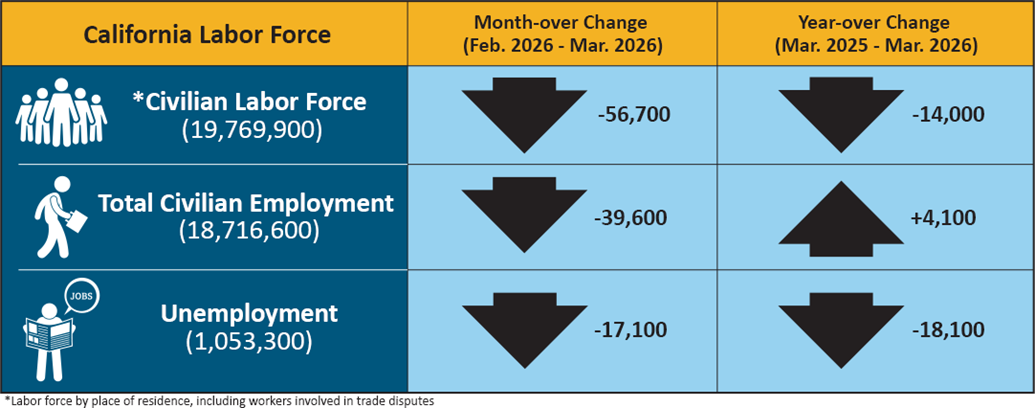
Employed — The number of Californians employed in March was 18,716,600, a decrease of 39,600 from February, but up 4,100 compared to March of last year.
Unemployed — The number of unemployed Californians was 1,053,300 in March, a decrease of 17,100 from February and a decrease of 18,100 from March 2025.
Unemployment Insurance Claims (Not Seasonally Adjusted)
The following data is from a sample week that includes the 19th of each month:
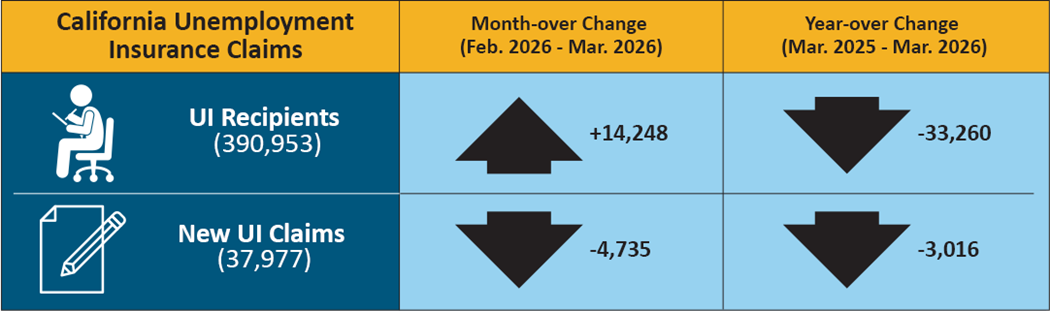
In related data that figures into the State’s unemployment rate, there were 390,953 people certifying for Unemployment Insurance (UI) benefits during the March 2026 sample week. That compares to 376,705 people in February and 424,213 people in March 2025. Concurrently, 37,977 initial claims were processed in the March 2026 sample week, which was a month-over decrease of 4,735 claims from February and a year-over decrease of 3,016 claims from March 2025.
MONTHLY LABOR FORCE DATA FOR COUNTIES
March 2026 (Preliminary); 2025 Benchmark
NOT SEASONALLY ADJUSTED
COUNTYLABOR FORCEEMPLOYMENTUNEMPLOYMENTRATE
STATE TOTAL
19,740,400
18,655,800
1,084,600
5.5%
ALAMEDA
862,700
826,000
36,800
4.3%
ALPINE
590
550
40
6.8%
AMADOR
15,070
14,190
880
5.8%
BUTTE
91,000
85,400
5,500
6.1%
CALAVERAS
17,540
16,430
1,100
6.3%
COLUSA
11,560
9,590
1,970
17.0%
CONTRA COSTA
578,900
553,600
25,400
4.4%
DEL NORTE
9,320
8,720
590
6.4%
EL DORADO
90,300
85,900
4,400
4.9%
FRESNO
477,900
435,000
42,900
9.0%
GLENN
11,740
10,850
890
7.6%
HUMBOLDT
60,400
57,300
3,100
5.1%
IMPERIAL
73,700
61,200
12,500
16.9%
INYO
8,340
7,970
370
4.5%
KERN
407,300
368,800
38,500
9.5%
KINGS
58,900
53,100
5,800
9.9%
LAKE
26,640
24,680
1,970
7.4%
LASSEN
8,230
7,610
620
7.5%
LOS ANGELES
5,072,800
4,815,800
256,900
5.1%
MADERA
70,000
64,000
6,000
8.5%
MARIN
123,400
118,700
4,700
3.8%
MARIPOSA
6,830
6,340
490
7.1%
MENDOCINO
36,770
34,620
2,160
5.9%
MERCED
124,600
111,400
13,200
10.6%
MODOC
3,060
2,780
270
9.0%
MONO
8,520
8,200
330
3.8%
MONTEREY
215,100
193,600
21,600
10.0%
NAPA
73,600
70,500
3,200
4.3%
NEVADA
47,040
44,810
2,220
4.7%
ORANGE
1,615,900
1,554,600
61,300
3.8%
PLACER
208,800
200,400
8,400
4.0%
PLUMAS
7,320
6,570
750
10.3%
RIVERSIDE
1,195,000
1,133,700
61,300
5.1%
SACRAMENTO
786,100
748,500
37,600
4.8%
SAN BENITO
34,700
32,200
2,400
7.0%
SAN BERNARDINO
1,033,700
982,200
51,500
5.0%
SAN DIEGO
1,665,100
1,593,800
71,300
4.3%
SAN FRANCISCO
501,100
482,500
18,600
3.7%
SAN JOAQUIN
373,700
349,300
24,500
6.5%
SAN LUIS OBISPO
132,400
127,000
5,500
4.1%
SAN MATEO
410,000
395,600
14,300
3.5%
SANTA BARBARA
222,600
212,200
10,400
4.7%
SANTA CLARA
1,032,700
993,400
39,300
3.8%
SANTA CRUZ
136,400
127,000
9,400
6.9%
SHASTA
81,900
77,400
4,500
5.5%
SIERRA
1,310
1,230
80
6.3%
SISKIYOU
16,260
14,830
1,430
8.8%
SOLANO
219,100
208,000
11,100
5.1%
SONOMA
246,400
236,000
10,400
4.2%
STANISLAUS
255,500
237,300
18,300
7.2%
SUTTER
46,100
41,600
4,500
9.7%
TEHAMA
27,360
25,630
1,730
6.3%
TRINITY
5,500
5,120
370
6.8%
TULARE
218,200
193,200
25,000
11.5%
TUOLUMNE
21,930
20,740
1,190
5.4%
VENTURA
421,900
403,200
18,700
4.4%
YOLO
112,700
106,200
6,500
5.7%
YUBA
36,300
33,700
2,600
7.0%
Source: CA. EDD