
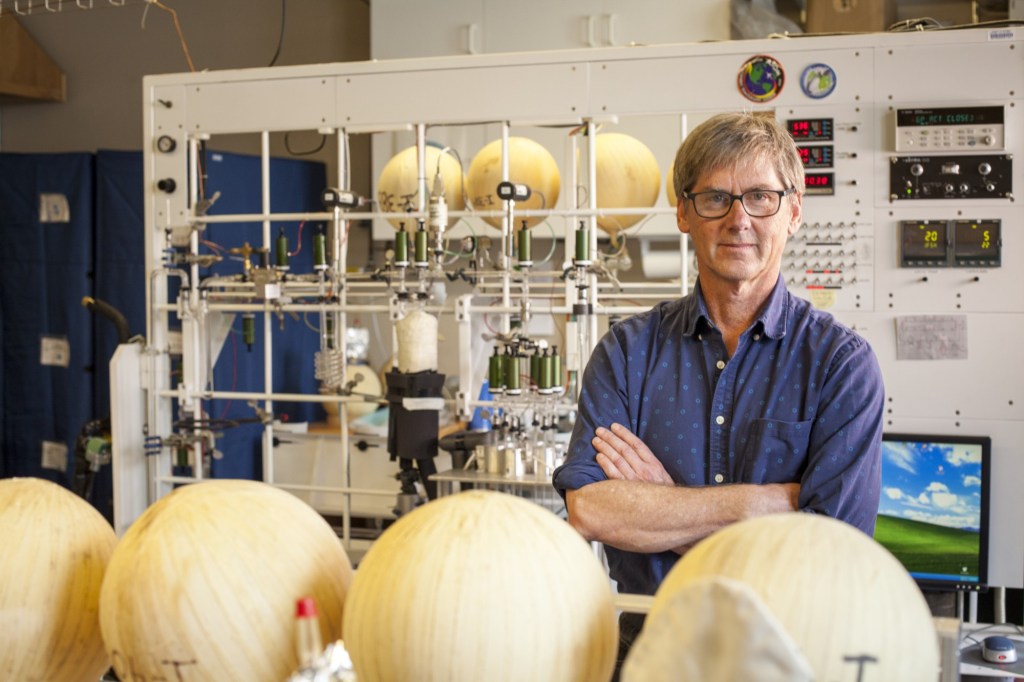
Though researchers have been saying for decades that carbon dioxide levels are on the rise, a recent measurement conducted by scientists at UC San Diego’s Scripps Institution of Oceanography in La Jolla indicates levels have reached a new annual peak.
“I wish we had better news,” said Ralph Keeling, director of the Scripps Oceanography carbon dioxide program. “The overall picture is worrisome. Carbon dioxide levels have been going up for as long as people have been measuring it, so it’s easy to get used to it as the norm. But there is nothing normal about it.
“We track these changes because it’s important to know how fast [levels are] going up because there could be indications that we could be turning a corner to see if we can make a change. But the speedometer keeps going up.”
Like other greenhouse gases, carbon dioxide acts like a blanket, trapping heat and warming the lower atmosphere, according to SIO. This changes weather patterns and fuels extreme events such as heat waves, droughts and wildfires, as well as heavier precipitation and flooding, scientists say.
Rising carbon dioxide levels also can contribute to ocean acidification, a change in ocean chemistry that makes it more difficult for marine organisms such as crustaceans, bivalves and coral to grow hard, carbonate skeletons or shells.
Measuring carbon dioxide levels has been a priority and a project for nearly 70 years.
In 1958, SIO scientist Charles David Keeling, father of Ralph Keeling, began monitoring carbon dioxide concentrations at the National Oceanic and Atmospheric Administration weather station at the Mauna Loa Observatory in Hawaii. He recorded an initial measurement of 313 parts per million on March 29 that year.
The Mauna Loa Observatory is considered the global benchmark location for monitoring atmospheric carbon dioxide. At 11,141 feet above sea level, the observatory produces measurements that are considered to represent the average state of the atmosphere in the Northern Hemisphere.
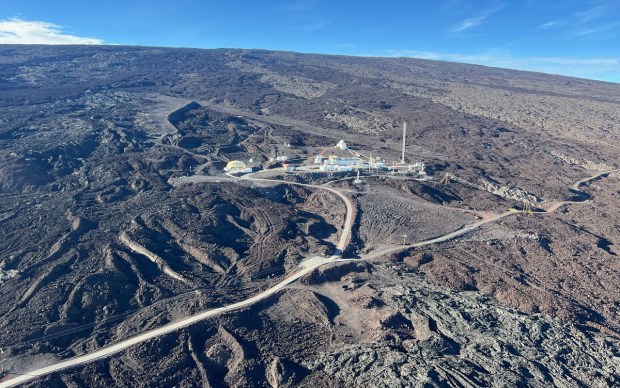 The Mauna Loa Observatory in Hawaii is considered the global benchmark location for monitoring atmospheric carbon dioxide. (Christine Smith)
Charles Keeling was the first to recognize that carbon dioxide levels in the Northern Hemisphere peaked in May, fell during the growing season due to increased plant life engaging in photosynthesis, and rose again as plants died in the fall. He documented those fluctuations as what came to be known as the Keeling Curve.
He also was the first to report that, in addition to the seasonal fluctuation, carbon dioxide levels were rising every year.
This year’s reading from May was 432 parts per million, an increase over the May 2025 measurement of 430.2.
The Mauna Loa data, together with measurements from sampling stations around the world, are incorporated into NOAA’s Global Greenhouse Gas Reference Network, a research dataset for international climate scientists and a benchmark for policymakers trying to address the causes and effects of climate change.
“The measurements at Mauna Loa are the flagship measurements for what is now a community making similar measurements around the world,” Ralph Keeling said. “With this community, you can track where carbon dioxide is coming from and where it is going. The reason to measure around the world is that we can learn about what is controlling the rise. We can see patterns in the atmosphere.”
One of the “two big applications” for this data is tracking carbon dioxide sources “so we can see how much got emitted and how it got used,” Keeling said. “We want a detailed budget so we can keep track of what’s happening and measure whether human activities are making a difference.”
The data also provides a baseline that could help point out anomalies in climate change, he said.
“There is always room for surprises,” Keeling said. “As the planet warms, the ecosystems of the world might behave differently. So we need to track feedback, which is where something happens and we see whether [carbon dioxide readings] got better or worse.”
“Everyone on the planet is going to be impacted one way or another by this,” he said. “In California, water availability could be affected because we are losing snowpacks and could see changes in rain patterns. And heat waves are going to get worse and fire risk will get worse.” ♦