
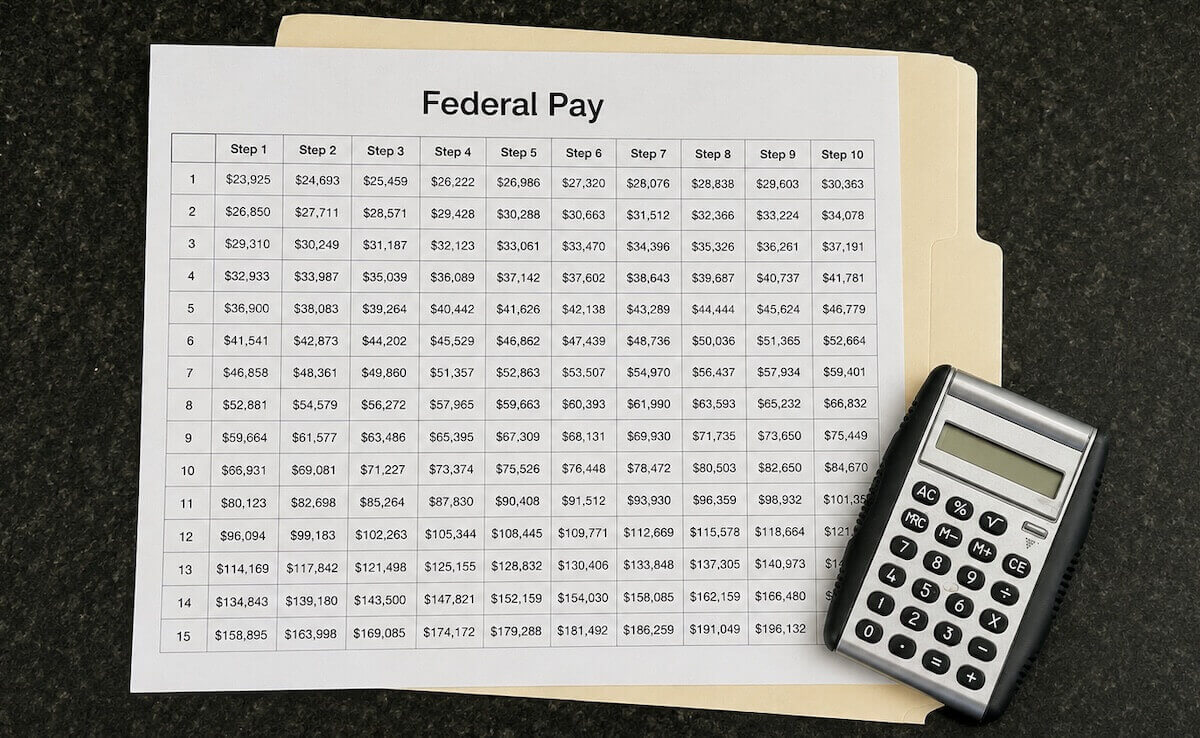
Federal employees under the General Schedule receive a base salary plus a locality payment that varies by geographic area. The 2026 rates range from 17.06% in the Rest of U.S. locality pay area to 46.34% in the San Jose-San Francisco-Oakland, CA, locality pay area.
The federal locality pay system adjusts General Schedule salaries to reflect differences in non-federal pay levels across geographic regions. Authorized by the Federal Employees Pay Comparability Act of 1990, the system took effect in January 1994. Its purpose is to reduce pay disparities between federal and non-federal workers performing similar work in the same labor market.
Locality payments are calculated as a percentage of base pay and applied according to the employee’s official worksite. The Office of Personnel Management publishes annual tables that incorporate both the across-the-board base pay increase and the locality adjustment for each designated area. For 2026, locality pay percentages remain at the prior year’s levels, while base pay received a 1.0% across-the-board increase.
How Locality Pay Areas Are Defined
A locality pay area is a geographic region where federal employees receive an additional percentage adjustment. The President’s Pay Agent defines these areas after receiving recommendations from the Federal Salary Council.
The Bureau of Labor Statistics supplies the underlying data by comparing General Schedule pay with non-federal compensation at comparable work levels. The cost of living is not a direct factor in the calculations. Pay disparity between federal and non-federal salaries is the primary driver. As of 2026, there are still 58 locality pay areas, including separate areas for Alaska and Hawaii and the residual Rest of U.S. category.
Highest and Lowest 2026 Locality Rates
Top 10 Highest 2026 Locality Pay Areas (GS-13 Step 5)
RankLocality Pay Area2026 Rate2026 Annual Salary (High-3 Base)1San Jose-San Francisco-Oakland, CA46.34%$150,8022New York-Newark, NY-NJ-CT-PA37.95%$142,1563Los Angeles-Long Beach, CA36.47%$140,6314Houston-The Woodlands, TX35.00%$139,1165Washington-Baltimore-Arlington33.94%$138,0246San Diego-Chula Vista-Carlsbad, CA33.72%$137,7977Boston-Worcester-Providence32.58%$136,6228Alaska32.36%$136,3969Hartford-East Hartford, CT-MA32.08%$136,10710Seattle-Tacoma, WA31.57%$135,582
Average high-3 (top 10): $139,323
Bottom 10 Lowest 2026 Locality Pay Areas (GS-13 Step 5)
RankLocality Pay Area2026 Rate2026 Annual Salary (High-3 Base)1Rest of U.S.17.06%$120,6292Reno-Fernley, NV17.52%$121,1033Corpus Christi-Kingsville-Alice, TX17.63%$121,2174Fresno-Madera-Hanford, CA17.65%$121,2375Spokane-Spokane Valley-Coeur d’Alene17.67%$121,2586Rochester-Batavia-Seneca Falls, NY17.88%$121,4747Palm Bay-Melbourne-Titusville, FL17.93%$121,5268Des Moines-Ames-West Des Moines, IA18.01%$121,6089Indianapolis-Carmel-Muncie, IN18.15%$121,75210Omaha-Council Bluffs-Fremont, NE-IA18.23%$121,835
Average high-3 (bottom 10): $121,364
Summary Impact Chart (2026)
MetricTop 10 AverageBottom 10 AverageDifferenceAverage High-3 Salary$139,323$121,364+$17,959Estimated Annual FERS Annuity (1% × 30 yrs)$41,797$36,409+$5,388Difference in Retirement Pay over 5 Years——+$26,940
These percentage differences compound over time. Prior FedSmith reporting has shown how cumulative annual differences of even 2–3 percentage points can produce salary gaps exceeding $20,000 at mid-level grades within a five-to-seven-year span.
The five-year cumulative column assumes the 2026 rates remain constant for illustration. Actual future rates will vary with annual adjustments, but the table demonstrates the scale of the ongoing differential. An employee in the San Jose-San Francisco-Oakland area receives nearly $30,000 more per year than a counterpart in the Rest of U.S. area at the identical grade and step. Over five years, that gap exceeds $149,000 before taxes or benefits.
Impact on Federal Salaries Across Regions
Because locality pay is added to base pay, employees in high-rate areas receive higher total compensation for the same grade and step. The system therefore produces clear winners and losers in absolute salary terms. Employees stationed in the San Francisco Bay Area or New York metropolitan region benefit from the largest adjustments. Those in the Rest of U.S. category, which still covers a sizable share of the workforce, receive the smallest supplements.
The expansion of locality pay areas has narrowed the Rest of U.S. share over the past decade. New areas created in recent years moved thousands of employees out of the residual category and into higher-rate tables. Once an area is designated, subsequent annual adjustments continue to reflect local pay disparities measured by the Bureau of Labor Statistics.
Locality Pay and Other Federal Benefits
Locality pay counts as basic pay for several major benefits. According to Office of Personnel Management guidance on administering locality rates, the locality-adjusted rate is used to compute retirement deductions and benefits, life insurance premiums and benefits, premium pay, severance pay, and lump-sum payments for annual leave.
This treatment means that employees in higher-locality areas contribute more to the Federal Employees Retirement System and the Civil Service Retirement System due to their higher salaries. They also receive correspondingly higher life insurance coverage under the Federal Employees’ Group Life Insurance program when coverage is tied to annual basic pay.
Locality Pay Impact on Retirement Income
The high-3 average salary used to calculate Federal Employees Retirement System and Civil Service Retirement System annuities includes locality pay. An employee’s three highest consecutive years of basic pay, including the applicable locality percentages, form the base for the annuity formula. Because locality rates differ by location, two employees with identical grades, steps, and years of service can retire with different monthly annuities solely because of the locality rates applied during their high-3 period.
Using the 2026 GS-13, Step 5 figures, the average high-3 difference between the top-10 and bottom-10 locality areas is nearly $18,000. Under the standard Federal Employees Retirement System formula—1% of high-3 multiplied by years of service (or 1.1% for employees retiring at age 62 or later with 20 or more years)—that salary gap produces a permanent difference in the annual annuity, measured in thousands of dollars.
The high-3 period is not required to be the final three years of service. If an employee worked earlier in a higher-locality area, those earlier years may form the high-3 if they produce a larger average. Conversely, transferring to a lower-locality area in the final years of a career can lock in a lower high-3 if the recent lower rates become the highest consecutive three-year average. Once the annuity is computed, the benefit is fixed and is not reduced if the retiree later moves to a lower-cost area.
This means that locality pay flows directly into the high-3 average salary used to compute CSRS and FERS basic annuities. High-3 is the average of an employee’s highest three consecutive years of basic pay. For most GS employees, locality-adjusted basic pay is included. A career spent primarily in a high-percentage locality, or a late-career move into one, raises the final three years and produces a higher annuity for life. The reverse—moving to a lower-percentage area near retirement—can lower the high-3 if those years end up being the highest three.
The location where an employee lives after retirement does not affect the already-computed annuity. Some employees, therefore, work in high-locality areas to maximize the high-3, then relocate to lower-cost areas. TSP contributions are also based on the higher basic pay, so higher locality pay can support larger retirement savings, though individual contribution rates and investment performance remain the primary drivers.
The locality pay system continues to evolve through Federal Salary Council recommendations and presidential decisions on annual adjustments. For 2026, the published rates and area definitions remain the operative figures for salary determination, benefit calculations, and retirement planning.
Outlook for 2027 Locality Pay
President Trump is expected to issue an Alternative Pay Plan for the 2027 pay rates before September 1. Presidents typically issue these plans late in the month.
Expectations for a 2027 civilian pay raise remain low. A few months ago, the administration released its FY 2027 budget proposal. It had no mention of a raise for federal civilian employees. The Office of Management and Budget later confirmed that the proposal effectively calls for no pay increase. By contrast, the budget does include a military pay raise, described as follows:
Pay Raise for the Troops. The Administration recognizes the importance of America’s warfighters and their families, so the Budget funds a military pay raise of seven percent for all DoD (Department of War) military personnel ranked E-5 and below, six percent for E-6 to O-3, and five percent for O-4 and above. This enduring investment, far above the standard annual military pay raise, builds on the President’s recruiting and retention success, by doubling down on the Administration’s goal to restore America’s fighting force.
This mirrors last year’s process. The FY 2026 budget proposal also omitted a civilian raise. The subsequent alternative pay plan provided a 1% across-the-board increase and no locality pay increase for most employees (with higher adjustments for certain law enforcement personnel).
A similar alternative pay plan is possible this year. If any civilian raise materializes—whether across-the-board only or with a locality component—it is likely to be relatively small. As of mid-August 2026, Congress has not advanced language that would override a low or zero civilian increase.
Federal employees in locality pay areas will continue to earn more than those in the Rest of U.S. schedule. The highest-paying locality areas are expected to remain at or near the top of the rankings.