
August 28, 2026 2:00 PM, EDT
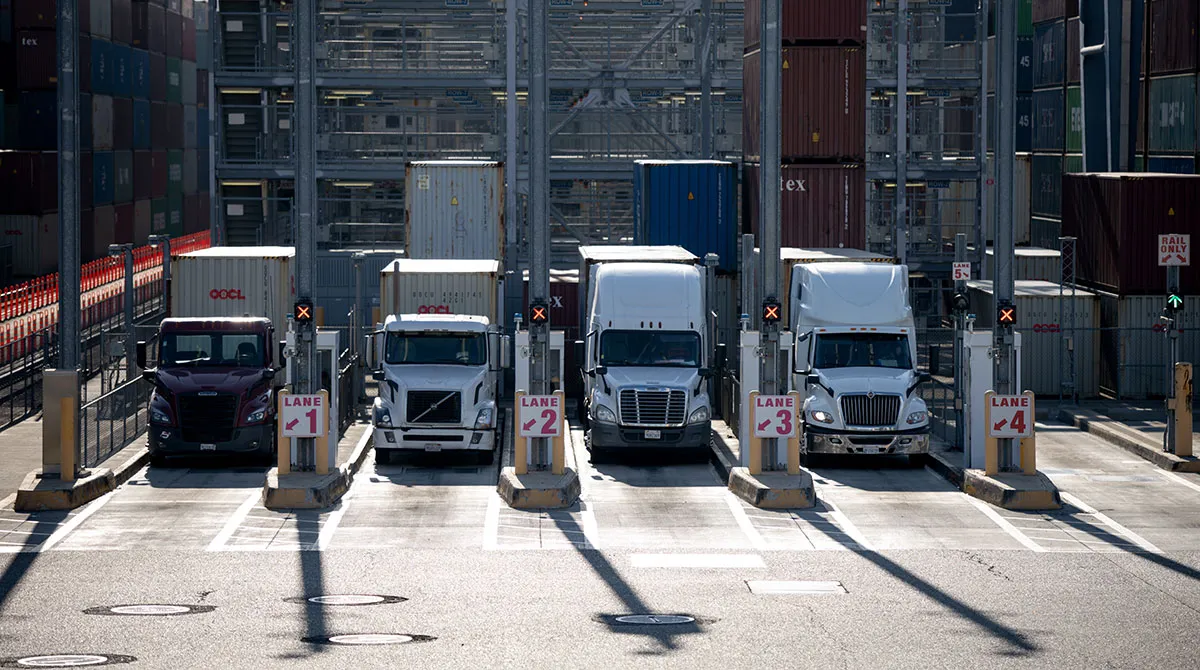
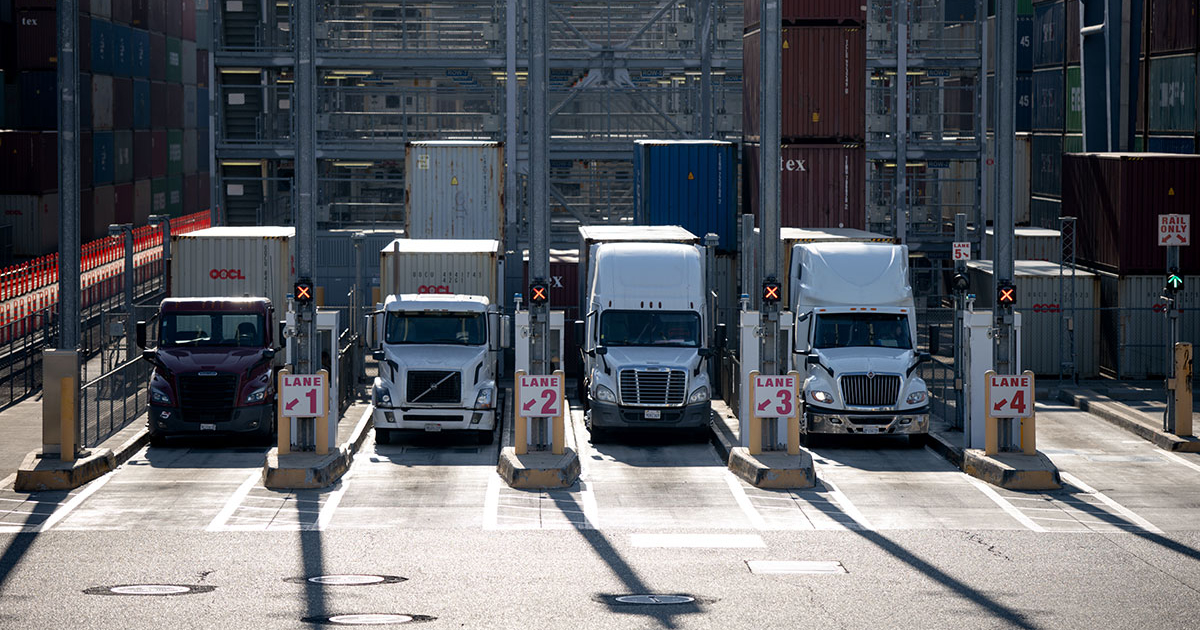
Tractor-trailers at the Port of Long Beach in California. Long Beach had its second-busiest July ever. (Eric Thayer/Bloomberg)
Key Takeaways:
Major U.S. container ports posted strong July volume despite year-over-year declines, with Los Angeles and Long Beach recording their second-busiest July on record.Analysts said healthy port activity contrasted with soft domestic freight demand as shrinking truck capacity, localized constraints and tariff-driven cargo shifts supported firmer pricing.Industry executives expect elevated activity through year-end and warned that sustained import growth could tighten drayage, chassis, warehouse and transload capacity.
Cargo shipments through the largest U.S. seaports exhibited signs of summertime strength amid uneven volume and tightening capacity, experts said.
“July was active around the major container ports,” said Cory Petersen, vice president of sales and operations at Circle Logistics. “We saw significant freight moving through the ports and pockets of tighter truck capacity — particularly around the larger import gateways — but it was not a situation where every trucking market across the country suddenly became tight.”
Port of Los Angeles container volume in July decreased 5.8% to 960,464 20-foot-equivalent units from 1,019,837 a year earlier. Despite the decline, the result was good enough for the facility’s second-busiest July on record.
The neighboring Port of Long Beach also announced its second-busiest July ever, even as volume declined 1.7% to 928,508 from 944,232 units.
“Those are extremely healthy absolute volumes, even though both ports were below last July’s unusually strong comparisons,” Petersen said. “From the trucking side, the more interesting dynamic is that these port volumes are occurring while overall domestic freight volumes remain relatively soft.”
Circle Logistics ranks No. 94 on the Transport Topics Top 100 list of the largest logistics companies in North America.
The Cass Freight Index showed July shipments down 4.8% year over year, while its truckload linehaul index increased 8.6%.
Descartes Systems Group in its monthly global shipping report said overall container import volume decreased 4.3% in July from the prior year to 2,508,310 units but rose 4.5% from the previous month. This sequential gain reflected typical seasonal growth, the company said, while noting that port transit delays increased across most major gateways. “July was largely consistent with what we experienced in the previous month,” IMC Logistics CEO Joel Henry said. “We are not seeing widespread congestion across the country, but several markets continue to face localized terminal, appointment and equipment constraints.”
Henry said market indications point to potentially elevated activity that could continue through the end of the year. That said, he’s keeping an eye on the Panama Canal draft restrictions, as this may prompt cargo routing changes between the East Coast and West Coast gateways.
IMC ranks No. 50 on the Transport Topics Top 100 list of the largest for-hire carriers in North America.

TT Top 100 Logistics Companies
The largest 3PLs in North America continued to face volatile business conditions last year, from compressed margins to tariff-driven supply chain upheaval. Read more
Data from third-party logistics provider Traffix showed July container imports rose 4.5% sequentially to 2.51 million TEUs on peak-season momentum. The company noted that while import volume is a leading indicator for drayage demand, shifts in cargo destinations also play a role. Recent data shows that while the West and East Coasts are absorbing the most weekly freight, the Gulf Coast is quietly taking more share.
“The ports and rails are stable but building pressure underneath,” said Matt Brachmann, director of port services at Traffix. “Conditions at the truck level were described as ‘relatively fluid,’ meaning drayage, chassis and transload capacity were flowing normally in July.”
Brachmann warned, however, that sustained import growth can quickly translate into tighter conditions for drayage capacity, chassis demand, warehouse space and transload availability. This is especially true when vessel arrivals become concentrated. Because of that, he views July as the calm before trucking gets squeezed.
“July’s fluid conditions are a planning window, not a steady state,” he said. “Early visibility, prearranged drayage and flexible transload are positioned as the buffer against the next squeeze.”
Traffix ranks No. 51 in the logistics TT100.
Petersen noted that pricing is firming largely because trucking capacity has contracted, not because freight demand is exploding across every market.
Shipping containers at the Port of Los Angeles. The port also had its second-busiest July in history. (Kyle Grillot/Bloomberg)
“The West Coast had the most noticeable peak-season feel, particularly Los Angeles and Long Beach,” he said. “A substantial amount of import freight was pulled forward earlier than the traditional peak season as importers tried to get inventory positioned ahead of changes in tariffs and other trade-related costs.”
Petersen noted this translated into stronger demand for drayage, transloading and outbound truck capacity around Southern California. But he pointed out that the pressure became much more lane-specific once freight left the port. He compared the results to the East and Gulf coasts, which he felt were more balanced by comparison, with activity still healthy, but with more variation by terminal, equipment pool and outbound market rather than broad congestion.
“The biggest long-term takeaway from July is that the traditional freight calendar continues to become less predictable,” Petersen said. “Today, tariffs, geopolitical events, inventory strategy and ocean transportation costs can move that freight forward by weeks or even months.”
Petersen warned that volatility is becoming normal and that the short bursts of port volume can tighten trucking capacity quickly even with a softer freight market.
Nationwide, other major seaports saw July results come in below year-ago levels.
The Northwest Seaport Alliance container volume dropped 4.2% to 239,220 TEUs from 249,578.
Port Houston container volume decreased 6% to 369,899 from 392,829.
Port of Oakland container volume fell 11.4% to 179,999 from 203,147.
South Carolina Ports Authority, as well as the Port Authority of New York and New Jersey, did not have their monthly volume numbers available at press time.