
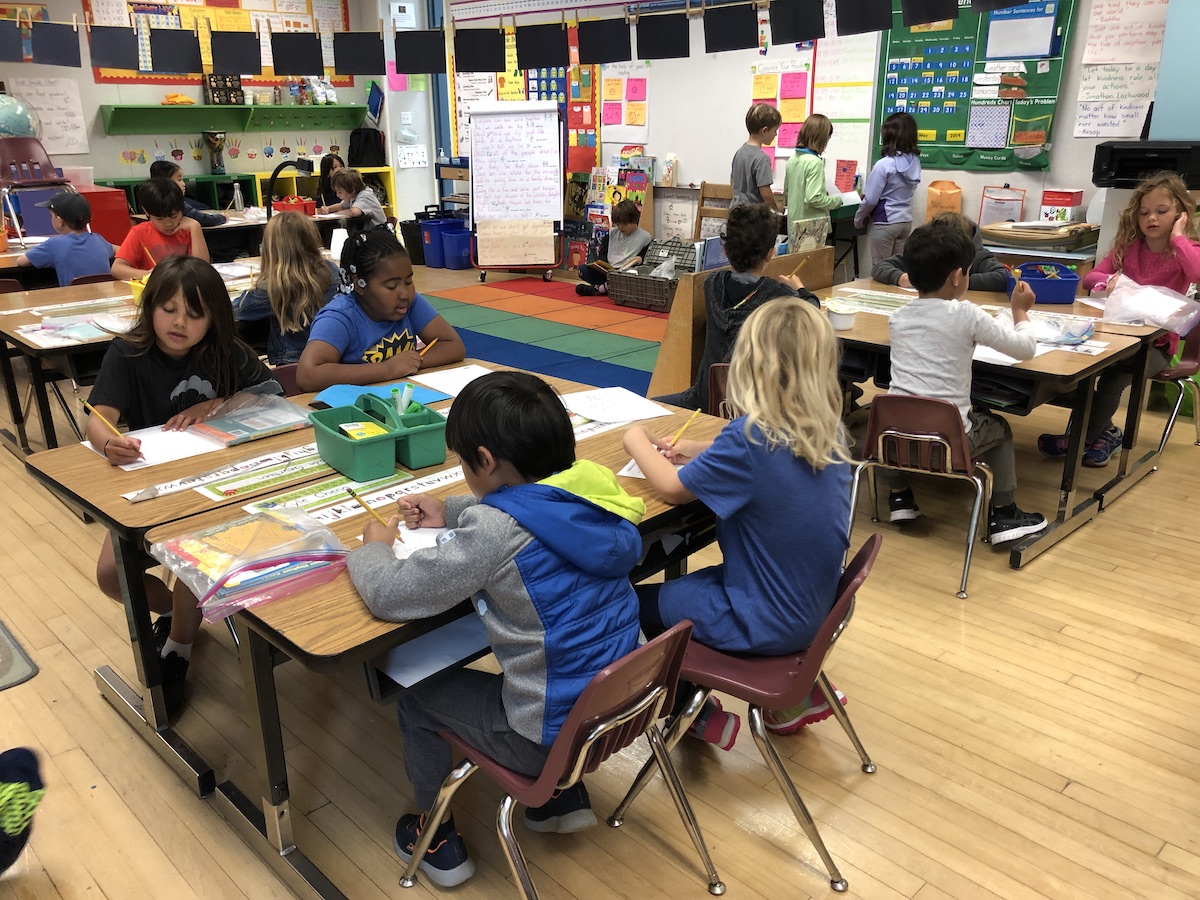
 Berkeley Arts Magnet students work on in-class assignments. Credit: Natalie Orenstein
The California School Dashboard results for 2025 are out, and for the first time since its creation nearly a decade ago, no Berkeley Unified student groups are in the red — the lowest academic performance level as measured by the state. Still, significant achievement gaps between student subgroups remain.
The dashboard, which debuted in 2017, tracks student progress in academics, attendance and graduation rates. But it also provides insight into the district’s suspension rates, English-learner progress, and family engagement. California’s dashboard uses a color scale to depict academic performance, with blue, green, yellow, orange and red in descending order.
According to this year’s dashboard results, the Berkeley Unified School District (BUSD) earned an overall score of blue in English language arts, math, and college and career readiness.
“It’s no small feat at all and a testament to the hard work and the commitment of our educators, the brilliance of our babies, and the work that we’ve done in partnership with our families,” BUSD Superintendent Enikia Ford Morthel said during a recent school board meeting.
The latest results come nearly two years after the release of an analysis of test scores from 2009 to 2016 found that Berkeley Unified had the second-largest gap in achievement scores nationwide, with English-learners, Black students, and socioeconomically disadvantaged youth scoring lower than their peers.
Those differences remain, but are less severe in some instances, according to the latest dashboard results.
Casey Robinson, a parent of two Berkeley High School students, represented the superintendent’s African American Success Advisory Committee at a school board meeting in early November and highlighted portions of the data. She noted that some of the “focal” student groups identified as priorities by the district have moved closer to grade-level expectations, including Black students at Rosa Parks and Sylvia Mendez elementary and in the middle schools, who achieved double-digit gains in literacy scores.
Black students also improved in English and math, moving from red to yellow. Latinx students moved from orange to green in math scores, compared to last year. And overall English proficiency among Latinx students improved, moving the group into the highest tier on the dashboard, up from yellow in the previous report.
Overall, BUSD student scores continue to outpace state averages in English, math and science, according to dashboard results.
BUSD attributed the improvements to its literacy specialists, intervention response teachers, and special education case managers who “provide targeted support for students who need it most.” But there are student groups that still require more attention.
Robinson reported that progress among students has been uneven. English language arts proficiency among Black students, she said, has “remained largely flat” and not grown at the rate of other student groups. Robinson also pointed out a notable drop in test participation by Black students in 3rd, 5th, and 11th grades. Low participation rates incur penalties on the California dashboard, potentially obscuring positive growth, staff said.
“These numbers raise important questions, and we know the best way to answer them is to listen,” said Robinson.
She said the advisory committee hosted a student and family forum in mid-November to hear from the BUSD community and understand why some scores and test participation rates declined. They plan to report back on what they learned during a school board meeting in December.
“*” indicates required fields