
In the last five years, the median household income rose 24% while monthly housing costs increased by 26% nationwide, according to ConsumerAffairs.
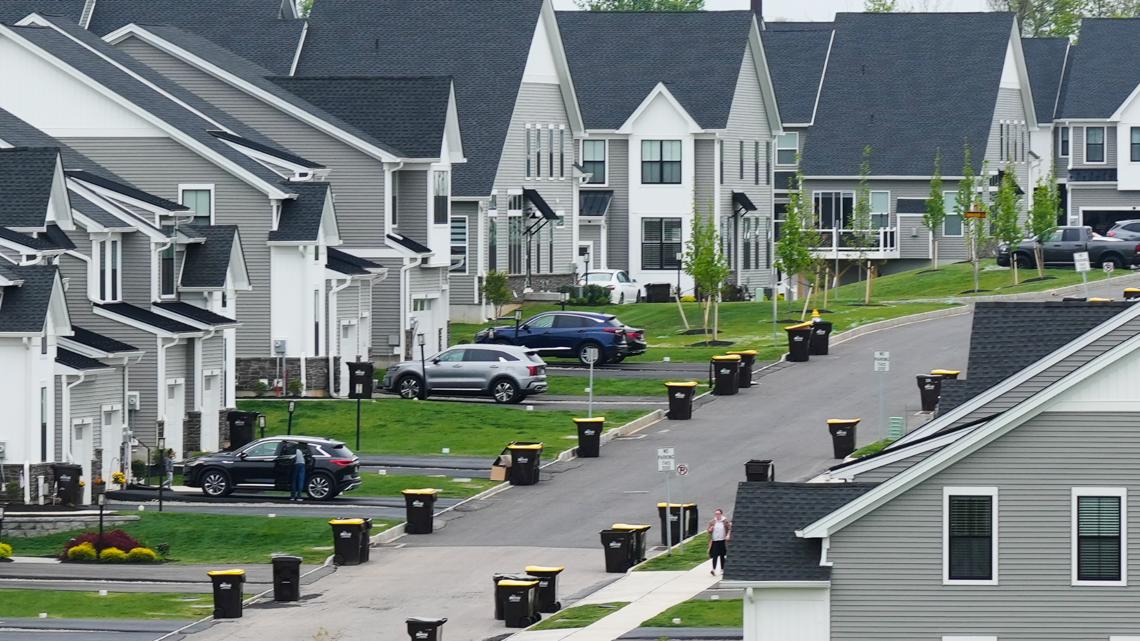
USA, — Financial experts encourage people to spend no more than 30% of their before-tax income on housing costs, but many Americans find themselves doing so to own a home.
This demographic is described as “house poor,” someone able to pay for a mortgage at the expense of other needs like groceries, healthcare, retirement or vacation, according to Chase Bank.
In the last five years, the median household income rose 24% while monthly housing costs increased by 26% nationwide, according to ConsumerAffairs.
A recent study by ConsumerAffairs ranked the top 10 cities with the most “house-poor” homeowners in the United States, based on 2024 Census data of cities with populations over 175,000.
Finance experts encourage people to follow the “50/30/20” rule — 50% for needs (including housing), 30% for wants, and 20% for savings and debt repayment — some experts suggest not spending more than 28% to 30% on housing. Nine of the top 10 cities on this list exceed 20% and all the top 10 exceed 28%.
So, which cities have the largest “house poor” population according to data? See the top 10 below.
1. Hialeah, Florida
The typical homeowner spends 36.9% of their income on housing costs in Hialeah, Florida. The city sits just outside Miami city limits.
The data report shows households make an average monthly income of just under $6,000, while rent is roughly $2,200 a month. Housing costs in Hialeah are more than 7% higher than the national average, and average monthly household income is roughly 34% below the national average.
From 2020 to 2024, average housing costs increased 45% while incomes increased 35%, according to the data.
2. New York, New York
Homeowners in New York, New York, spend roughly 33% of their income on housing costs.
While the average household income for New York City residents is nearly 19% higher than the national average, housing costs are 48% higher. The average cost of a home mortgage is $3,335 a month, while the average monthly income is $10,120.
In just one year, between April 2024 and 2025, housing costs in the city rose 9%, according to the report.
3. New Orleans, Louisiana
Homeowners in New Orleans, Louisiana, spend roughly 32.6% of their monthly income on housing costs.
The city is the only one in the top 10 to have a home value average lower than the national average, but it has housing costs worth 13.6% more than the national average.
Housing costs an average of $2,332 a month while households average a $7,154 per month. From 2023 to 2024, housing costs rose 2.1% while income increased more than 7%.
4. Los Angeles, California
Homeowners in Los Angeles, California, spend 32.5% of their income on housing.
The median monthly mortgage costs $3,523 a month, while households average $10,855 in income a month. It’s the ninth most expensive mortgage average on the list.
Property taxes increase the cost of housing and, in 2024, were 93% higher than the national median, the report says.
5. Miami, Florida
Hialeah’s neighbor, Miami, Florida, made the top 10 because homeowners spend an average of 32.3% of their income on mortgages.
Miamians earn 6.5% more than the national median household income, but spend an average of $2,900 on housing, which is 35% higher than the national average.
The report says Miami households need to earn “$176,438 a year to afford the typical monthly home payments.”
6. Pembroke Pines, Florida
Pembroke Pines is a suburb in Florida and has roughly 24,607 households with a mortgage. It’s the lowest populated city on the top ten list, but they spend 32% on monthly housing costs.
The average Pembroke Pines household makes $8,598 but spends $2,751 on their mortgage.
Between 2023 and 2024, housing costs rose 11% while household incomes decreased 2%.
7. St. Petersburg, Florida
Another Florida city to rank in the top 10 is St. Petersburg, with homeowners spending 30.6% on monthly housing-related costs.
The city has a typical household income 10% below the national average, but housing costs are 13.2% higher, according to the report.
The average household makes $7,598 and spends $2,322 on housing per month.
8. Honolulu, Hawaii
Off the mainland of the United States, Honolulu, Hawaii, takes eighth place with 30.5% of monthly income going to housing.
The average household makes $9,995 a month and spends $3,045 on housing.
Home values on the island are 136% higher than the national median. Honolulu has the lowest property tax rate in the country with 0.28%.
9. Yonkers, New York
Yonkers, New York, just north of the Bronx and alongside the Hudson River, has a monthly income 22% higher than the national average, but homeowners spend 30.2% of their income on housing.
The monthly household income averages out to $10,494, while housing costs average to $3,170 a month. Housing costs in Yonkers are 44% higher than the rest of the U.S., according to the report.
The city has some of the highest property tax rates in the country, alongside three California cities.
10. Chula Vista, California
Chula Vista, California is part of the San Diego metro area near the Mexico-U.S. border. Homeowners in the city spend 29.5% of their monthly income on housing, according to the report.
Households average a monthly income of $10,630, but spend an average of $3,132 on monthly housing costs.
The housing cost burden in Southern California, and more specifically the San Diego metro area, extends well beyond homeowners. The average household would need to spend 67% of its monthly income to meet a mortgage payment on existing homes, according to the report.
How to avoid being “house poor”
Account for additional fees beyond a mortgage, like property taxes, HOA fees, maintenance costs, etc. Shop around for mortgage ratesTry and abide by the “50/30/20” rule when you canDon’t take out loans beyond your means, if possible