
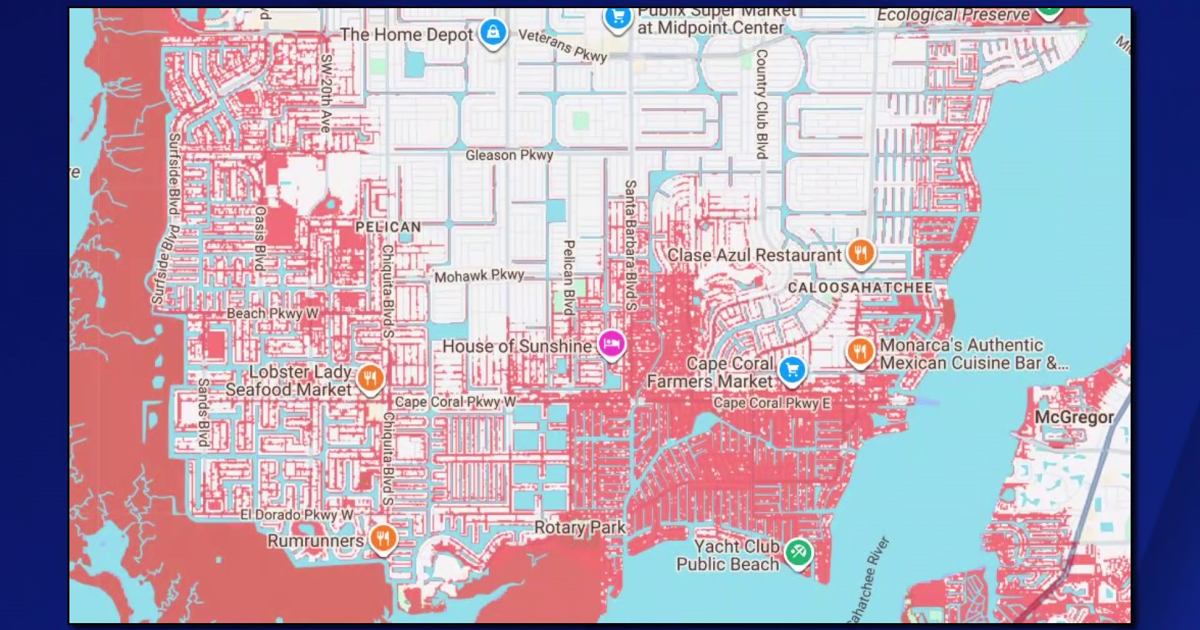
Florida’s future might be underwater, but how much and how soon is still a question. A map by Climate Central, a nonprofit organization of scientists and journalists, suggests that many coastal areas could be submerged by 2150. The map highlights regions in red that are projected to fall below annual flood levels.
Cape Coral residents had varied reactions to the map.
“It’s very sad. It’s, it’s like, I don’t know, it just feels wrong. It feels wrong,” said Deb Chang, a resident of Cape Coral.
Don, also from Cape Coral, shared a different perspective.
“Yeah, but what could happen in 100 years? Houses might be floating houses, or, you know, we’ll be flying around in cars. I mean, the water won’t be nothing!” said Don and Rosie.
Another local said she hopes projections change in time.
“I’m scared. It’s really weird. It’s weird to think about,” said Trinity Garner, a Cape Coral resident. It’s weird to think about that it’s not gonna be here when I’m gone…. Hopefully it will, I don’t know, maybe something will change?”
Climate Central’s sea level rise and coastal flood maps are based on information published in peer-reviewed science journals. It also uses data from NOAA. As these maps incorporate big datasets, which always include some error, Climate Central warns that these maps should be used as “screening tools to identify places that may require deeper investigation of risk.”
Joseph van Gaalen, a professor of geology and earth science at Florida SouthWestern State College, also warned about the complexity of the data shown on Climate Central’s map.
“You’re talking about hundreds of scientists who are contributing in one way or another, and that’s an awful lot of information to absorb,” said van Gaalen. “This is their best try. You know, the good old school try to get this going and make it sort of digestible.”
But projecting rising sea levels is a complicated task.
“Sea level has been rising for quite some time, not as rapidly as 10,000 years ago, but more rapidly than 100 years ago, there’s variability in that,” said van Gaalen.
He gave an example of how evolving infrastructure can impact projections, too.
“If we look at, you know, from a broad perspective, Manhattan should have been underwater a while ago, but the evolution of the buildings and stuff like that makes things different over time, too,” said van Gaalen.
Depending on where you’re at in the United States, van Gaalen explained, sea level is rising anywhere from a couple of millimeters a year to seven or eight. Currently, Florida’s sea level is rising at an average of four millimeters a year.
“The thing to do is to not look at a map like this and say, ‘Oh, well, I’ve got 100 years.’ The thing to do is to think about, ‘okay, well, if this goes up a little bit in 10 years, what does that mean for (another) Hurricane Ian in 10 years?'” said van Gaalen.
If you’re interested in exploring the Climate Central map, click here.