
Home » AIRLINE NEWS » More Than 181 Flight Cancellations and 3,860 Delays Hit US as Spirit, Horizon, United, Alaska, Hawaiian, JetBlue, and Other Airlines Face Severe Travel Chaos Across Fort Lauderdale, Orlando, Newark, New York, LaGuardia, Honolulu, and Beyond
Published on
February 9, 2026

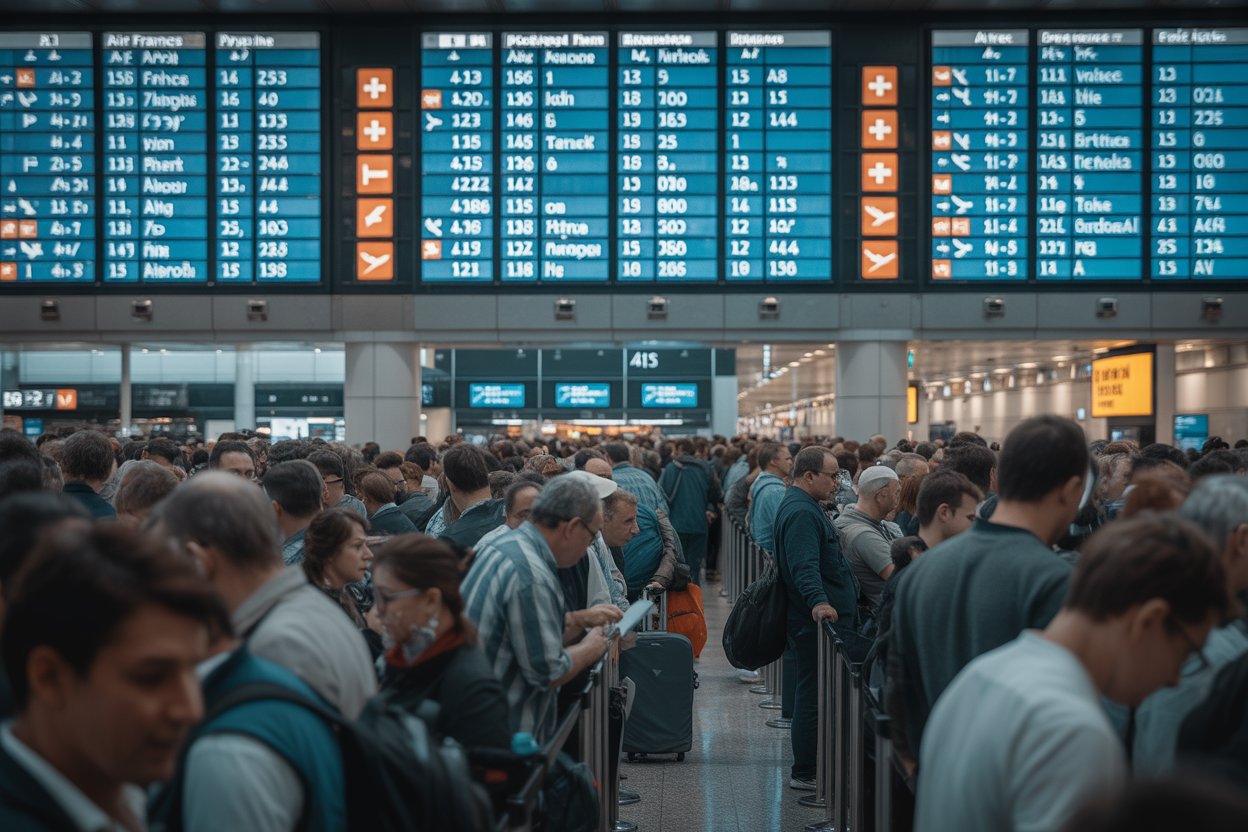
In 2026, over 181 flight cancellations and 3,860 delays have disrupted U.S. air travel, as Spirit, Horizon, United, Alaska, Hawaiian, JetBlue, and other airlines face severe travel chaos. This widespread disruption has affected major airports, including Fort Lauderdale, Orlando, Newark, New York, LaGuardia, Honolulu, and beyond. Various factors, such as operational inefficiencies, weather conditions, and staffing challenges, have contributed to the mounting delays and cancellations. Airlines like Spirit and JetBlue, for instance, have experienced significant operational hurdles, leading to a higher number of delays and cancellations. These disruptions highlight the complex nature of air travel logistics, with airports across the country facing unique challenges in managing both cancellations and delays.
US Airline Data – Performance Review
The first table presents an overview of U.S. airline performance, specifically focusing on cancellations and delays. Spirit Airlines led with 56 cancellations, which made up 10% of its operations. However, JetBlue experienced the highest percentage of delays, with 28% of flights delayed and a total of 233 delayed flights. On the other hand, airlines like American Airlines and Southwest had relatively low cancellation rates, but their delayed flights were still notable. This data showcases how various airlines face different challenges related to operational efficiency, external conditions like weather, and other logistical factors.AirlineCancelled (#)Cancelled (%)Delayed (#)Delayed (%)Spirit5610%12323%Cape Air174%266%United120%31211%Alaska Airlines121%8210%Hawaiian Airlines114%7130%JetBlue101%23328%SkyWest90%27112%American Airlines60%59318%Southwest40%2888%Horizon (ASA)31%4014%Delta Air Lines20%2699%Republic20%17717%Endeavor Air (DAL)20%9314%PSA Airlines (AAL)10%22233%Breeze Airways10%4818%
US Flight Cancellation by Origin – Departure Performance
The second table provides insight into flight cancellations based on departure airports in the U.S. Orlando International Airport (MCO) saw 10 cancellations, representing 1% of its flights, while Fort Lauderdale International (FLL) had a higher cancellation rate of 2% with 11 cancellations. Other major airports, like Newark Liberty International (EWR) and LaGuardia Airport (LGA), experienced 1% cancellation rates, but also saw significant delays, especially at JFK with 122 delayed flights and a 18% delay rate. The data highlights how airport-specific factors such as operations, staffing, and weather conditions impact the reliability of flight schedules across the country.AirportCancelled (#)Cancelled (%)Delayed (#)Delayed (%)Orlando Intl (MCO)101%12420%Fort Lauderdale Intl (FLL)101%9817%Boston Logan Intl (BOS)91%8415%Newark Liberty Intl (EWR)81%8115%LaGuardia (LGA)81%8116%Luis Munoz Marin Intl (SJU)72%4214%Houston Bush Int’ctl (IAH)60%6810%Daniel K Inouye Intl (HNL)51%5318%Lihue (LIH)59%815%Chicago O’Hare Intl (ORD)40%19016%Detroit Metro Wayne Co (DTW)41%5815%San Diego Intl (SAN)41%3712%John F Kennedy Intl (JFK)30%14722%Philadelphia Intl (PHL)30%6817%Indianapolis Intl (IND)31%114
US Flight Cancellation by Destination – Arrival Challenges
The third table highlights the cancellations at U.S. airports based on destinations. John F. Kennedy International (JFK) faced 7 cancellations and 122 delayed flights, resulting in a 1% cancellation rate and high delays at 18%. Similarly, Los Angeles International (LAX) experienced 2 cancellations but had a higher volume of delays, with 117 delayed flights and a 15% delay rate. Phoenix Sky Harbor International (PHX) had a 7% delay rate with 50 delayed flights, but the 2 cancellations represent a 0% cancellation rate. These operational patterns show the complexities of managing air traffic and passenger flow at high-volume airports, which are susceptible to both cancellations and delays due to various factors such as weather, congestion, and staffing.
Advertisement
Advertisement
AirportCancelled (#)Cancelled (%)Delayed (#)Delayed (%)Miami Intl (MIA)20%9611%San Francisco Int’l (SFO)20%8013%Denver Intl (DEN)20%606%Harry Reid Intl (LAS)20%597%Washington Dulles Intl (IAD)20%409%Nashville Intl (BNA)30%247%Reagan National (DCA)20%12829%Charlotte/Douglas Intl (CLT)20%9513%Phoenix Sky Harbor Intl (PHX)20%507%Raleigh-Durham Intl (RDU)20%3713%
Over 181 flight cancellations and 3,860 delays have hit U.S. travel, with Spirit, Horizon, United, Alaska, Hawaiian, JetBlue, and others facing chaos. Major airports like Fort Lauderdale, Orlando, Newark, and LaGuardia were impacted by weather, staffing, and operations.
In conclusion, the U.S. experienced severe travel chaos in 2026, with over 181 flight cancellations and 3,860 delays disrupting air travel. Airlines such as Spirit, Horizon, United, Alaska, Hawaiian, JetBlue, and others were at the forefront of these disruptions. Major airports like Fort Lauderdale, Orlando, Newark, New York, LaGuardia, Honolulu, and beyond were significantly impacted. The travel chaos stemmed from a combination of operational inefficiencies, weather-related issues, and staffing challenges, all of which contributed to the widespread delays and cancellations. This situation underscores the complex nature of managing air travel and the need for improved operational strategies to prevent such disruptions in the future.
Advertisement
Advertisement
Advertisement
Advertisement
Advertisement