
Southwest Florida’s luxury housing market is diverging from the national slowdown, even as the rest of the country reveals a split personality between high-velocity growth pockets and price-correction markets, according to Realtor.com’s October Luxury Housing Market Report.
In the Cape Coral–Fort Myers and Naples–Marco Island metropolitan areas, the trendlines are moving in different directions. Cape Coral–Fort Myers posted one of the steepest luxury price drops in the nation, with the entry point for the top 10% of listings falling 7.8% year over year to about $1.06 million. Days on market ticked up slightly, indicating a market still digesting elevated prices and shifting seller expectations.
Just 45 miles south, however, Naples–Marco Island remains among the country’s most expensive luxury markets despite a mild price dip. Luxury listings there now begin at roughly $3.44 million, a 2.1% decrease from last year. Naples’ ultra-affluent segment continues to outpace national levels, ranking seventh in the nation by price threshold and averaging nearly 2,000 million-dollar listings over the past year, evidence of sustained demand from high-net-worth buyers who see Collier County as a long-term investment rather than a speculative play.
The contrast between the two metros mirrors what Realtor.com Chief Economist Danielle Hale described as a national market defined by “a more dynamic, city-by-city story.” Nationally, the luxury benchmark — the 90th percentile of listing prices — slipped 2.2% year over year to $1.22 million. But underlying that cooling trend is a sharp divide between markets where prices are accelerating and homes are selling faster, and others where price corrections are reigniting demand.
“The national average for luxury pricing is overshadowing a more dynamic, city-by-city story,” Hale said. “In markets where prices are accelerating and homes are selling faster, buyers are clearly competing. But the most compelling trend this month is the effective price correction in other high-end metros.”


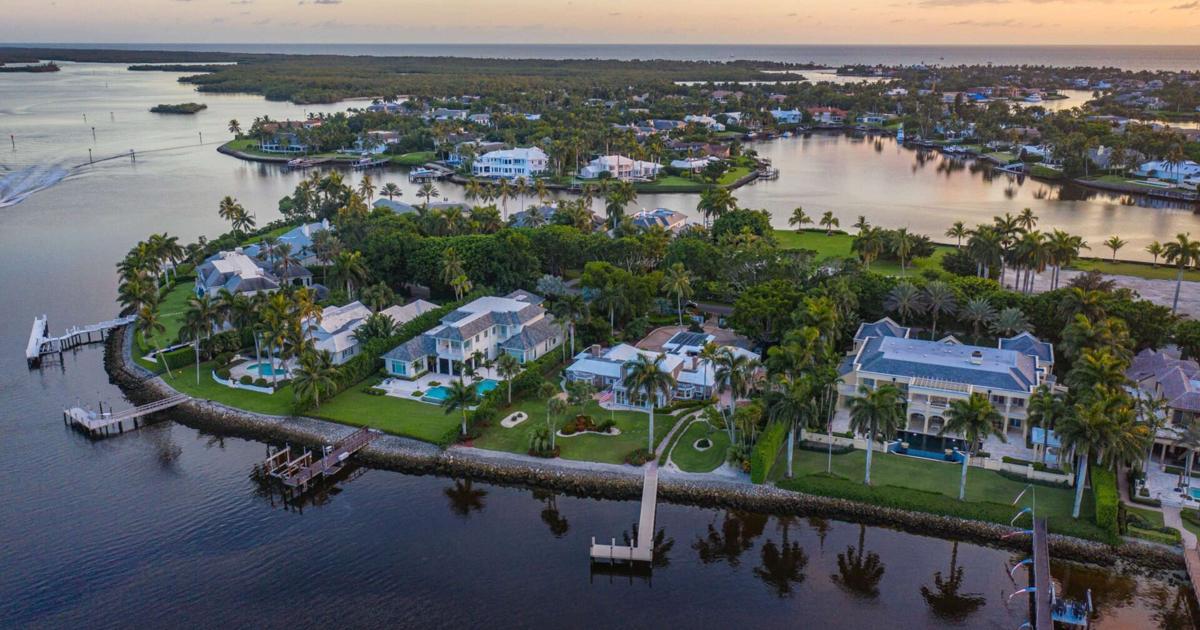
A Gulf-front Port Royal estate features a resort-style pool and shaded outdoor living spaces overlooking the turquoise waters of the Gulf.
Provided
North Port–Bradenton–Sarasota, just north of Fort Myers, led the country in luxury price growth, surging nearly 20% year over year to $1.67 million. The region continues to attract affluent buyers seeking newer construction, coastal access and comparatively lower prices than Naples.
Three metros — Heber, Utah; Boise City, Idaho; and Minneapolis — stood out as true “high-velocity” markets, with luxury prices rising while homes sold faster. “These are the nation’s true high-velocity markets right now,” Realtor.com senior economist Anthony Smith said. “When prices rise year-over-year while homes are simultaneously selling faster, it means buyers are not just willing to meet the price — they are competing for limited inventory.”
Elsewhere, price corrections are resetting expectations and accelerating sales. Bridgeport–Stamford–Danbury, Connecticut, saw luxury prices drop 7.5% while days on market plunged 42.5%. Charleston, South Carolina, and Atlantic City, New Jersey, posted similar declines. At the extreme, Kahului–Wailuku, Hawaii, recorded the sharpest decline in the nation, nearly 20%, pulling its luxury threshold down to $3.79 million.
Even with price softening at the national level, the ultra-luxury tier, the top 1% of listings, showed slight stabilization, rising 1% month over month to $5.41 million.
The diverging paths of Cape Coral–Fort Myers, Naples–Marco Island,and North Port underline a broader regional reality. High-end demand remains strong, but the definition of luxury — and its pace — varies sharply from one coastal market to the next.
Luxury Metros with the Largest Price Declines (year over year)
Rank
Area
10% Most
Expensive
Listings Start at:
Price for top 10%
Listings YoY
Median Days on Market
top 10% YoY
USA
$1,224,164
-2.2 %
4.0 %
1
Kahului-Wailuku, Hawaii
$3,791,000
-19.9 %
-4.3 %
2
Charleston-North Charleston, S.C.
$1,994,500
-13.1 %
-13.9 %
3
Atlantic City-Hammonton, N.J.
$2,324,950
-13.0 %
-20.6 %
4
Austin-Round Rock-San Marcos, Texas
$1,332,650
-11.0 %
-5.2 %
5
Port St. Lucie, Fla.
$1,011,473
-9.0 %
21.4 %
6
Cape Coral-Fort Myers, Fla.
$1,057,360
-7.8 %
3.7 %
7
New York-Newark-Jersey City, N.Y.-N.J.
$3,017,194
-7.7 %
-8.9 %
8
Bridgeport-Stamford-Danbury, Conn.
$4,249,600
-7.5 %
-42.5 %
9
Oxnard-Thousand Oaks-Ventura, Calif.
$2,999,999
-6.5 %
15.9 %
10
Los Angeles-Long Beach-Anaheim, Calif.
$3,996,297
-6.3 %
4.0 %
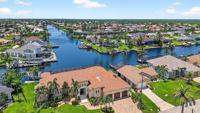
A waterfront neighborhood in Cape Coral features canal-front homes with private docks, a hallmark of the city’s luxury real estate market.
Sotheby’s International Realty
Top 10 Luxury Markets by 90th Percentile Listing Price
Rank
Area
Metro/Micro
10% Most
Expensive
Listings Start
at:
10% Most
Expensive YoY
Average
Annual Million-
Dollar Listing
Count
Multiple to
Median Listing
Price
1
Heber, Utah
Micro
$6,500,000
8.4 %
928
4.5
2
Key West-Key Largo, Fla.
Micro
$4,824,500
1.7 %
718
3.8
3
Bridgeport-Stamford-Danbury, Conn.
Metro
$4,249,600
-7.5 %
614
5.3
4
Los Angeles-Long Beach-Anaheim, Calif.
Metro
$3,996,297
-6.3 %
9,795
3.6
5
Kahului-Wailuku, Hawaii
Metro
$3,791,000
-19.9 %
677
3.4
6
San Jose-Sunnyvale-Santa Clara, Calif.
Metro
$3,750,400
-6.2 %
1,095
2.7
7
Naples-Marco Island, Fla.
Metro
$3,443,693
-2.1 %
1,946
4.9
8
New York-Newark-Jersey City, N.Y.-N.J.
Metro
$3,017,194
-7.7 %
12,310
4.0
9
Oxnard-Thousand Oaks-Ventura, Calif.
Metro
$2,999,999
-6.5 %
697
3.0
10
San Diego-Chula Vista-Carlsbad, Calif.
Metro
$2,894,369
-2.8 %
2,336
3.1