

Executive Summary
Using a methodology aligned with the congressional budget window, this report estimates the fiscal, economic, and population effects of immigrants by age, education, and category of admission. It updates previous Manhattan Institute research by incorporating more recent census data, more precise life-expectancy and fertility adjustments, economic and capital stock growth, and the fiscal effects of the descendants of immigrants. This report estimates fiscal impact in nominal dollars over a 10- and 30-year horizon. This report also updates and fixes several assumptions from previous research on the fiscal impact of immigrants, including the calculation method for interest on the debt and correctly adjusting tax credits for inflation. It uses an updated method for accounting for public-goods spending.
Overall, the average new immigrant reduces the federal budget deficit and expands the economy, but this is not true of all categories of immigrants. Immigrants without college degrees receive more government benefits than they pay in taxes, even when we consider only their preretirement years. By contrast, immigrants who finished college or obtained an advanced degree contribute millions of dollars more in federal taxes than they receive in government benefits, and they save substantial amounts of interest on the debt while growing the economy.
The Manhattan Institute immigration reform proposal described in this report—combining low-skilled immigration reductions with high-skilled expansions and market-based visa allocations—offers a blueprint for a conservative immigration reform that prioritizes merit and protects public finances, with the additional benefits of reducing crime and bringing about more assimilated immigrants. This report includes dozens of specific immigration proposals and proposed legislation, and it allows Congress to accurately produce a budget score in the 10- and 30-year budget window of any immigration legislation.
Key Findings
Education and age drive immigrant fiscal impact. Immigrants with bachelor’s or graduate degrees, particularly those who arrive before age 40, produce large fiscal surpluses over 10- and 30-year windows.
Low-skilled immigration is costly in both the short and long term. Immigrants with just a high school diploma or no high school education, along with their descendants, tend to receive more in benefits than they pay in taxes.
Legal status matters. From the perspective of the fiscal impact, employment-based immigrants are the most positive legal category, and parents of U.S. citizens are the most negative. The average legal immigrant will reduce the budget deficit and grow the economy, while the average unlawful immigrant will expand the national debt and grow the economy but to a lesser extent.
Targeted reforms can yield major fiscal gains. Shifting visas toward high-skilled categories, wage-ranking H-1B visas, and recapturing unused employment-based green cards from previous years can reduce deficits while boosting GDP.
Comprehensive high-skilled immigration reform can stabilize debt. The Manhattan Institute plan in this report would increase GDP by 4.6% and reduce federal debt by nearly $20 trillion over 30 years without expanding the immigrant share of the population, stabilizing the federal debt as a share of the economy over the long run.
Introduction
In the world’s richest democracies, where immigrants represent a record share of the population and an aging population is straining national budgets with larger pension obligations, there is a long-running debate over the impact of immigrants on government finances. Proponents of immigration often argue that immigrants are necessary to rescue pension programs like Social Security because they contribute through payroll taxes. Critics of immigration contend that most immigrants—especially those with less education, those from poor nations, or those who enter unlawfully—consume more government benefits than they pay in taxes, thus straining government budgets even further.
In September 2024, I published a report, “The Lifetime Fiscal Impact of Immigrants,” in which I found that, over the course of their entire lives, immigrants in the U.S. tend to contribute slightly more in taxes than they receive in benefits from the federal government. That report updated a comprehensive National Academy of Sciences (NAS) study,[1] which pioneered a new fiscal impact calculation by estimating the lifetime net fiscal impacts of immigrants differentiated by education level and age. In my previous report, I found that immigrants without college degrees and those of all education levels who come to the U.S. after their mid-fifties are net fiscal burdens. In this new report, I adapt my methodology to make it comparable with the 10- and 30-year scoring of the Congressional Budget Office (CBO), making the findings directly applicable to the fiscal scoring system of federal legislation. Then I update some of the report’s assumptions to address the main criticisms of my previous report.
The primary goal of this study is to provide policymakers with a reliable estimate of how various immigration policy changes will affect federal tax revenue and spending. The U.S. immigrant population—past, present, and future—is different from that of other rich democracies, as is U.S. fiscal and labor-market policy. The estimates here should not be extrapolated to other countries, especially European nations that have much more fiscally negative immigrant populations.
While both the NAS and 2024 MI reports considered the entire lifetime of immigrants to measure their fiscal impact, this updated CBO-like MI report considers only the next 10 and 30 years, since these are the legislative fiscal windows considered by Congress. Unlike earlier literature, this report deals only with nominal dollars, not real or time-discounted ones. Thus, the interpretation of the results of this study should be adjusted to understand that they represent the expected impact on the nominal federal budget, regardless of time or inflation considerations. This is similar to how the impact of tax and spending legislation is measured by CBO. Additionally, since only the next three decades are accounted for, most of the future tax payments by young immigrants are not taken into consideration; the entitlement benefits received by middle-aged immigrants are likewise disregarded.
Unlike the previous MI report, this updated version accounts for the economic impact of immigrants on Gross Domestic Product, the capital stock, and the resulting additional tax revenue. It also accounts for the fiscal and economic impact of the children and grandchildren of immigrants, similar to the NAS study but with more recent and accurate fertility projections. I estimate how the resulting change in debt and economic growth affects the key metric of debt as a share of GDP.
This report is organized into five parts. Part 1 explains the methodology, lists assumptions, and summarizes differences in methods and assumptions among various studies. Part 2 illustrates the role of age and education in the fiscal impact of immigrants. Part 3 shows the detailed immigrant fiscal impact estimates, by age at arrival and educational attainment. Part 4 uses those estimates to project the economic impacts of various immigration policy changes. Part 5 describes my immigration reform proposal and compares it with other major comprehensive reforms proposed by members of Congress and other think tanks.
I would like to acknowledge and thank Liam Gaspar, whose work was key in compiling sources, organizing data, and reviewing the text of this report. All errors and omissions are mine.
Part 1: Methodology
CBO-Like Methodology
This study evaluates the impact on tax revenue and spending of new immigrants over the next 30 years. Specifically, it focuses on the cumulative fiscal impact by the 10th and 30th year because these are the two years that Congress directed the Congressional Budget Office to focus on when rating budget legislation. There are many drawbacks to analyzing immigration over this short period, especially because immigration policy decides who lives in the country and who will be born into it. Nevertheless, this timeline is the one that Congress reviews and thus is most useful to public policy proposals.
In contrast to the previous MI report, I do not adjust figures for inflation, nor do I discount future real dollars for the time-value of money.[2]
Unit of Analysis: The Individual Immigrant and Descendants
The first methodological choice is whether to analyze the tax payments and benefits received by immigrants as households or as individuals. This report treats immigrants as individuals in order to avoid treating households of married native-born and immigrant residents as half-immigrant and half-native. Unlike the previous MI report, this one considers the tax payments and benefit use of the children and grandchildren of immigrants as part of the fiscal impact of immigrants themselves, while still treating them as individuals and not households.
The economic literature is divided on this matter, partly because the U.S. tax unit is households, not individuals. When someone files taxes, one pays as a single, married, or head-of-household filer, and the incomes of all members of the household are combined on the tax return. This makes the household a reasonable unit of analysis but does not resolve how to treat mixed households of native-born and immigrant individuals—specifically, married couples in which one spouse is foreign-born and the other is native-born.
The greatest advantage of choosing individuals as the unit of analysis is that households suffer compositional changes over time that individuals do not suffer. Children are born and then leave the household, older family members are cared for and die, and couples join and sometimes separate. The main estimate for this report is the lifetime fiscal impact of an immigrant. Therefore, it makes more intuitive sense to treat immigrants as individuals rather than to combine them with their potentially native-born spouses or children.
This report uses the allocation of household tax payments to individuals computed by the Current Population Survey (CPS).[3]
Time Period
This updated report uses more recent CPS and American Community Survey (ACS)[4] data. The CPS data, which are the source for nearly all individual tax and spending indicators, are taken from the 2023 and 2024 CPS samples. The 2023 sample is included to enlarge the sample size and thus increase its accuracy. The ACS samples used are the 2022 and 2023 samples; the 2024 sample is unpublished at the time of this writing. The ACS was used only to measure institutionalization: whether immigrants and their descendants are in prison or in a nursing home.
Since the CPS samples used in this report are entirely preceding the passage of the Tax Cuts and Jobs Act of 2017, the tax and spending numbers used here assume the extension of present tax rates into the future, which was recodified into law by Congress in the 2025 “Big Beautiful Bill.” Unlike the older NAS study, this model accounts for the passage of new benefit programs like the Affordable Care Act (ACA) subsidies and Medicare Part D, which altered immigrants’ fiscal impact significantly.
Future projections used in this analysis are not of the lifetime of the immigrant (potentially a century) but the next 30 years, specifically the 2025–54 period for which CBO reported economic and budgetary projections when this report was first written. The advantage of limiting the analysis period is increased certainty in economic growth and budget assumptions. The drawback is underestimating the future contribution of young immigrants during their peak earning years and overestimating those of middle-aged immigrants by excluding their retirement.
Inflation and Time
While no inflation or time discounting is done for future figures, the 2023 and 2024 dollars in the CPS sample are adjusted to January 2025 dollars. This is the report’s only inflation adjustment, and all figures should be interpreted as nominal dollars beginning in 2025.
Categories of Immigrants
Similar to the previous MI study, this one categorizes immigrants into a total of 35 groups—five education levels and seven age groupings. Immigrants are classified by the age at which they report first coming to the U.S. as follows:
Under 18 years old (10 years old)
18 to 24 years old (20 years old)
25 to 34 years old (30 years old)
35 to 44 years old (40 years old)
45 to 54 years old (50 years old)
55 to 64 years old (60 years old)
Over 65 years old (70 years old)
In the previous study, I assumed that the average age at migration of each subgroup was the start of the measurement, leading to irregular ages at migration by education level. For simplicity and clarity in this study, I will assume that the actual ages at migration of these groups are those in parentheses. Therefore, we will evaluate immigrants in 10-year intervals.
The classification of each age group by education is by education at the time they first immigrated to the U.S., in five groups:
Less than high school
High school diploma
Some college (an associate’s degree or an incomplete bachelor’s)
Bachelor’s degree
Advanced degrees (master’s, PhDs, and professional degrees)
Life Expectancy
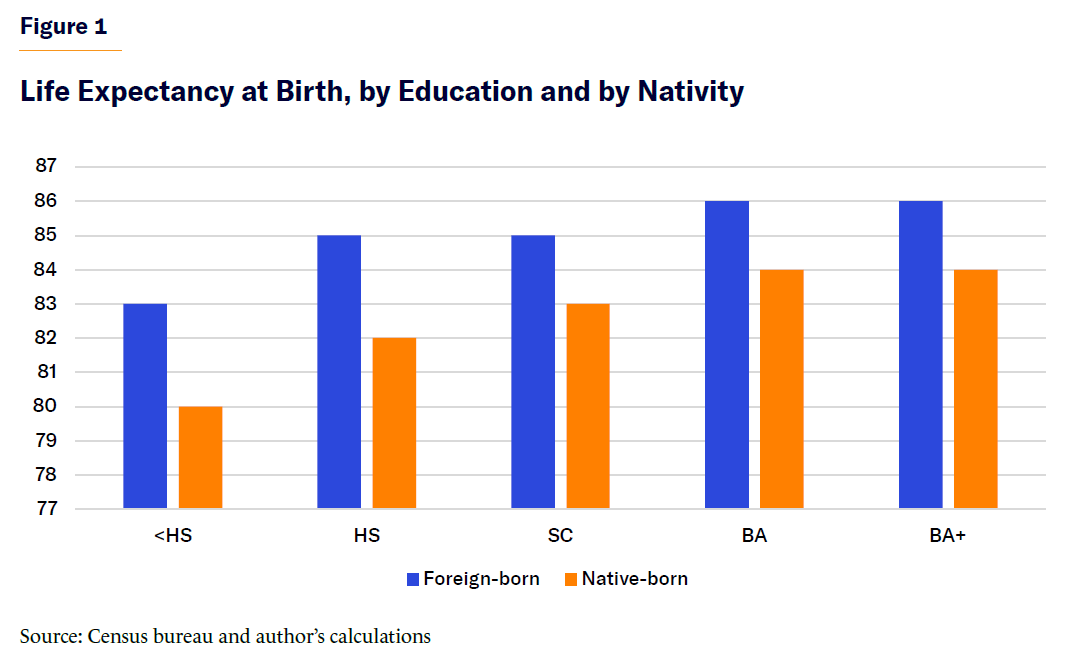
Life expectancy is treated similarly to the first MI study, which is an improvement over the NAS study because it adjusted for higher life expectancy among immigrants than natives. This updated MI study further improves the accuracy of the fiscal impact estimates by adjusting life expectancy among immigrants by education, too. The first MI study assumed that immigrants lived longer than native-born Americans, but it is more accurate to evaluate mortality by education, too; high school dropouts, on average, live shorter lives than those with college degrees.
I adjust life expectancy by education among immigrants based on the overall differences of the U.S. population. Critics might worry that this overestimates differences in life expectancy by education among immigrants, but the overall life expectancy of all immigrants is already adjusted upward, and acknowledging differences in life expectancy by education is a positive step toward accuracy, even if it overcompensates. Furthermore, the differences are not large enough over the 10- and 30-year budget windows to make much difference in fiscal impact for any group but the elderly. The new estimates use more data and are likely to be more accurate than the average immigrant life-expectancy adjustment in the first MI study.[5]
Figure 1 shows the life expectancy at birth of immigrants and natives of various educational levels to illustrate the point.
Emigration
I maintain the same emigration assumption of the NAS study, with the probabilities of emigration by the time since arrival noted in Table 1:
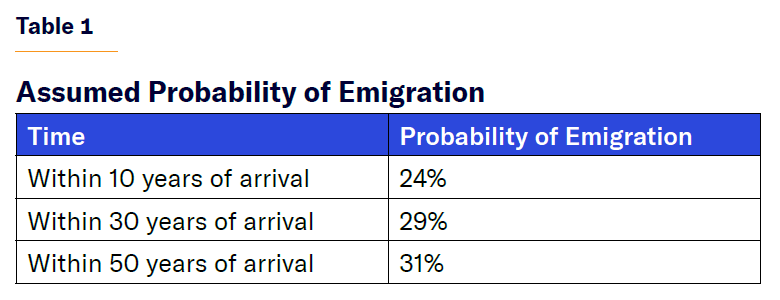
To apply these rates by year, I constructed the following function, which matches the cumulative probabilities of emigration at 10 and 50 years since arrival:
E(t) = AtB
Where E(t) is the probability of emigrating just at year t since arriving in the U.S., such that the cumulative probability of emigration at year t is equal to:
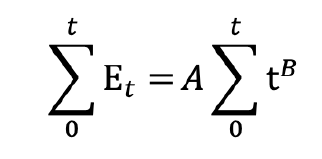
I solve for the parameters such that sigma(10/0)[E(t)] = 0.24 and sigma(50/0)[E(t)=0.31 and the function is monotonically increasing, meaning that cumulative emigration probability increases every year
A = 0.102498884
B = –1.267738271
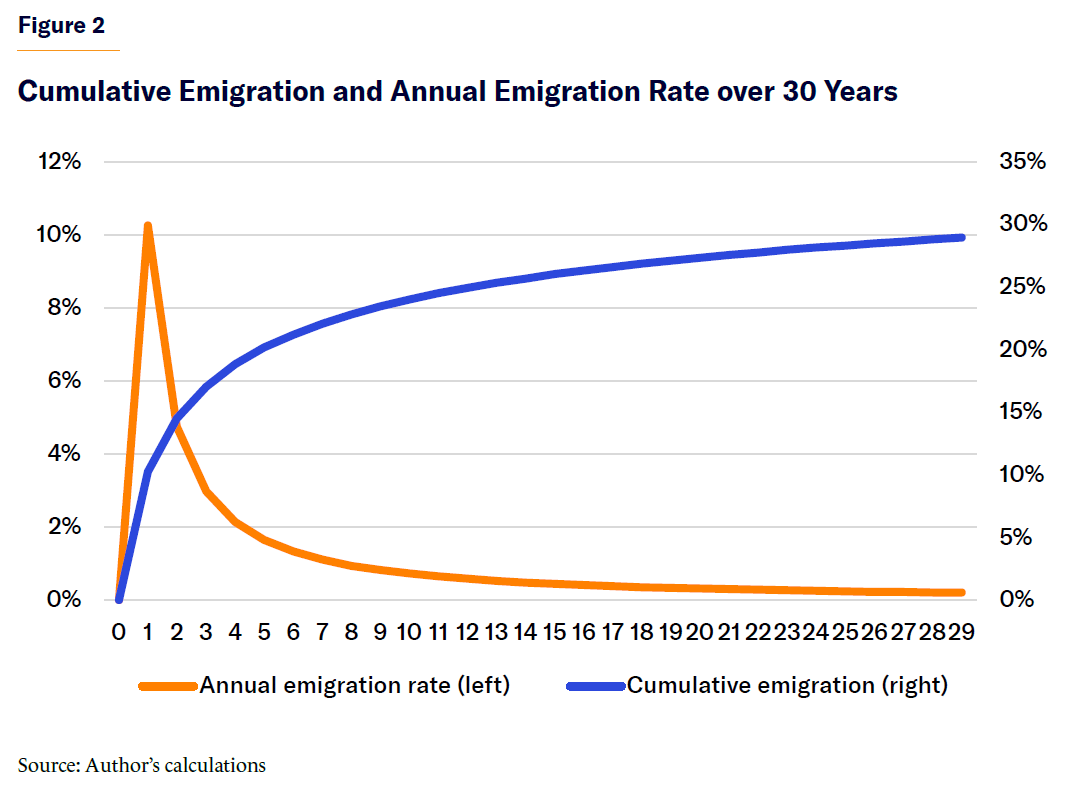
This creates a smooth and reasonable probability-of-emigration function with new immigrants having a high probability of leaving within the first year (10%) that quickly falls over time and approaches, but never reaches, zero. Figure 2 illustrates the emigration rate until year 30 because this analysis looks only at the 30-year impact of immigrants.
Public Education
Education spending is treated similarly to the first MI study, but with two improvements: the cost of educating immigrants and their descendants is now only the marginal cost to the federal government, not the average cost, reducing the assigned cost; and the spending on English as a second language training is now fully allocated to immigrants and their descendants, rather than to the entire population, on average. Free lunch and other school-related welfare programs are treated as they were in the first MI study, which is based on reported or assigned receipt by the census.[6] These changes result in a net reduction in the educational cost of immigrants to the federal government relative to the first MI study.
Taxes and Tax Credits
Tax revenue is measured similarly to the first MI study but with more recent data and one adjustment to address criticism by the Cato Institute on the previous tax credit calculation. Specifically, the first MI study looked at net tax liability and adjusted it by productivity growth and inflation over time. The result was an overvaluation of tax credits that grow only with inflation, not productivity, thus overstating the negative fiscal impact of low-skilled immigrants. This study fixes that error by separating income-tax liability from tax credits, growing the former by both productivity and inflation and the latter by inflation alone.
Major Spending Programs
No methodological changes were made to the fiscal impact calculations of Social Security, Medicare, and Medicaid. Social Security’s impact remains measured by self-reported income, while Medicare and Medicaid enrollment is collected both from self-reported status and imputation by the census to households that do not report. Medicare and Medicaid spending is estimated based on the age and education of the recipient.
Young Immigrants
As in the first MI study, I assume that immigrants who come to the U.S. before the age of 25 behave in ways congruent with their ultimate education level. I.e., immigrant children who end up never graduating from high school are different in childhood from immigrant children who will end up obtaining a college degree. This sounds obvious but is an important difference from the NAS study. The NAS study uses probabilistic estimation to infer that immigrant children will end up like the children of immigrants born in the United States. One of the several issues with the NAS analytic framework is that it excludes the impact of international students who arrive in the U.S. without their parents. More materials relating to this report’s treatment of young immigrants can be found in the first MI report.[7]
Children and Grandchildren of Immigrants
For simplicity, my previous MI report disregarded the impact of the second and third generation from the fiscal impact of immigrants. This time, I am accounting for the revenue and cost resulting from the children and grandchildren of immigrants born in the United States. Since the children of immigrants do not begin paying taxes until at least 16 years after immigrant parents first give birth, and all descendants of immigrants are a net fiscal burden until at least age 18, the fiscal impact of all immigrants is more negative in every year of the 30-year budget window, compared with the first report as a result of accounting for their descendants.
This study accounts for children (second generation) and grandchildren (third generation) of immigrants (first generation). Fertility of the first generation by age is obtained from CBO demographic projections, which assume a current 1.8 children per female immigrant. I assume that half the immigrant flow is female. Additionally, CBO projects that fertility will decline among immigrant mothers to 1.6 children per woman by 2054. Accounting for the third generation does not change the budget picture much because very few grandchildren are born in the 30 years after an immigrant’s admission, except for the group of immigrants who arrive in their late teens and early twenties. Furthermore, the fertility of the second generation is assumed to be equal to other native-born Americans, which is approximately 1.6 children per woman now, falling to 1.4 in 30 years.[8]
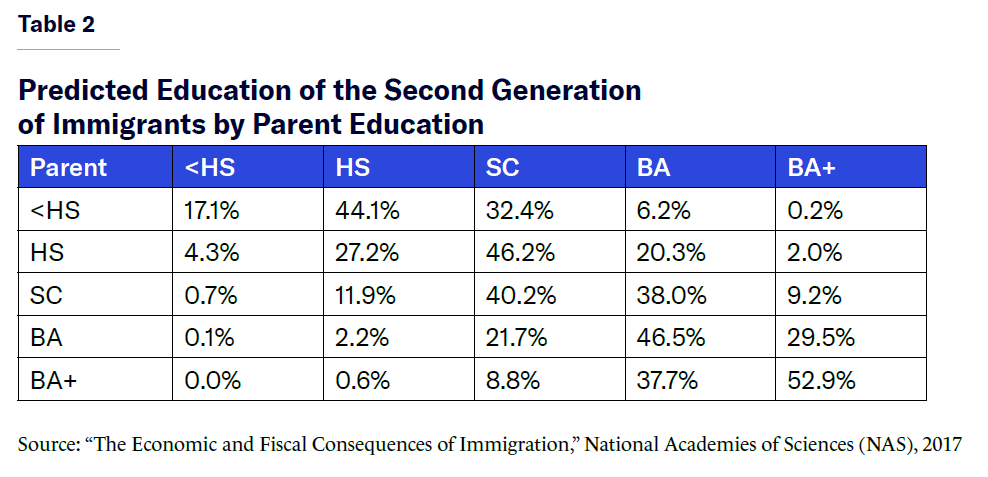
The children of immigrants are assumed to be more educated, on average, than their parents, except in the case of immigrants with advanced degrees, as there is some reversion to the educational mean. The parent–child education matrix used in this study (Table 2) is the same one as the 2017 NAS study.
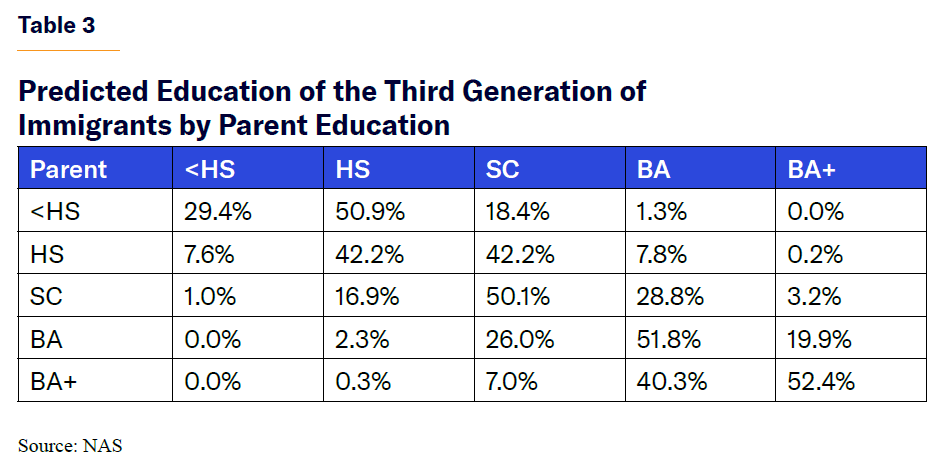
While the third generation (Table 3) is assumed to transition upward in educational attainment as the children of any other native-born parent would, there is not as much improvement as between the first and second generations.
Additionally, fertility is adjusted for both the first and second generation by their education using census estimates, an improvement over the NAS methodology, resulting in more children from high school dropouts than college-educated immigrants. Interestingly, native-born Americans and immigrants with advanced degrees tend to have more children than those with just an undergraduate degree. This is especially true among highly educated immigrant women who tend to work much less and have more children during peak childbearing years than native-born highly educated women.
Figure 3 shows the expected number of children and grandchildren of representative 20-year-old immigrants with differing educational levels over the next 30 years. Some 30% of immigrants leave the country over 30 years; therefore, realized fertility among immigrants in the U.S. does not match the full fertility rate resulting from adding an additional mother to the population because many of them leave before having children.
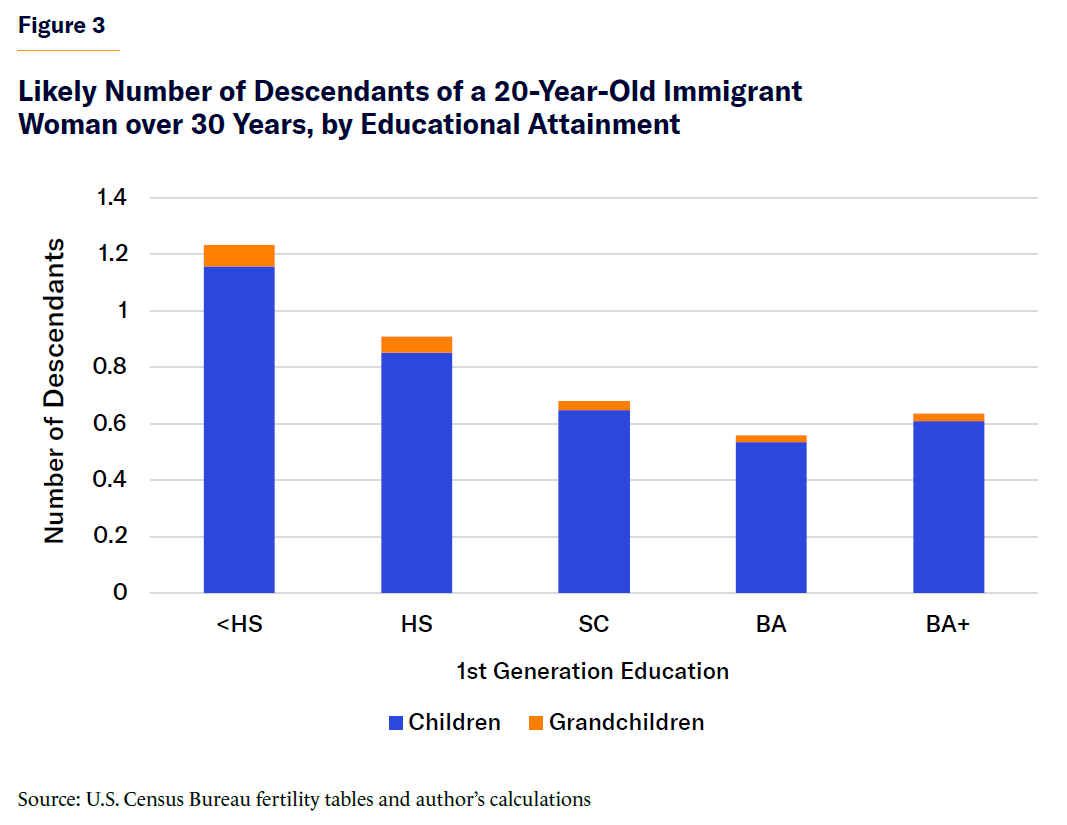
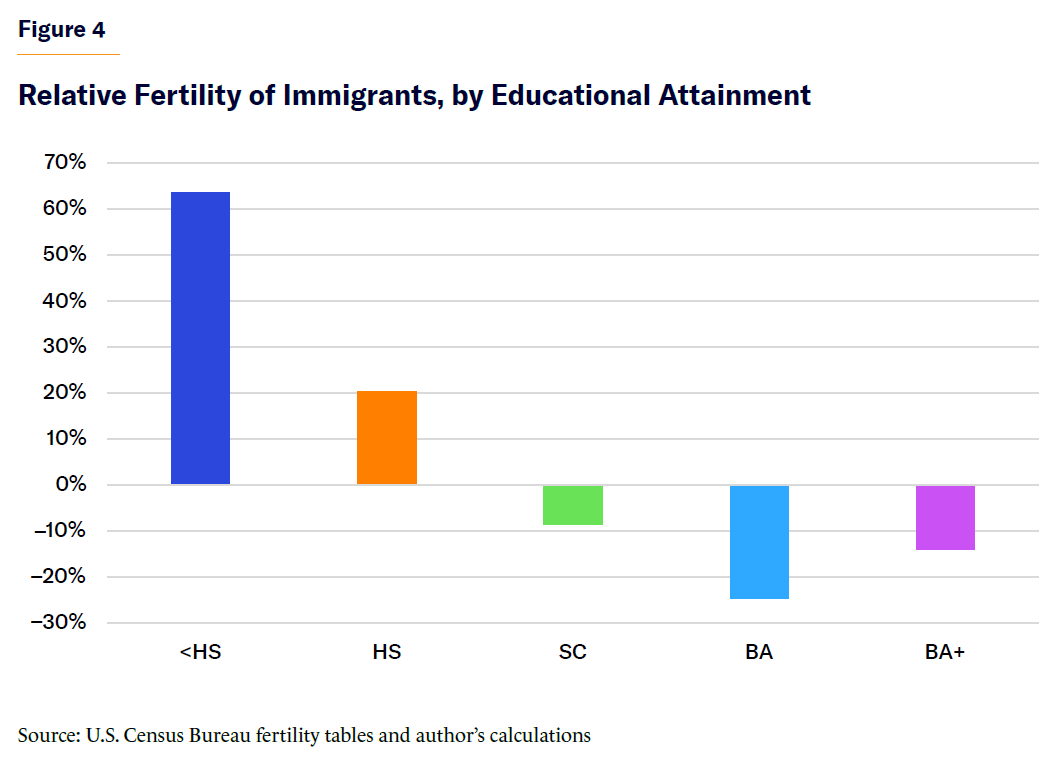
Figure 4 shows the fertility differences by education relative to the average, where high school dropout immigrants have over 60% more children than the average immigrant and college graduate immigrants have 25% fewer children than the mean.
The fiscal impact of the second and third generations of immigrants is assumed to be the same as other similarly educated native-born Americans. Critics may argue that the second generation tends to be even more fiscally positive than the first, which is generally true, but that can be accounted for by their higher education level. Additionally, the third generation tends to have a more negative fiscal impact than the average native-born American, tamping down on the criticism that I am underestimating the benefit of the second generation. Within the 30-year window, most years of life for the second- and third-generation immigrants are as children, and their tax contributions are small. Therefore, these differences among generations will not meaningfully alter the final estimate.
Accounting for the descendants of immigrants only affects four of the seven age groups’ fiscal impact—the census assumes that no one has children beginning at 50 years of age.
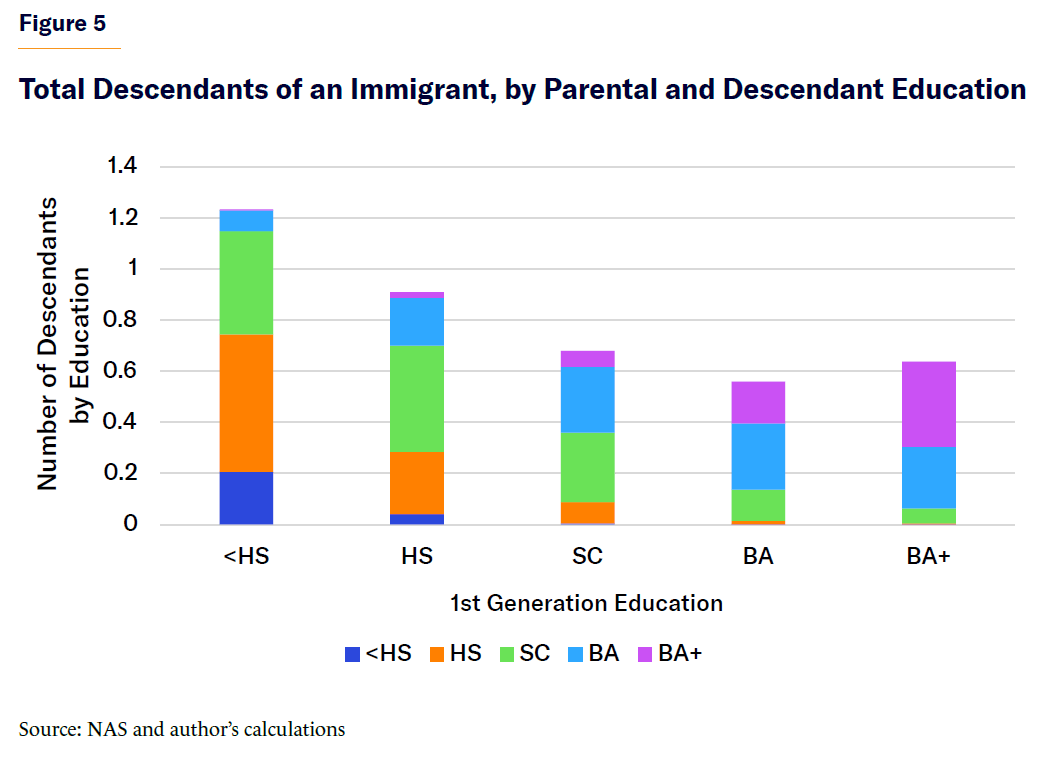
Figure 5 illustrates the estimated number of descendants of one 20-year-old immigrant of each of the five educational groups by the end of the 30-year period, and the educational attainment of these descendants.
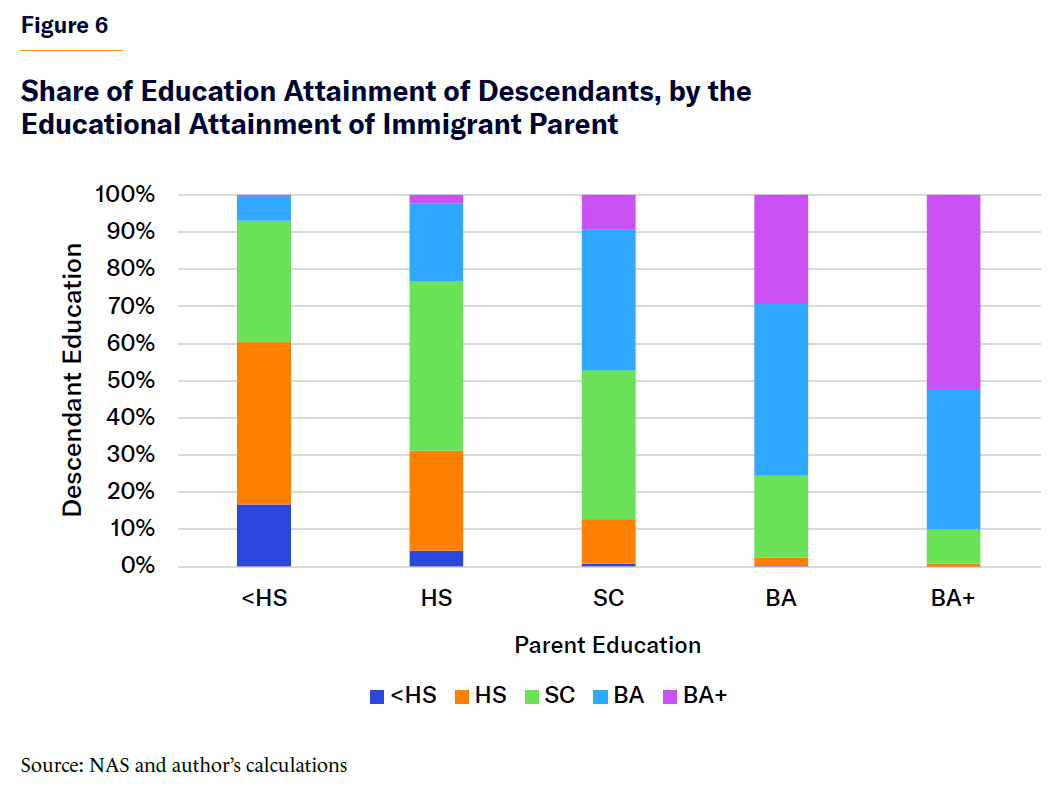
A different way of looking at the impact of an immigrant’s education level on that of their descendants is examining the share of their descendants who reach each educational level (Figure 6). For immigrants who do not complete high school, just 7% of their children earn a college degree. For immigrants with an advanced degree, 90% of their descendants earn at least a bachelor’s degree. Despite having half the number of total children, immigrants with an advanced degree are likely to produce over six times as many descendants who are college-educated as immigrants who did not finish high school.
Public Goods
Proponents of a more open immigration policy heavily criticized the first MI report on the lifetime fiscal impact of immigrants for assuming that immigrants increase spending on public goods, especially defense spending. This was generally a misunderstanding of the study’s calculation methods. It is reasonable to assume that public-goods spending rises with population, but it is less clear that defense spending does, as well. In this report, I soften the public-goods assumption by excluding defense and other pure public-goods spending completely. I also change the catch-up period of five years to 10 years. For “direct” public goods, such as transportation, agriculture, and law enforcement, I assume that government spending increases gradually over the first 10 years from immigrant arrival or birth of a descendant at 10% of the full rate annually. However, public-goods spending falls immediately upon the death or emigration of an immigrant or his/her descendants. This is a change in both restricting the public goods considered and lengthening the catch-up rate. These changes reduce the importance of public goods but still account for negative externalities on publicly provided transportation, energy, the justice system, and other government services.
The spending categorized as public-goods spending in this report is not necessarily a “public good” under the proper economic definition; rather, it represents the following OMB’s budget codes[9] detailed below:
270 Energy
300 Natural resources and environment
350 Agriculture
370 Commerce and housing credit
400 Transportation
450 Community and regional development
504 Training and employment
505 Other labor services
554 Consumer and occupational health and safety
750 Administration of justice
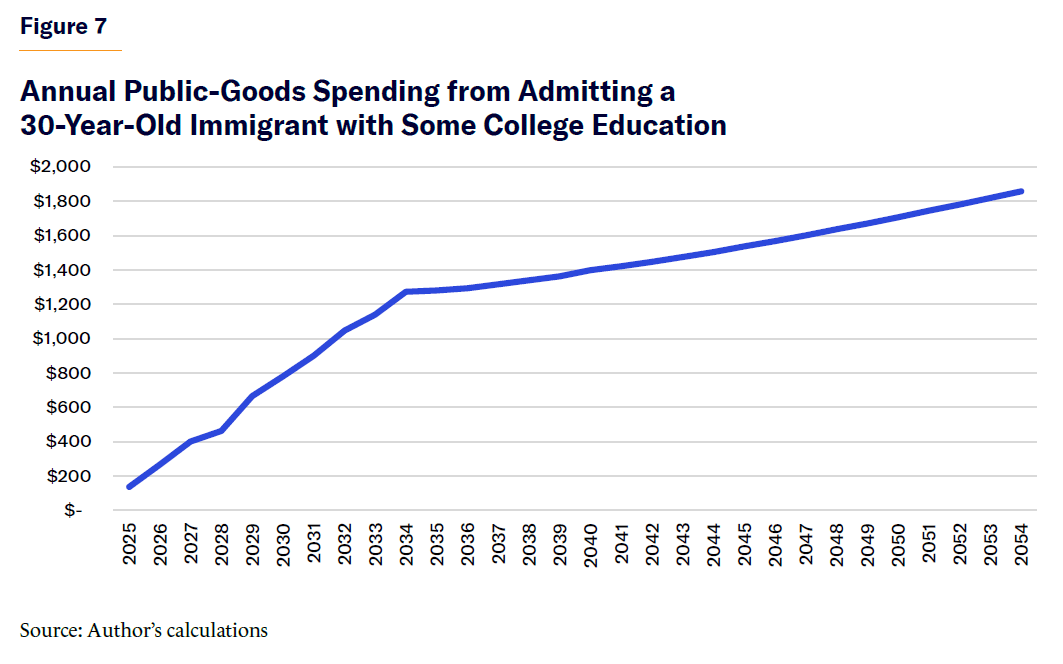
Pooling these categories of government spending gives us an annual per-capita federal government public-goods spending of $1,375 per person in 2025, rising to $2,742 over 30 years. For the first 10 years, immigrants do not increase public-goods spending nearly as much because they are still catching up by 10% annually toward the full rate, and then never reach the full $2,742 spending rate because 30% of immigrants leave the country within the 30-year period, and some also die. For example, Figure 7 shows that admitting one 30-year-old immigrant with some college education results in an increase of public-goods spending over the next 30 years of less than $38,000, or less than $1,300 annually, due to deaths and emigration.
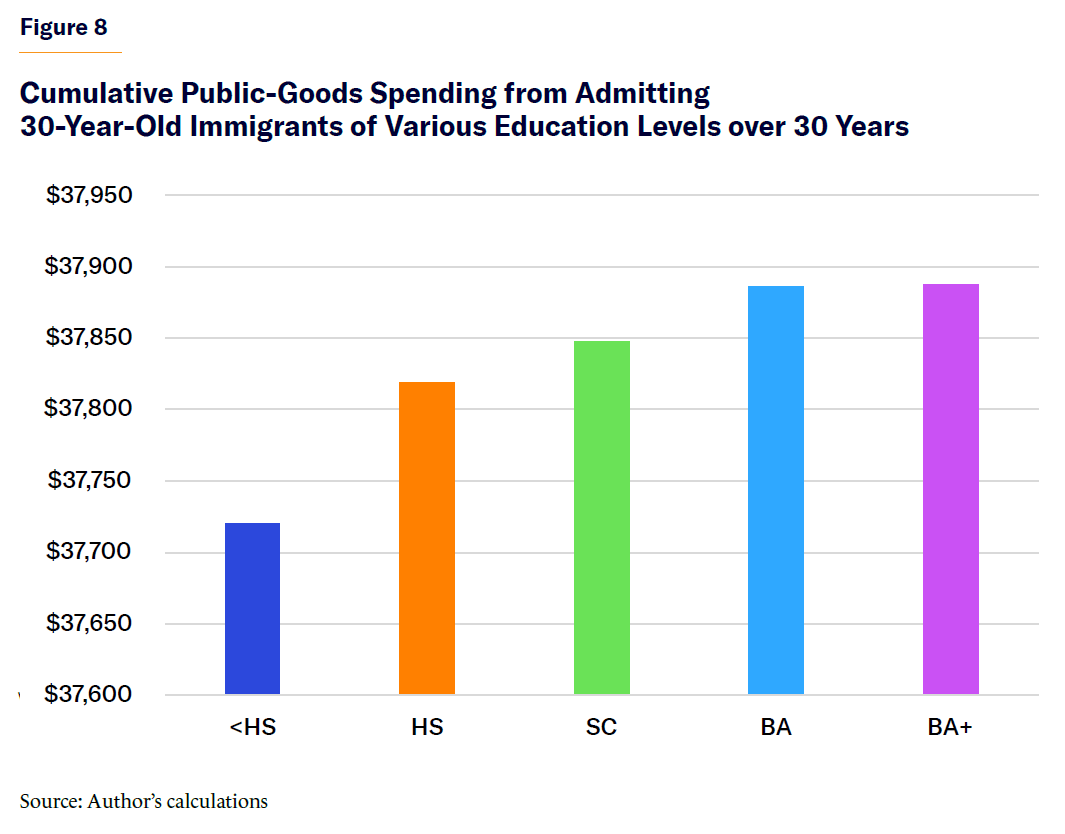
Additionally, despite what critics would argue, public-goods spending does not drive differences between immigrants of various levels of education or ages; in fact, it reduces them. Highly educated immigrants are less likely to die and thus use public goods at a higher rate than less educated immigrants. Young immigrants also have lower short-term mortality than older immigrants, increasing their public-goods use. As Figure 8 shows, the differences in total public-goods spending by education are minimal, with high-skilled immigrants inducing slightly more spending due to longer life expectancy.
Excluding public-goods spending from the fiscal impact estimates only strengthens the case for shifting immigration policy to favor younger and more highly educated immigrants, as both absolute and relative fiscal gains would be greater.
Interest on the Debt
A fair criticism of the first MI study was that interest accrued or saved from the fiscal impact of immigrants was miscalculated because it allocated new interest on the debt of the entire nation proportionally to immigrants based on their final primary fiscal impact. This method was an improvement over the NAS approach, which allocated all interest on the debt to immigrants, regardless of their primary fiscal impact; but it is still incorrect from an accounting standpoint. I acknowledge this and fix the issue by calculating the nominal interest accrued or saved every year based on the cumulative fiscal impact of each immigrant and his/her descendants. The interest rate used is projected by CBO, and that accounts for the resulting higher interest rates from the extension of the 2017 tax cuts.[10]
Institutionalization
This report uses the 2024–54 economic and demographic projections of CBO[11] as a baseline for future projections and ACS data to measure institutionalization due to imprisonment or nursing-home use. For a summary and more detailed explanation of all assumptions, see the first MI study’s methodology section.
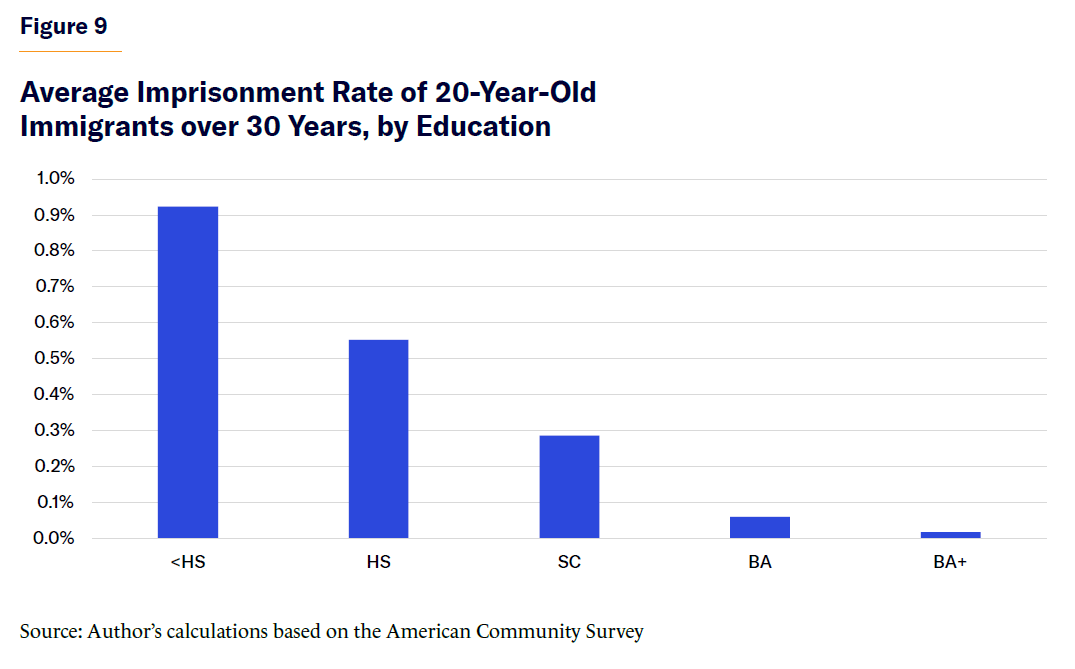
Most values are adjusted downward or upward, based on the institutionalization rate of the population, because the CPS surveys only the noninstitutionalized population for its data. The institutionalized population is assumed to be those in a health facility if they are under the age of 15 and a nursing home if they are over 60, while those institutionalized between the ages of 15 and 59 are assumed to be imprisoned. Therefore, the average taxes paid must be adjusted downward by 1%, for example, if 1% of the population is institutionalized; I assume that institutionalized individuals do not pay taxes (or receive most benefits, unless they are retired and receive entitlements). Other benefits, such as Medicare, are adjusted upward by the institutionalization rate over the age of 60 but downward under 60, as nursing-home residents receive Medicare while prisoners do not.
To illustrate the importance of accounting for institutionalization, Figure 9 shows the average institutionalization rate of a 20-year-old immigrant, depending on his/her ultimate educational attainment over 30 years. In any given year, nearly 1% of immigrants without a high school diploma are likely to be imprisoned, while a nearly statistically insignificant 0.02% of immigrants with an advanced degree are likely to be imprisoned, a staggering 50 times difference.
Economic Growth and Other Assumptions
Unlike the previous MI study, this improved version accounts for the economic impact of immigrants and thus their indirect impact on capital and corporate tax revenues. I assume that there is neither labor substitution nor complementation: GDP and the capital stock grow proportionally to the labor income of immigrants based on the labor share of GDP. The labor share of GDP is approximately 57%,[12] according to the U.S. Department of Labor, and wages represent approximately 75% of total labor compensation. Thus, the GDP impact predicted by any salary will equal 42.6%:[13]
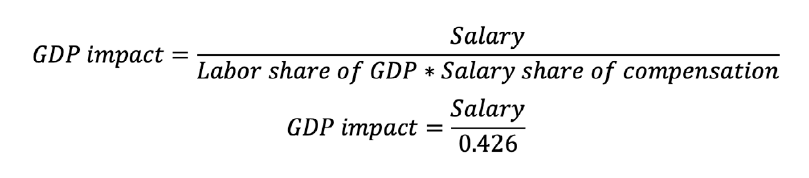
Consequently, highly paid immigrants grow the economy more than those who earn less because, on average, labor compensation reflects productivity. While there is an argument that low-skilled workers complement the labor of high-skilled ones, thus raising the tax payments of high-skilled workers,[14] it may also be true that low-skilled immigrants substitute against other low-skilled workers, reducing their tax payments and increasing their welfare benefits.[15] The economic literature shows that these effects are small in either direction, only in the short run; and they offset each other, so I will avoid this debate and assume that there is neither labor complementation nor substitution and that the economy has constant returns to scale.
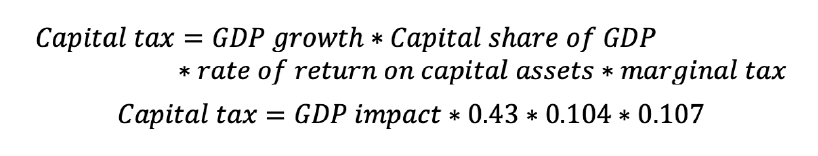
Immigration-prompted economic growth enables me to account for higher capital gains and corporate taxation by assuming that the larger capital stock pays the average effective marginal tax rate on capital reported by CBO (10.7%).[16] The projected capital stock growth is simply the capital share of GDP estimated by DOL (43%; 1—labor share) multiplied by the increase in GDP from adding an additional immigrant of specific characteristics. Therefore, the increased capital tax revenue from the larger stock is the average marginal tax rate on capital returns times the CBO-estimated return on that stock of capital (8.2% annual after inflation; I adjust it to nominal terms by scaling it for projected inflation).[17]
An immigrant group that earns, on average, $50,000 in salary after adjusting for institutionalization, employment, death, and emigration would produce an annual GDP impact and capital tax revenue as follows (assuming inflation of 2% for the purposes of this example):
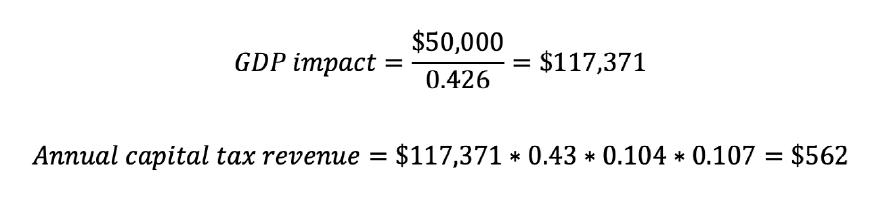
Most growth in the capital stock goes untaxed because taxation is deferred until gains are realized, and many of these gains are accumulated in tax-free investment vehicles or erased by policies such as step-up basis at death. Therefore, this estimate of capital tax revenues is likely an overestimate, but one should think of it as capturing the indirect growth impact of a larger workforce on industries that lead to higher individual and corporate tax revenues.
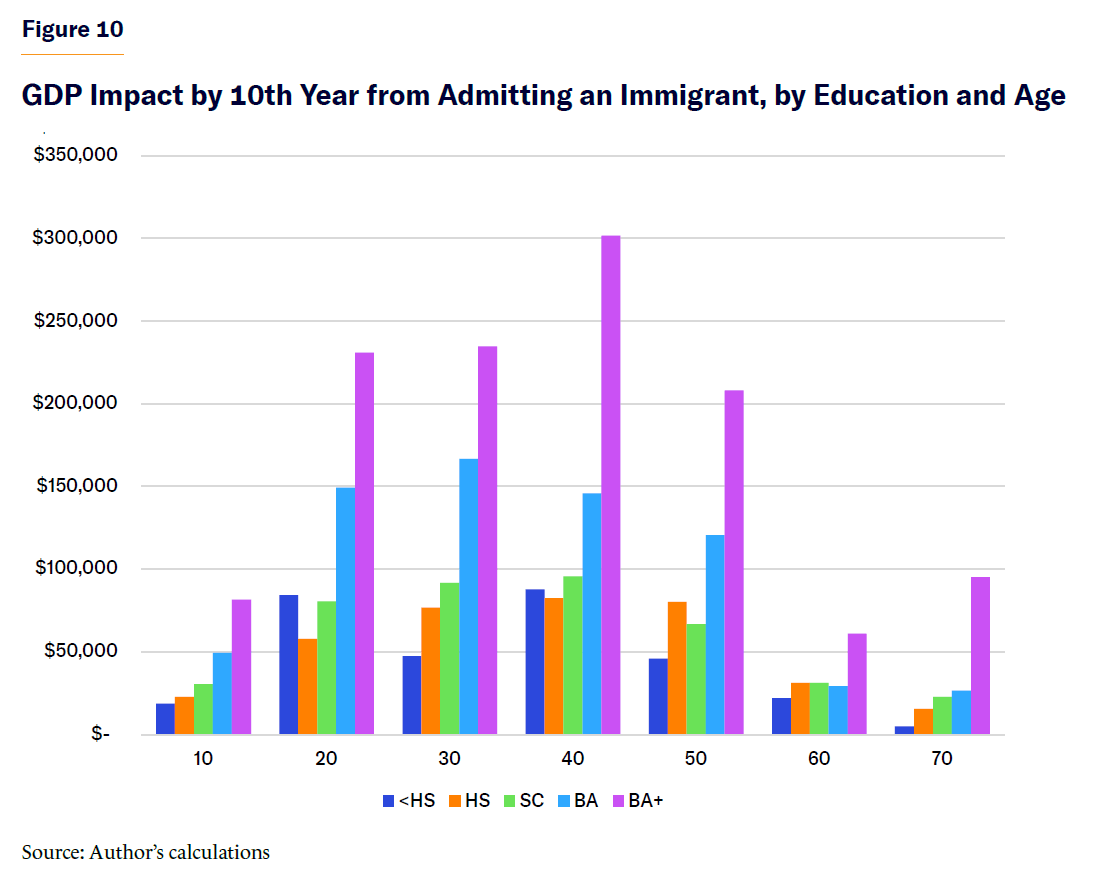
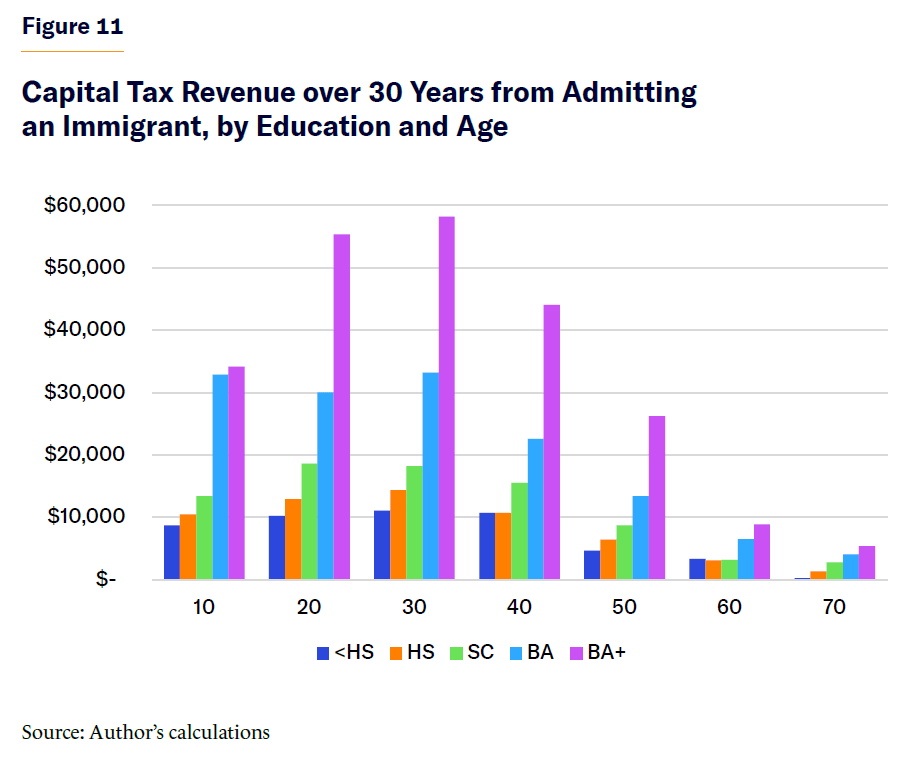
To illustrate the relative importance of adding economic growth to the fiscal impact estimates, I show in Figures 10 and 11 how much representative immigrants of varying ages and education levels add to GDP by the 10th year and capital tax revenues over 30 years.
Summary of Assumptions
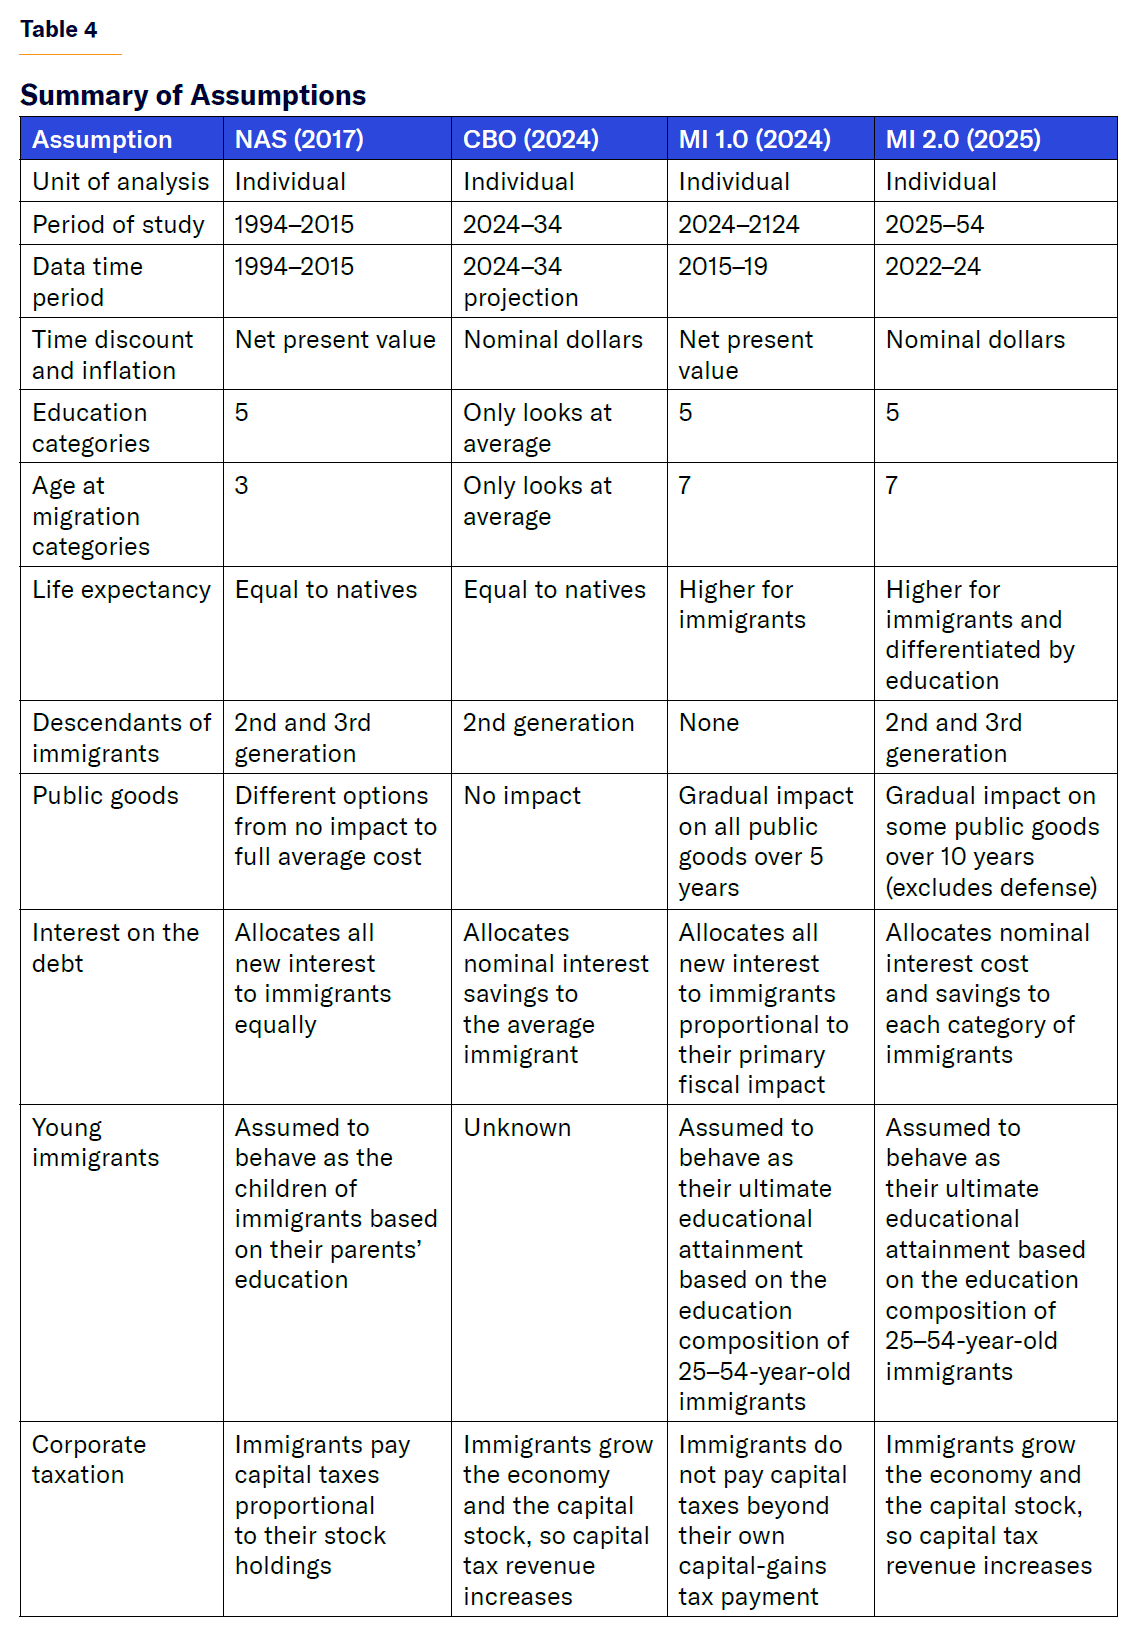
Table 4 shows a summary of assumptions among various studies of the fiscal impact of immigration.
Part 2: Illustrative Examples
The main model used for the illustrative examples is one that includes the direct and indirect fiscal impact of immigrants and their descendants. Calculations for both policies recommended below and the illustrative examples include the costs and taxes paid by the children and grandchildren of immigrants, as well as the capital taxation raised from their impact on gross domestic product and the capital stock.
The Role of Education
First, I consider two typical immigrant categories: immigrants with a bachelor’s degree who came to the U.S. at 30 years old; and immigrants without a high school diploma of the same age. These immigrants represent all immigrants who arrived in the U.S. between the ages of 25 and 34 and met that education criteria.
The college-educated group is typical among employer-sponsored immigrants, for permanent EB visas or for H-1B, O-1, L-1, J-1, and other work visa holders. These immigrants are at the start of their careers, so they have many years left to pay taxes before they begin collecting entitlements.[18] Many of them emigrate before retirement; therefore, they receive no Medicare but pay some payroll taxes into the system. The group with less than a high school education is typical among family-sponsored immigrants from Latin America and unlawful immigrants. These immigrants are also at the start of their careers, and unlawful immigrants earn less income but also collect fewer government benefits.
Table 5 and Figure 12 show the detailed sources of tax revenue paid by the average immigrant in each of these groups, and Table 6 and Figure 13 show the specific government benefits that they receive over a 10-year period.
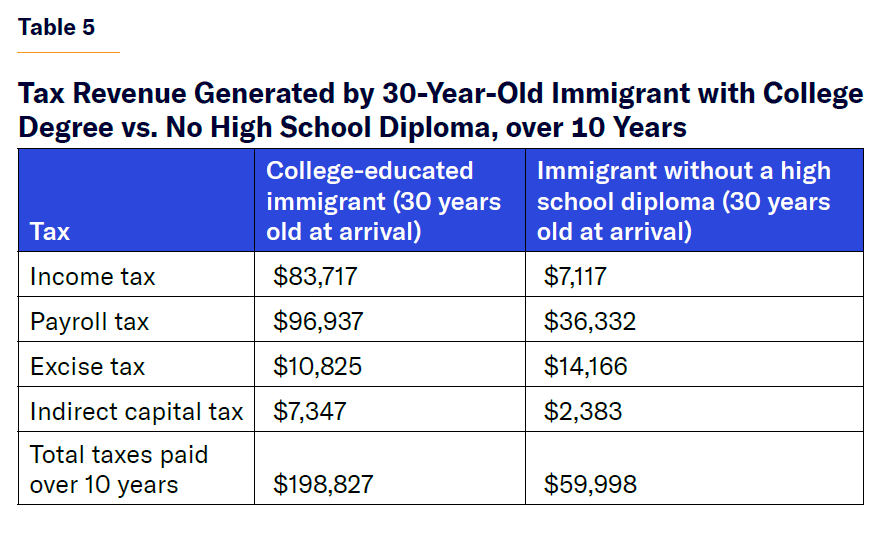
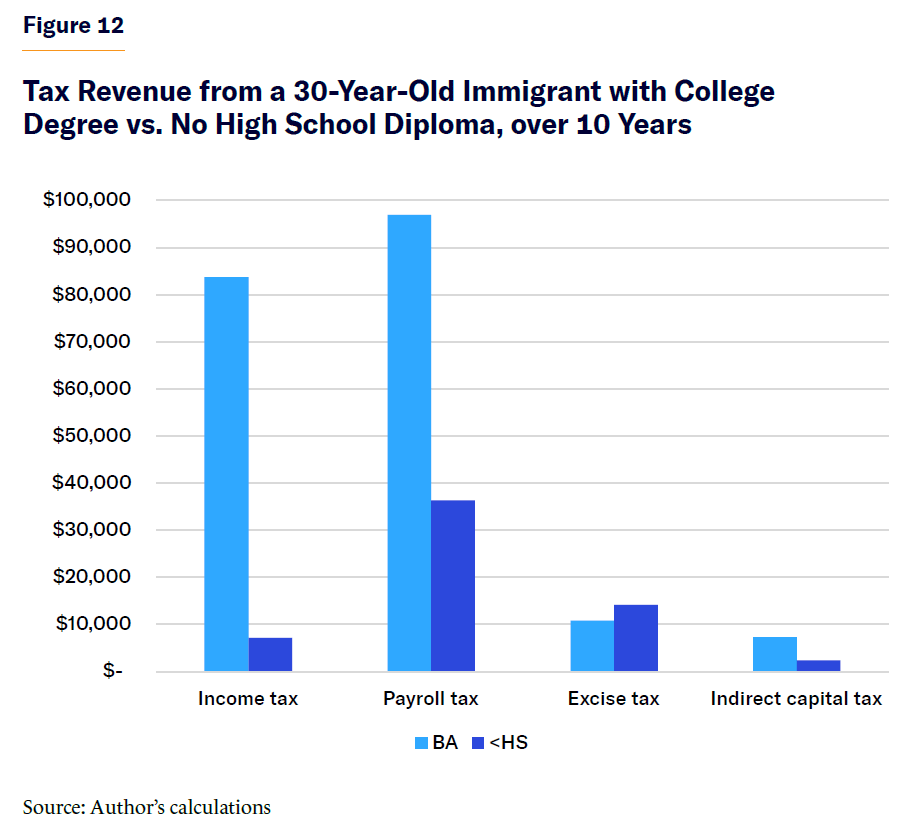
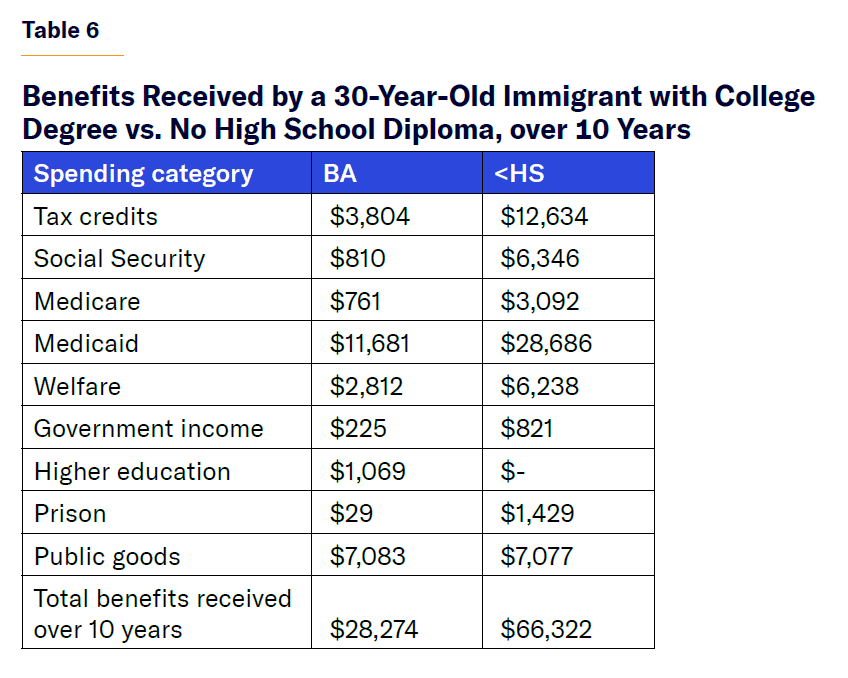
The figures and tables in this first example show that the main source of fiscal impact differences between high- and low-skilled immigrants is tax revenue, where college-educated immigrants pay 3.3 times more in taxes than those without a high school diploma. This latter group receives 2.3 times more benefits from the government than the college-educated. Income-tax liability alone explains nearly half the fiscal impact gap between immigrants with a college degree and those without a high school diploma. While difficult to calculate, all immigrants likely below a certain age could be a fiscal boon to the federal government if noncitizens are excluded from all welfare programs and tax credits, without touching the eligibility for Social Security and Medicare of legal permanent residents.
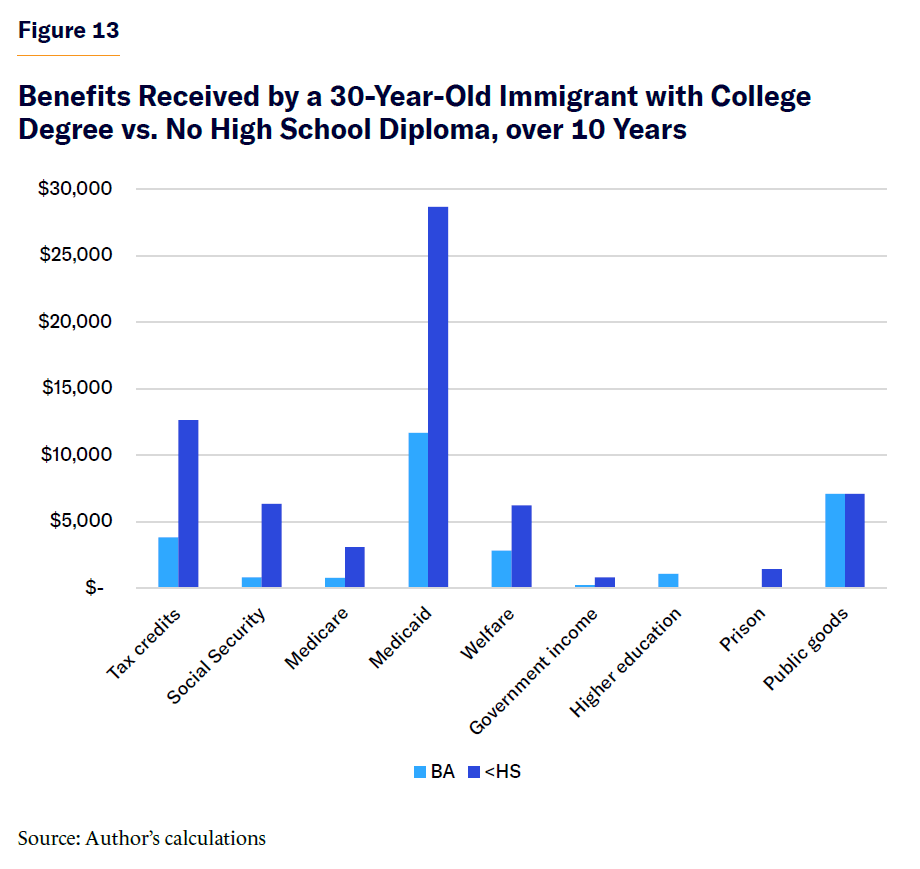
Figure 14 shows how the fiscal impact differences compound over time. The cumulative fiscal impact of a 30-year-old immigrant with a college degree is a net gain for the federal government of nearly $215,000 over 10 years and $1.7 million over 30 years. Meanwhile, a 30-year-old immigrant without a high school diploma will cost the federal government about $5,000 over 10 years and gain it $35,000 over 30 years.
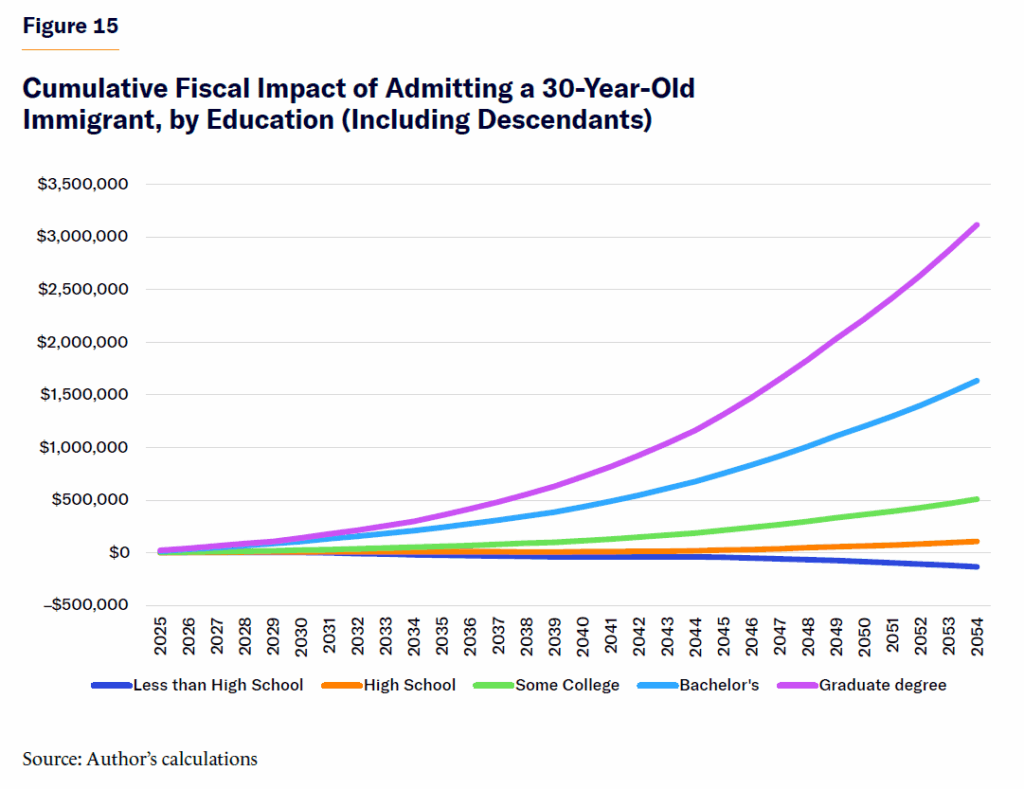
One might be tempted to assume that, regardless of education, immigrants are net contributors if a 30-year-old high school dropout pays more in taxes than he/she receives in benefits. But that conclusion is incorrect, as it does not account for the descendants’ impact. As mentioned in the previous section, less educated immigrants have more children, and the children they do have are less educated and more costly than the descendants of more educated immigrants.
Accounting for descendants (Figure 15), the total fiscal impact of admitting one immigrant who is 30 years old without a high school diploma is a loss of $20,000 to the federal government in the 10-year budget window and a loss of over $130,000 over the 30-year budget window. On the other hand, admitting one college-educated 30-year-old immigrant results in a net gain of over $200,000 in the 10-year window and a gain of $1.6 million in the 30-year budget window (Figure 16).
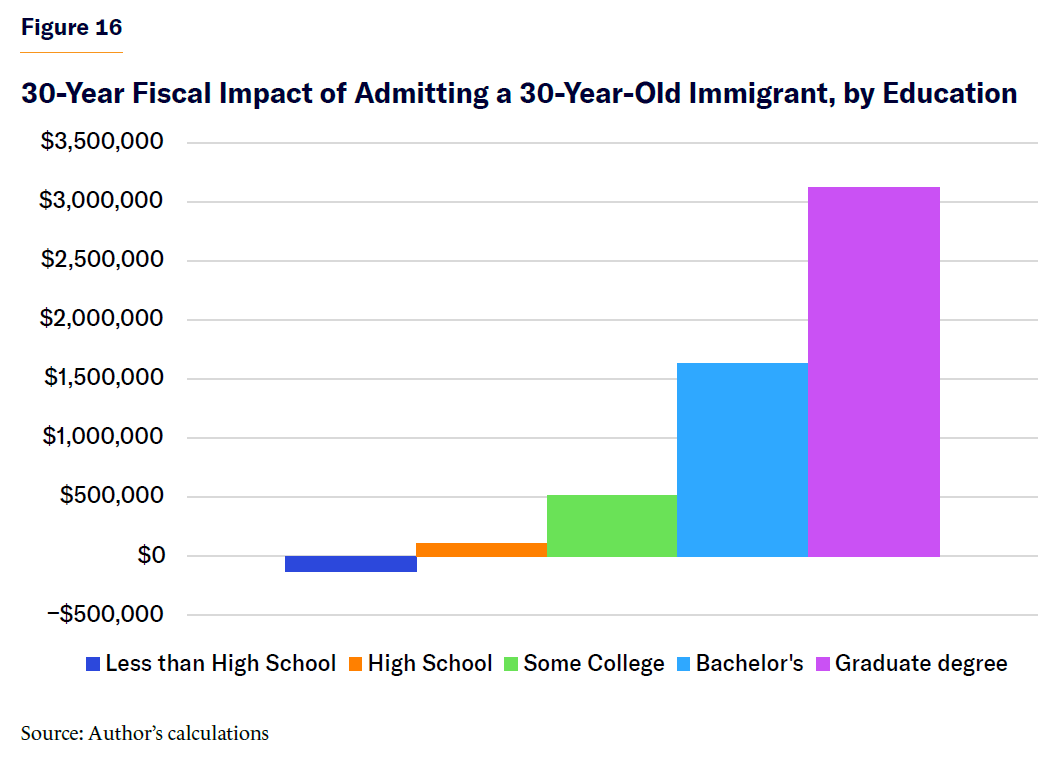
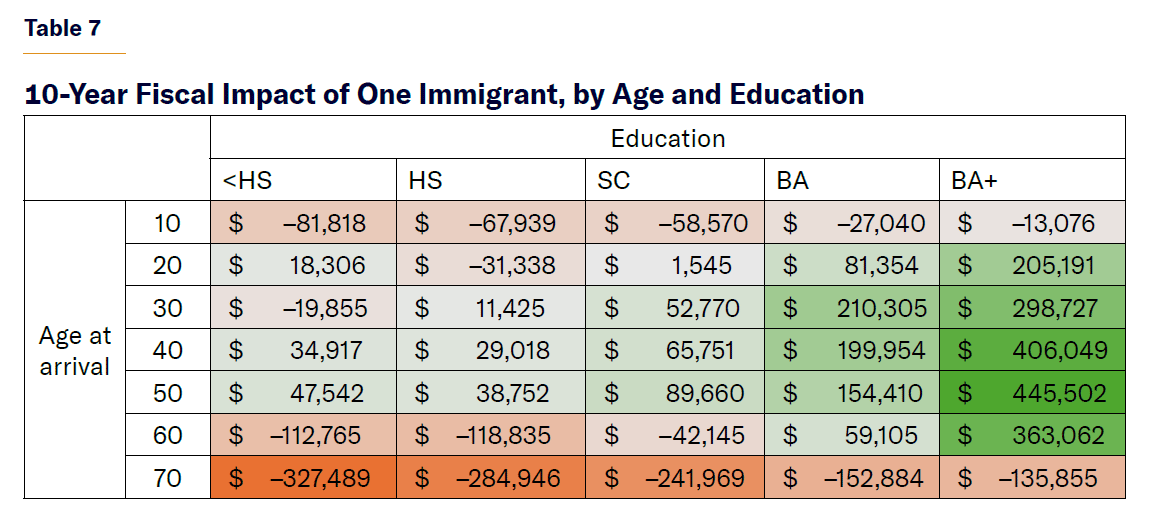
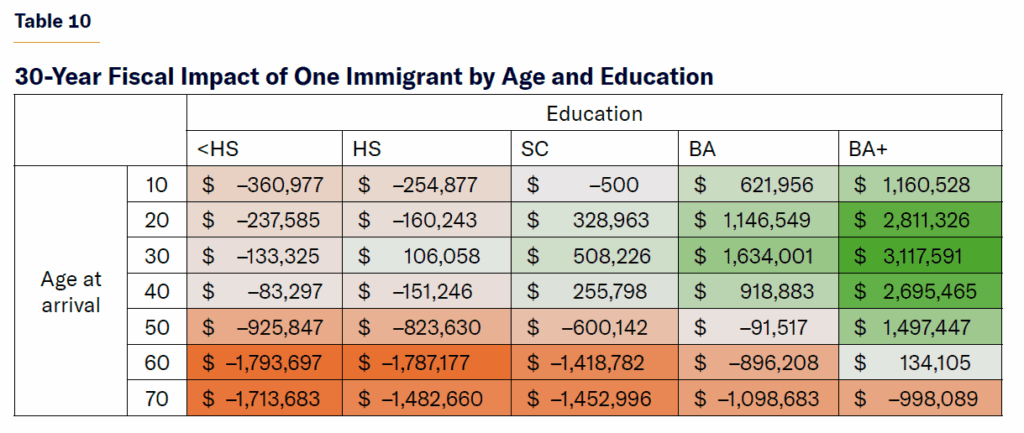
A 30-year-old immigrant without a high school diploma represents a net fiscal burden to the federal government of $20,000 over 10 years and over $130,000 over 30 years. On the other extreme, an immigrant with an advanced degree who arrives at the age of 30 will save the federal government $300,000 over 10 years and $3.1 million over 30 years. An immigrant with just a high school diploma results in little to no gain, while immigrants with some college education contribute to the federal government more than $50,000 and $500,000 over 10 and 30 years, respectively, net of benefits that they may receive. Immigrants with only a bachelor’s degree net the federal government $210,000 and $1.6 million over 10 and 30 years, respectively.
The differences in fiscal impact would be just as staggering if we did not account for the little public-goods spending that is being reasonably allocated, since highly educated immigrants live longer and thus consume more public goods than immigrants with less education.
Similarly, for GDP and population growth, different educational levels result in varying outcomes. The more highly educated immigrants earn more and are more likely to work, so they grow the capital stock and the economy to a greater extent while also having fewer and more highly educated children. Having fewer children means that highly educated immigrants increase the population to a lesser extent over the long run than those with less education, though all groups show below-replacement fertility rates. The lower fertility of college-educated immigrants means that they have fewer children to work in the future and grow the economy, but because their children are much more educated than the children of immigrants with less education, it more than offsets the impact of their lower fertility on GDP. Moreover, even though highly educated immigrants have fewer children, they live longer lives, further offsetting the impact of lower fertility on every front.
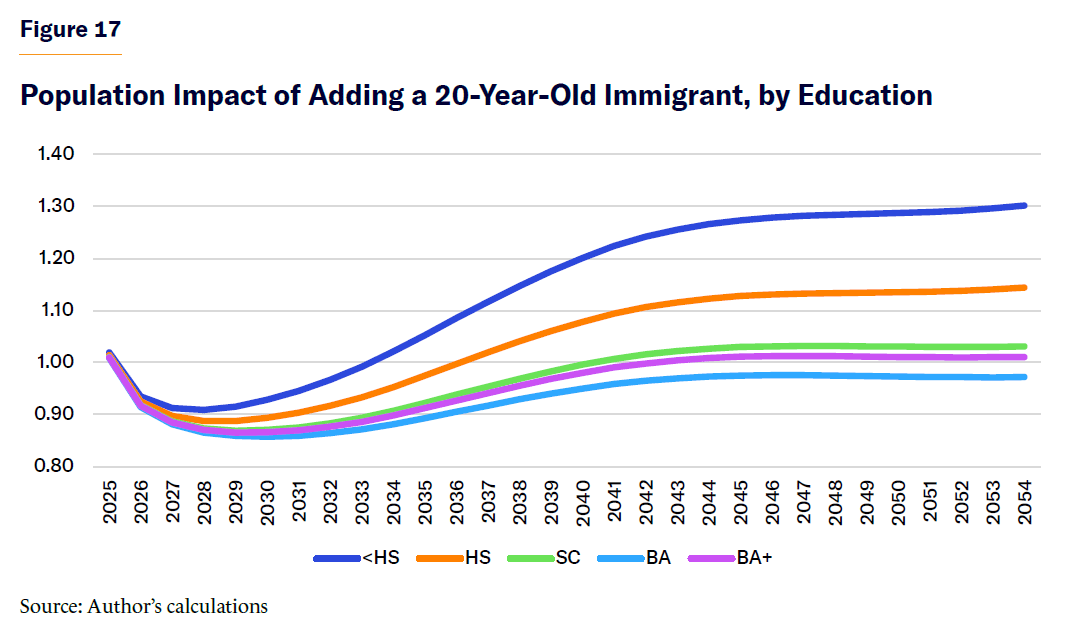
Figure 17 shows the impact on the population of adding one 20-year-old immigrant of various education levels over 30 years. In this case, I model a 20-year-old immigrant to encompass the greatest share of a woman’s childbearing years, from 20 to 50 years old.
The population effect of adding one 20-year-old immigrant begins above one in the first year because some immigrants immediately have children, but then the effect falls for all because of emigration and death. This holds true until fertility overcomes the dip by the end of the 30-year period for immigrants without a college education. (However, if we project the population impact beyond 30 years, which the figure does not illustrate, it will once again fall below one for all except immigrants without a high school diploma, as every other group has below-replacement fertility.) Population impact matters because if there is a negative effect on assimilation and culture from increasing the share of Americans who are foreign-born or their children, then shifting the immigration flow from low-skilled to high-skilled will reduce the immigrant share of the population over time without restricting admission.
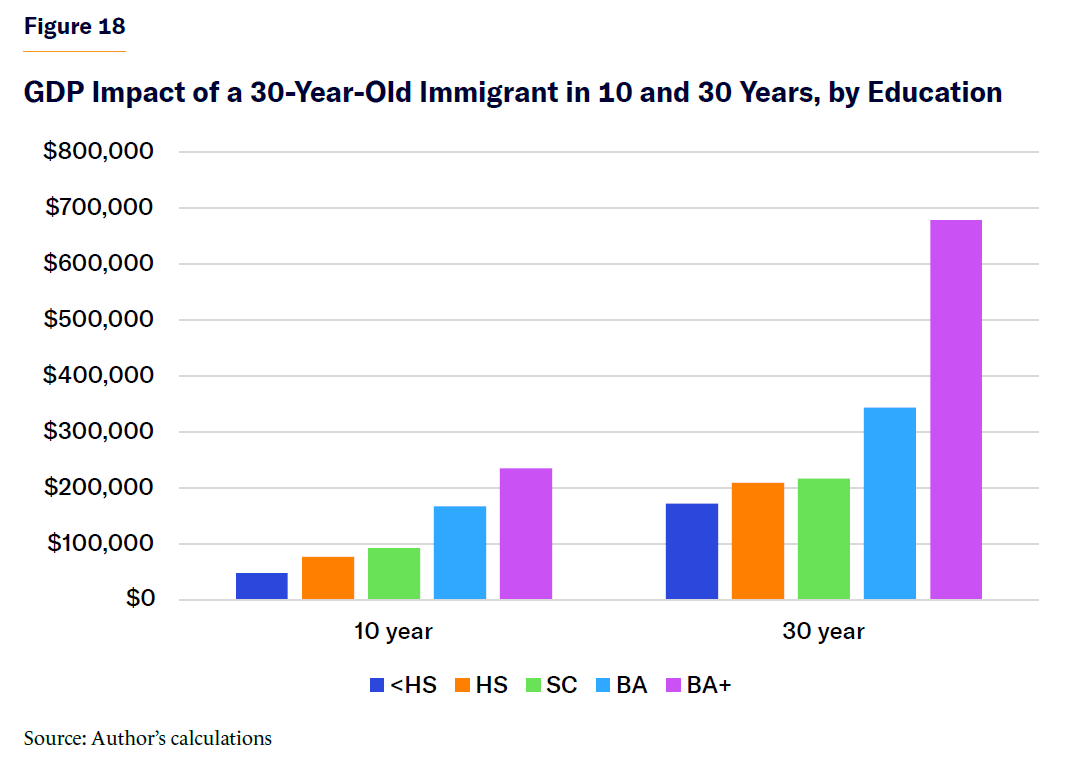
The impact on GDP also differs greatly by immigrant education (Figure 18), and the differences are just as stark as we saw with fiscal impact.
Though GDP impact is positive for all immigrants because they all add to the labor force, an immigrant with an advanced degree increases GDP five times more over 10 years and four times more over 30 years than an immigrant who did not complete high school.
The economic-impact differences between the two groups of immigrants shrinks by the end of the 30-year budget window because of higher fertility among the less educated, which produces more workers by the end of the 30-year period. This trend likely flips the impact in favor of the less educated group beyond the 30-year period, relative to immigrants with some college and just a high school diploma, but not relative to college graduates.
The Role of Age
Next, I consider the differences among similarly educated immigrants who arrive in the U.S. at different ages. Because this analysis does not account for the entire lifetime of the immigrant (only 10- and 30-year periods), immigrants who arrive as children are universally fiscal burdens for the federal government, while some older immigrants without much education are fiscal assets, although they would not be assets if the analysis looked at the long run. For a long-run fiscal impact analysis, see the previous Manhattan Institute report on the lifetime fiscal impact of immigrants. Still, it is worth understanding the role that age plays in the scoring of immigration legislation under CBO’s 10- and 30-year timeline.
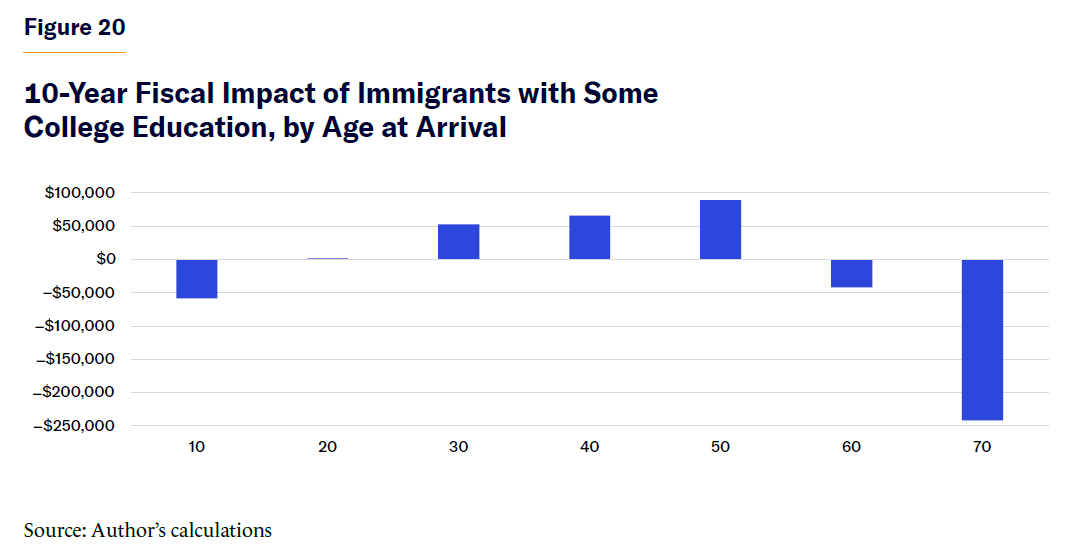
Figures 19, 20, and 21 compare the cumulative fiscal impact of immigrants with some college education, but no bachelor’s degree, who immigrate at ages 10, 30, 50, and 70 years old. Notice that in the 10-year budget window, immigrants who arrive as children represent a nearly $59,000 fiscal burden, while 50-year-olds with the same education earn the federal government a net $90,000. Yet when we look beyond the 10-year budget window to the 30-year window, young immigrants are now expected to cost the federal government a mere $500, while the 50-year-old immigrants will cost a net $600,000. If Congress considers only the 10-year budget window, then 50-year-old immigrants are preferable to children, but if Congress were to look beyond to the 30-year budget window, children are clearly preferable to 50-year-old adults. The reason is simple: the 10-year-old immigrant does not pay much in taxes or generate economic activity until he finishes his education, about 10 years later, while the 50-year-old is working and paying taxes at least until the age of 60.
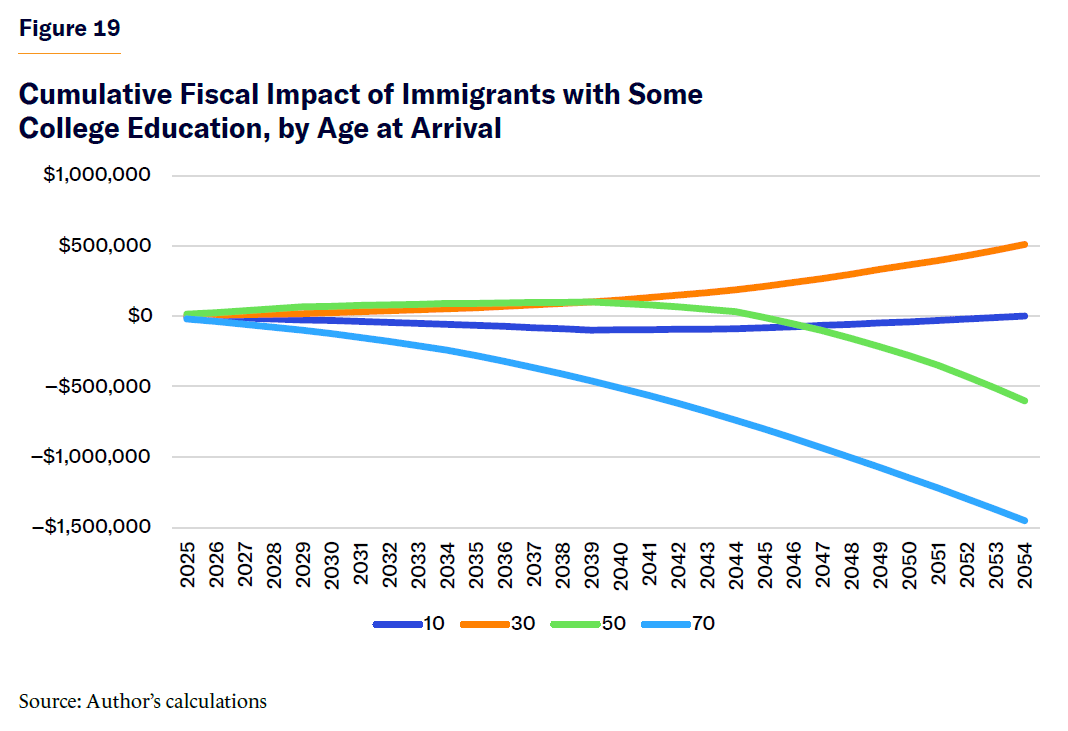
Figure 19 shows the cumulative fiscal impact of all immigrant age groups who end up obtaining some college education over the 10-year budget window, while Figure 20 shows the same fact over the 30-year budget window.
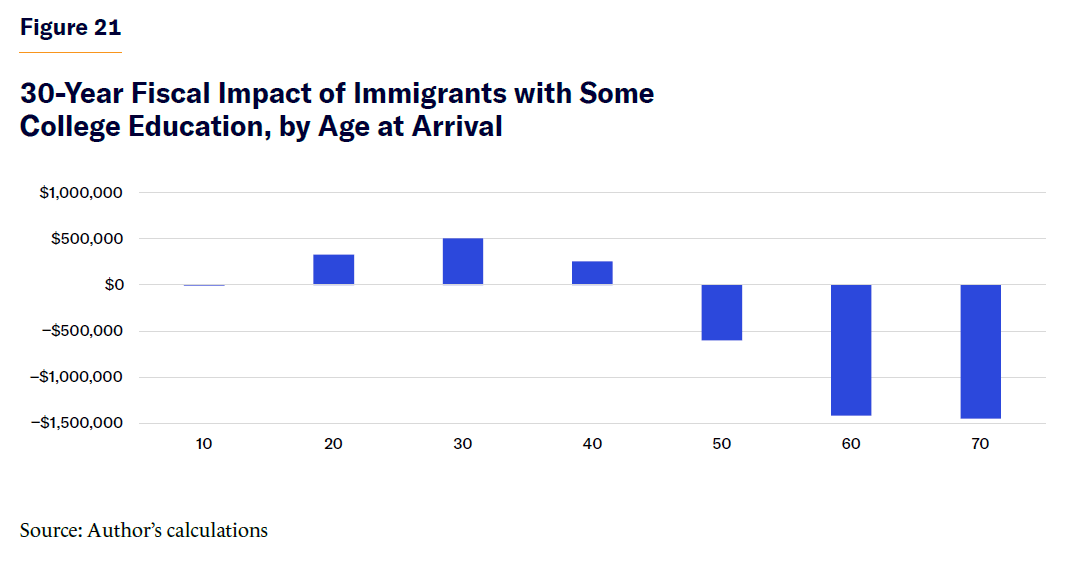
Notice how the fiscal impact of three age groups flips when we look at the 30-year versus the 10-year impact. While immigrant children are a significant fiscal drag over a 10-year period, they have little impact in either direction over 30 years. Fifty-year-old immigrants with some college education net the federal government the most of any age group over the first 10 years, but they become a significant fiscal burden over a 30-year measurement because they start collecting Social Security and Medicare.
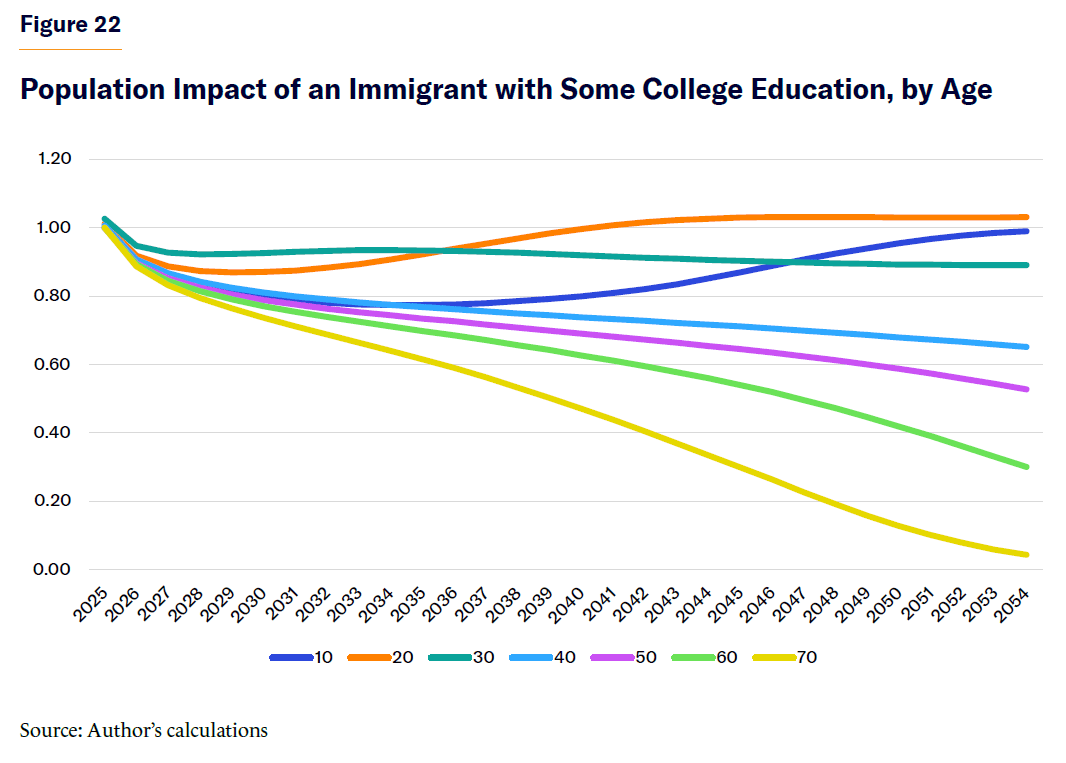
Moving on to population impact and GDP, immigrant children will not have children for many years, unlike middle-aged immigrants. And 50-year-old and older immigrants are expected to have no children at all, according to the census and CBO.[19] Figure 22 illustrates the expected population impact of adding one immigrant of each age group from 10 to 70 years old. Similar to the population impact by educational attainment, the effect starts above one for immigrants in their childbearing years and falls for all groups over time because of emigration and death. While immigrants aged 10–30 add about one person to the population by year 30, older immigrants add fewer.
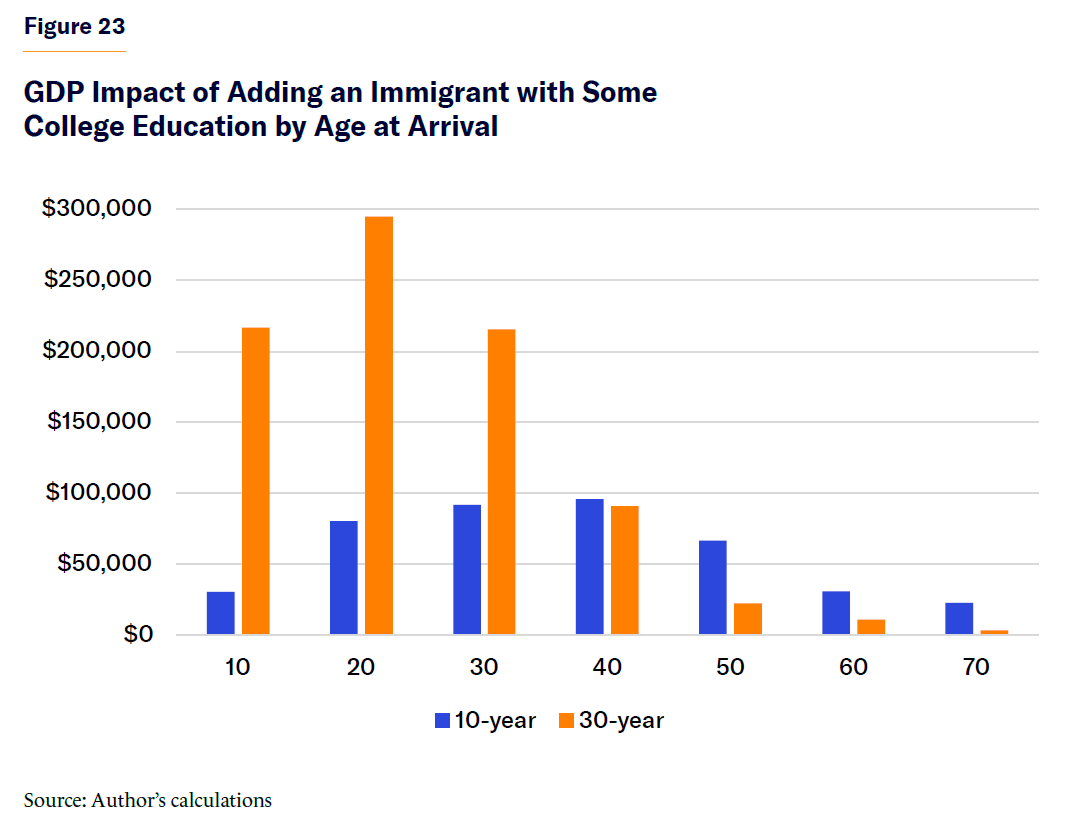
As for economic impact, immigrant children have no impact until some of them begin working at the age of 15 (Figure 23); younger immigrants’ impact rises over time while older immigrants’ impact falls as they reach retirement. This model is a supply-driven model, not a demand-driven one. People add to the size of the economy because they work, not because they consume. Similar to the fiscal impact, economic or GDP impact is most positive for working-age immigrants, and the immigrant group with the most favorable economic impact changes significantly between the 10- and 30-year budget windows. While young immigrants provide little benefit over 10 years (less than immigrants who are 50 or even 60 at arrival), they provide 10 to 20 times more economic activity over 30 years than 50- or 60-year-old immigrants, highlighting the benefits of young immigrants for the U.S. economy.
Part 3: Full Results
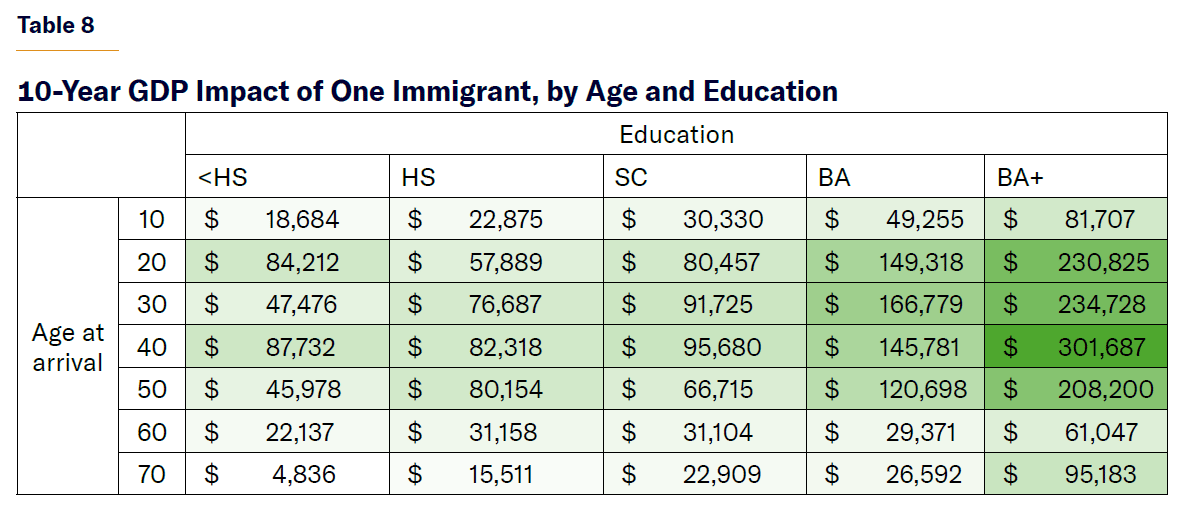
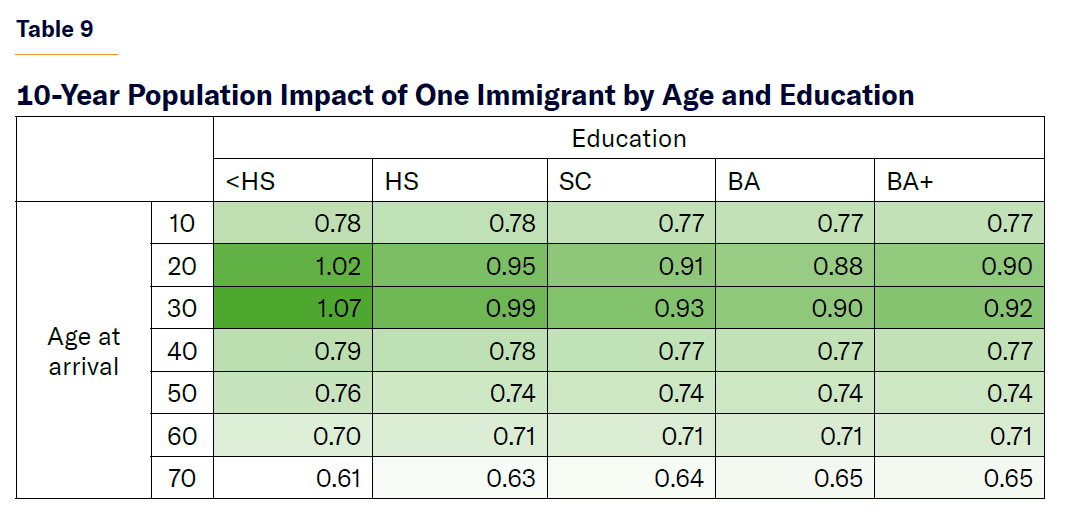
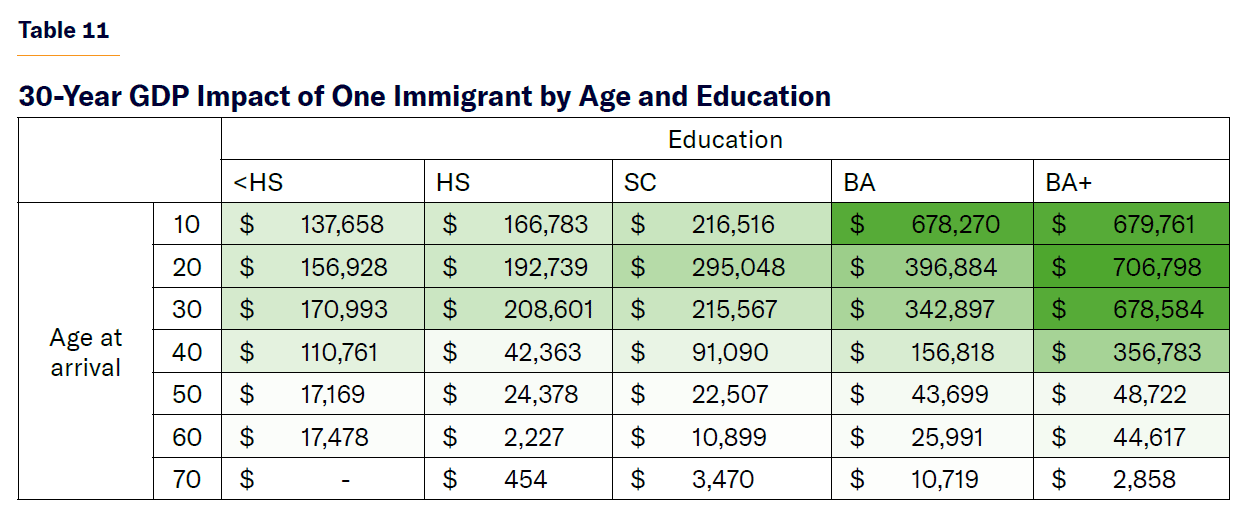
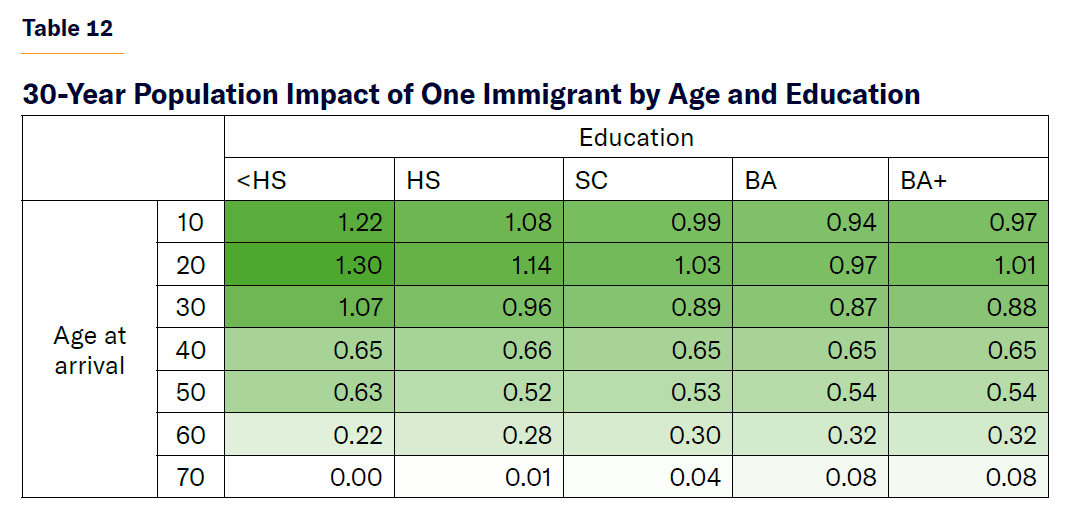
Table 7 lists the cumulative net fiscal impact (individual immigrant impact plus that of their descendants) of adding one immigrant today from every possible age at arrival and educational attainment group. Tables 8 and 9 describe an immigrant’s impact on GDP and the population, respectively, all within the 10-year budget window. Tables 10, 11, and 12 show the same facts but for the 30-year window.
The impact of a one-time admission of an immigrant differs from a perpetual increase in immigration. Tables 13 through 18 show the same impacts on the debt, GDP, and population over the 10- and 30-year time frames of admitting a new immigrant of each education/age-at-arrival group every single year for 10 or 30 years.
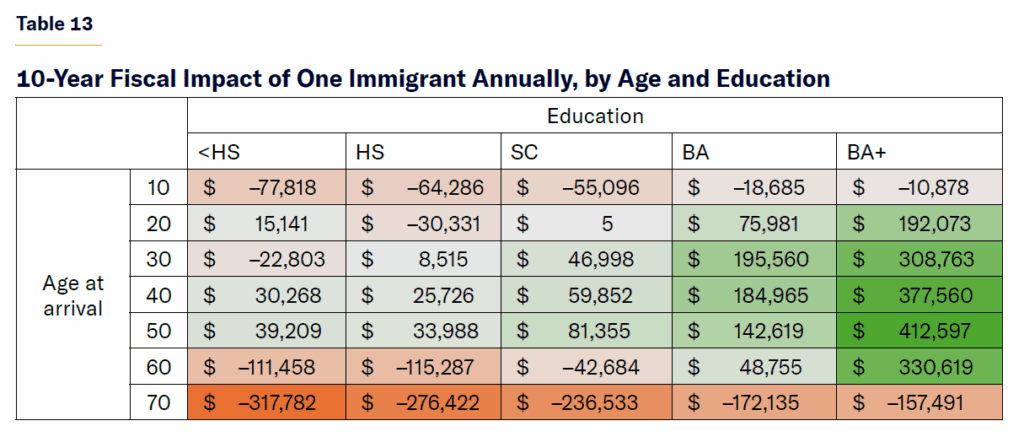
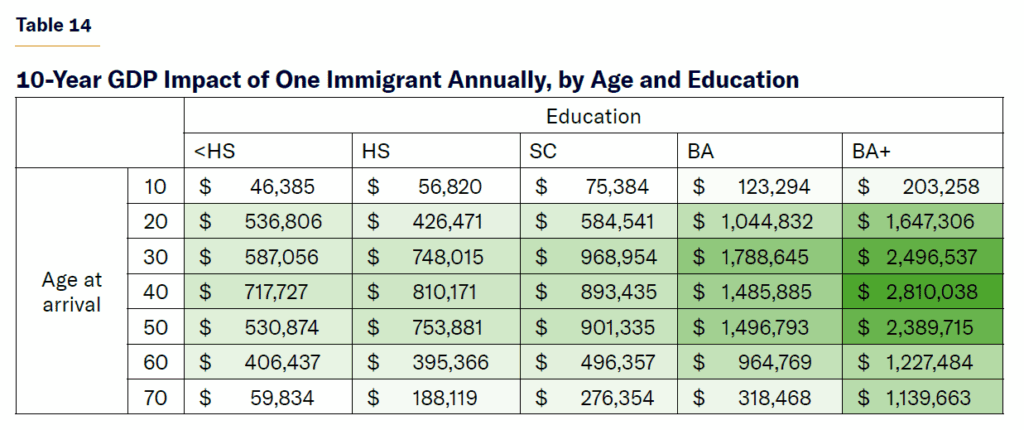
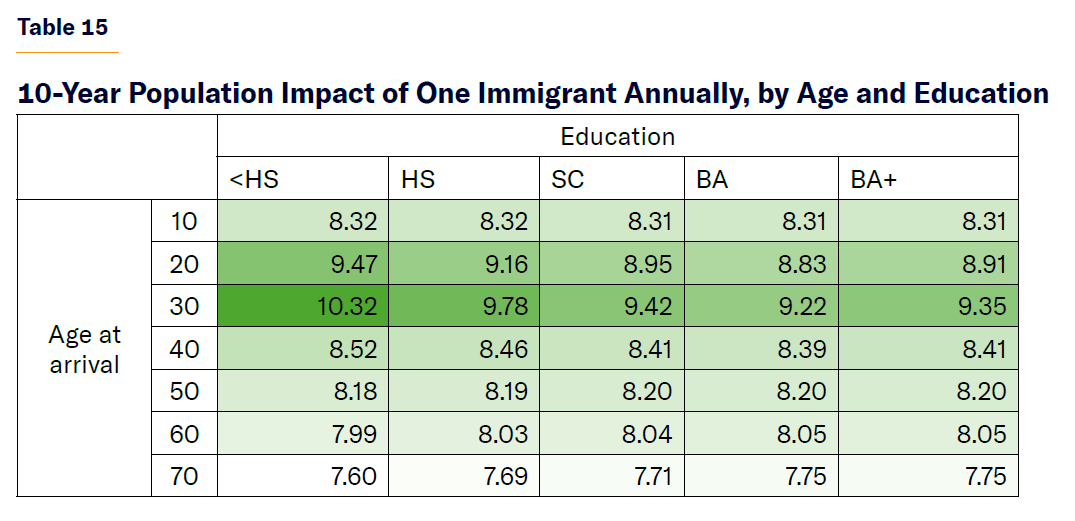
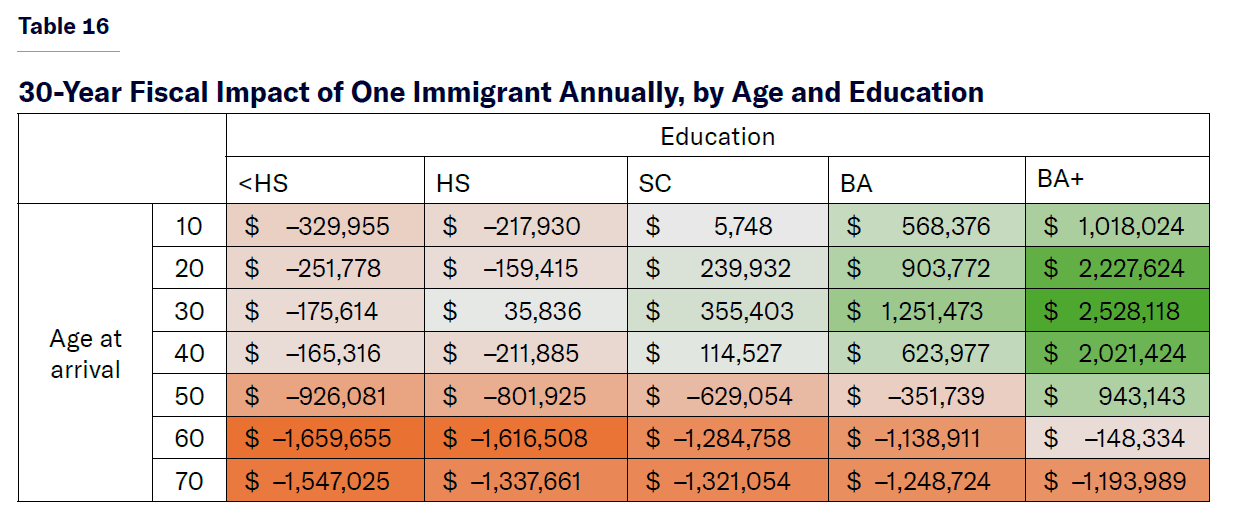
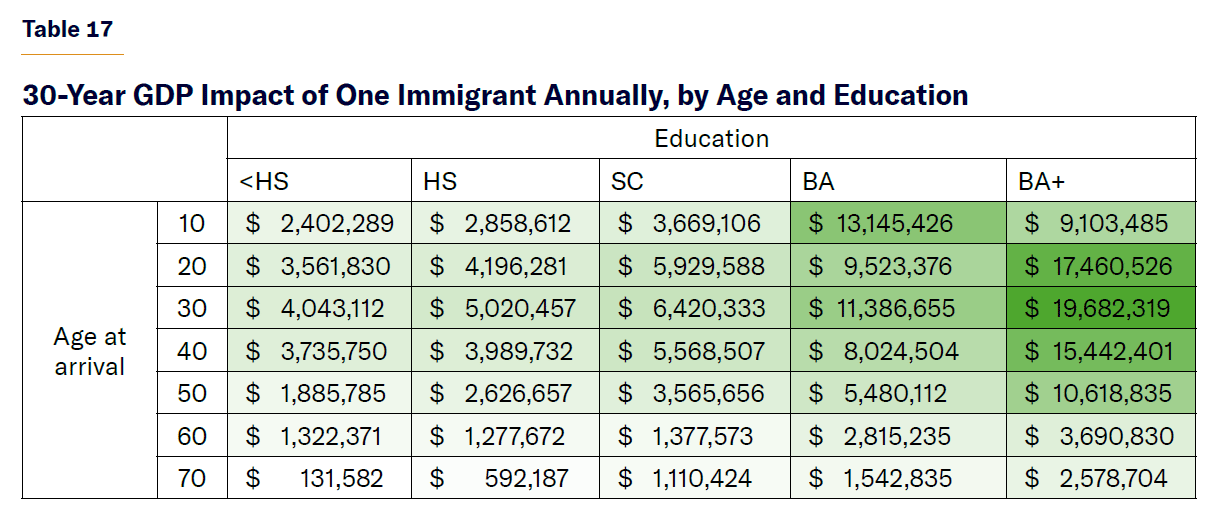
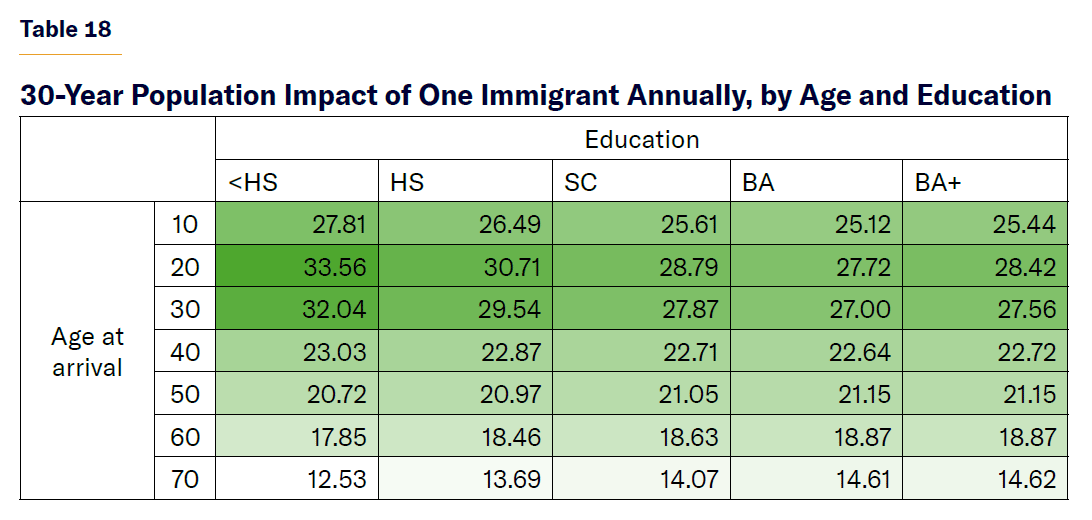
These tables allow us to calculate the impact of changing immigration policy with one-off policies like deportations, amnesty, and green-card recapture; or with perpetual policies such as changing the number of visas issued or a change in the amount of illegal immigration.
Economic and Fiscal Impact by Legal Status
To calculate the impact of various immigration policies, I estimate the share of immigrants in each legal status category by age and education group using Department of Homeland Security data on each immigrant category and fiscal year 2022 border crossings data to estimate the age of new unlawful immigrants.[20] A detailed table with the characteristics of each group can be found in the Appendix of this report. Using the fiscal, GDP, and population estimates above, I then estimate the impact on the debt, GDP, population, and debt-to-GDP ratio of various immigrant groups, beginning with the average immigrant overall, the average legal immigrant, and the average illegal immigrant. Figure 24 compares the 30-year fiscal impact of the average legal and unlawful immigrant.
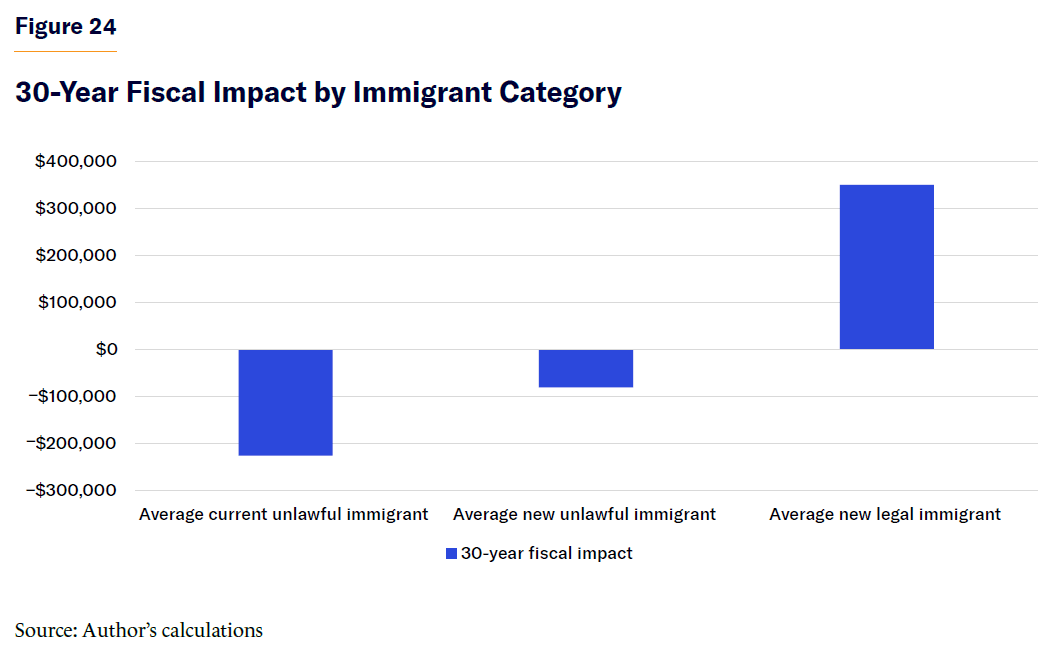
Data confirm the common intuition on legal and unlawful immigration. The average new legal immigrant will pay $350,000 more in taxes than he/she receives in government benefits, while the average new unlawful immigrant will cost the U.S. taxpayer $80,000 more than he/she will pay in taxes. Unlawful immigrants already living in the U.S. are much worse fiscally than new ones because they are older and because previous unlawful immigrants have less education than new ones. Therefore, the average unlawful immigrant residing in the U.S. will cost the federal government $225,000 more than he/she will pay in taxes over the next 30 years.
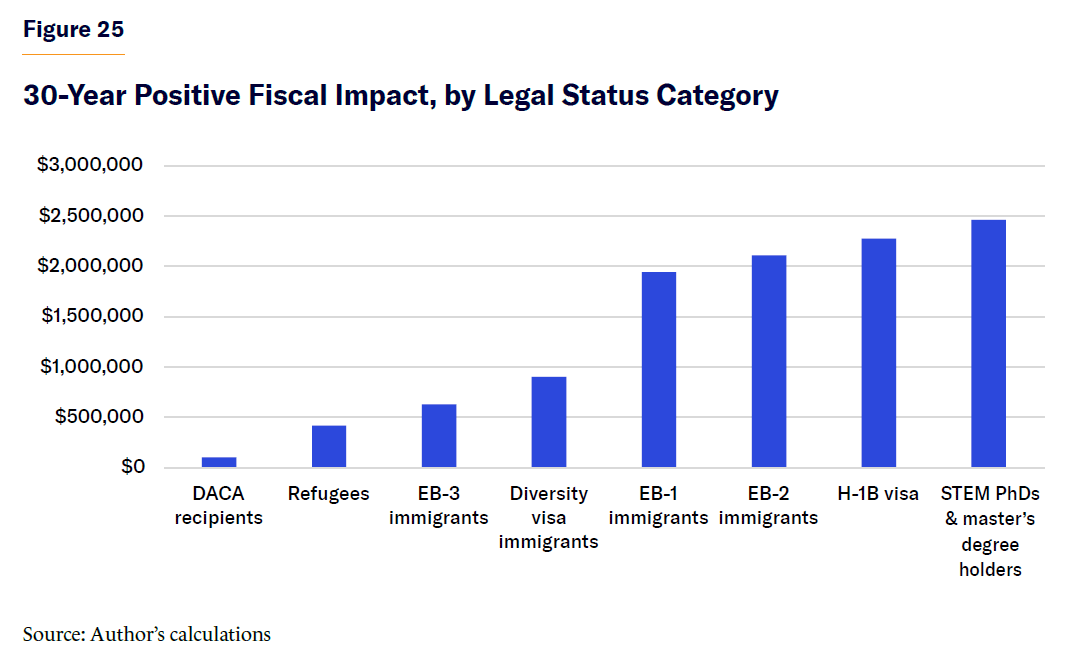
Among specific immigrant categories (Figure 25), immigrants with a STEM PhD or master’s degree are expected to benefit the federal treasury the most, by nearly $2.5 million over 30 years, followed by H-1B visa holders, who are expected to net the federal government $2.3 million in savings over 30 years. Interestingly, H-1B visa holders are expected to be more beneficial than immigrants coming in the EB-1 and EB-2 categories. This is because most EB-1 and EB-2 visa holders were previously on H-1B visas but are now older, so their expected net contributions hover around $1.9 million and $2.1 million, respectively, over 30 years. No other immigration category is nearly as beneficial. The next most beneficial group is beneficiaries of the diversity visa lottery, who are surprisingly well educated and quite young. They pay just over $900,000 more in taxes than they receive in benefits from the federal government over 30 years. Immigrants under the less skilled EB-3 immigrant visa net the government only $630,000 over 30 years, somewhat more than an average refugee, who nets the federal government $420,000 over the same period. DACA recipients are expected to cost the government over the short run (10 years) but net the federal government $100,000 over 30 years.[21]
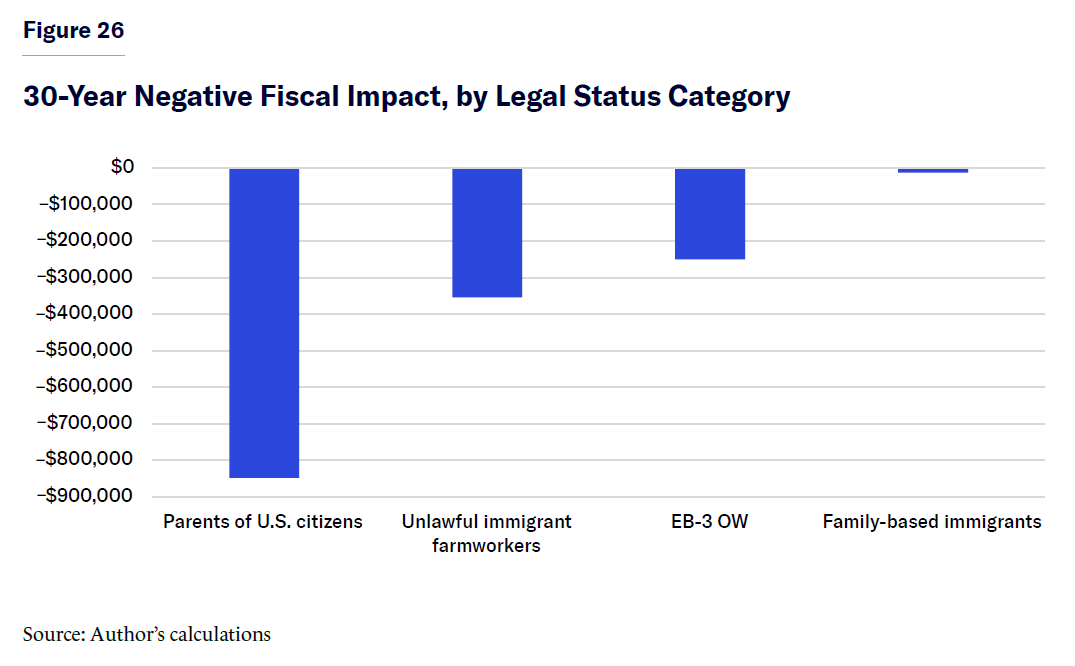
Among the fiscally negative immigrant categories (Figure 26), parents of U.S. citizens are the most notable—each of them is expected to cost taxpayers $850,000 over 30 years, much more than a less educated unlawful immigrant. Undocumented farmworkers, often the subject of much attention by lawmakers seeking to grant amnesty, are the second most fiscally negative group, costing the federal government $360,000 over 30 years. The EB-3 “Other Worker” subcategory of visas for 10,000 unskilled laborers per year is also a significant fiscal drag, with each EB-3 OW immigrant costing nearly $270,000 over 30 years. Extended family members of U.S. citizens and green-card holders—all F-1, F-2, F-3, and F-4 visa categories—cost a net $24,000 over 30 years.
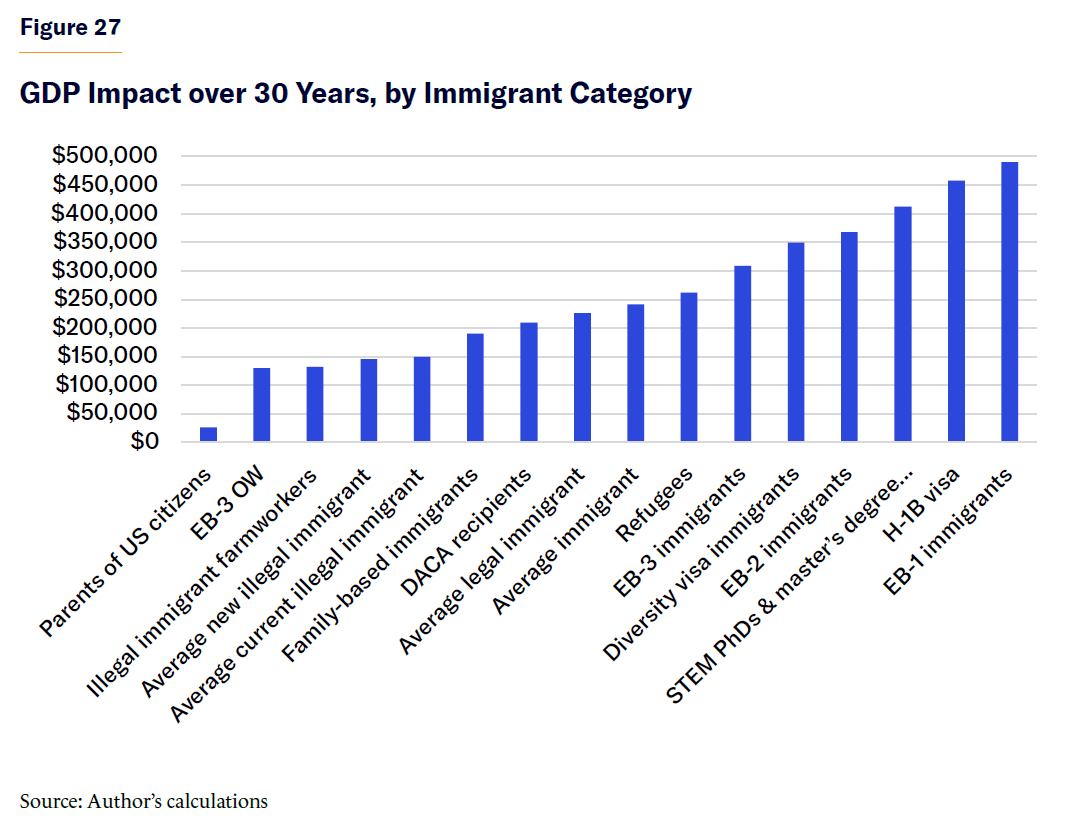
When it comes to growing the economy (GDP contribution), immigrants who tend to pay more in taxes than they receive in government benefits also tend to outperform, but not linearly (Figure 27).
EB-1 immigrants—those with extraordinary ability—grow the economy more in the long run, with each of these visas growing GDP by $500,000 by the 30th year, followed by H-1B visas at $460,000 and STEM PhDs and master’s degree holders overall at $410,000. EB-2 visas and diversity visa holders grow GDP by $370,000 and $350,000, respectively, over 30 years. On the other end of the growth spectrum, parents of U.S. citizens barely affect GDP after 30 years, boosting the economy by just $26,000 each.
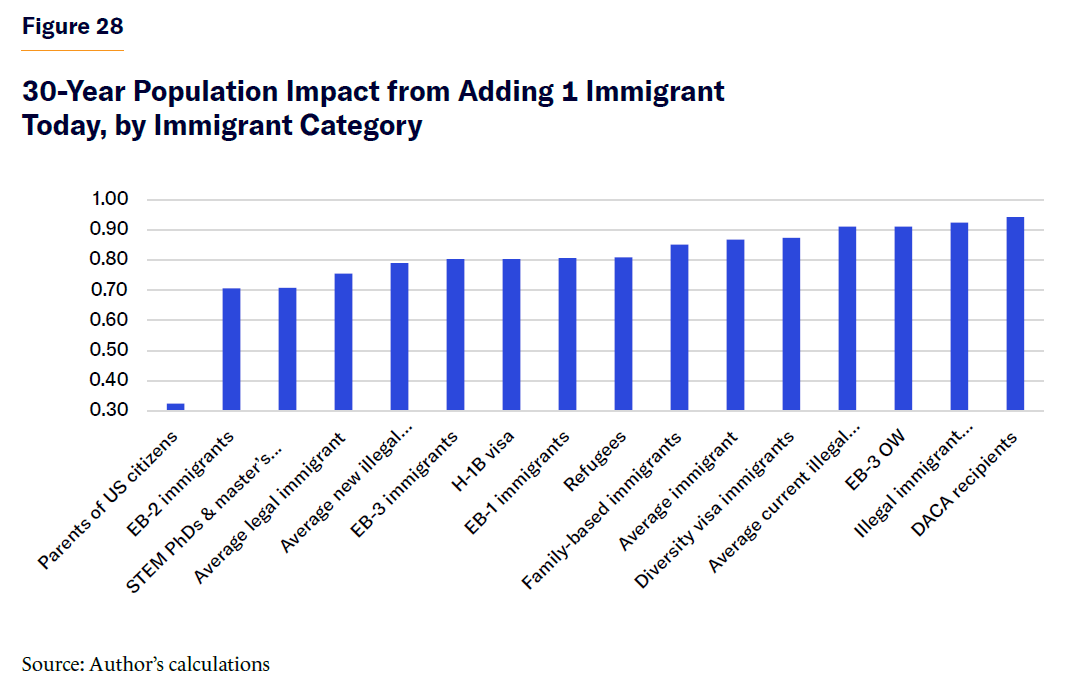
For population growth (Figure 28), parents of U.S. citizens barely grow the U.S. population because for every 10 immigrants admitted under the parent of a U.S. citizen category, only three are still living after 30 years. All other immigrant categories grow the population by 70%–95% of their original admission, depending on their age profile, which determines their mortality and fertility. Due to their young age, DACA recipients and unlawful immigrants are expected to increase the population the most, while employment-based immigrants increase population the least because of lower fertility among college-educated immigrants.
Fiscal Impact by Race and Origin
In Europe, the fiscal impact of immigrants differs greatly by country or region of origin. Immigrants from Middle Eastern, African, or Muslim-majority countries tend to have a far more negative fiscal impact than their Western or Asian counterparts.[22] However, I find that in the U.S., the gap between Middle Eastern and Western immigrants is much narrower than in Europe, and Middle Eastern immigrants tend to have a positive fiscal impact. Middle Easterners are about average when it comes to their fiscal impact—and much more positive than Latin American immigrants, especially Mexicans and Central Americans, who are the only national-origin group that has a negative fiscal impact.
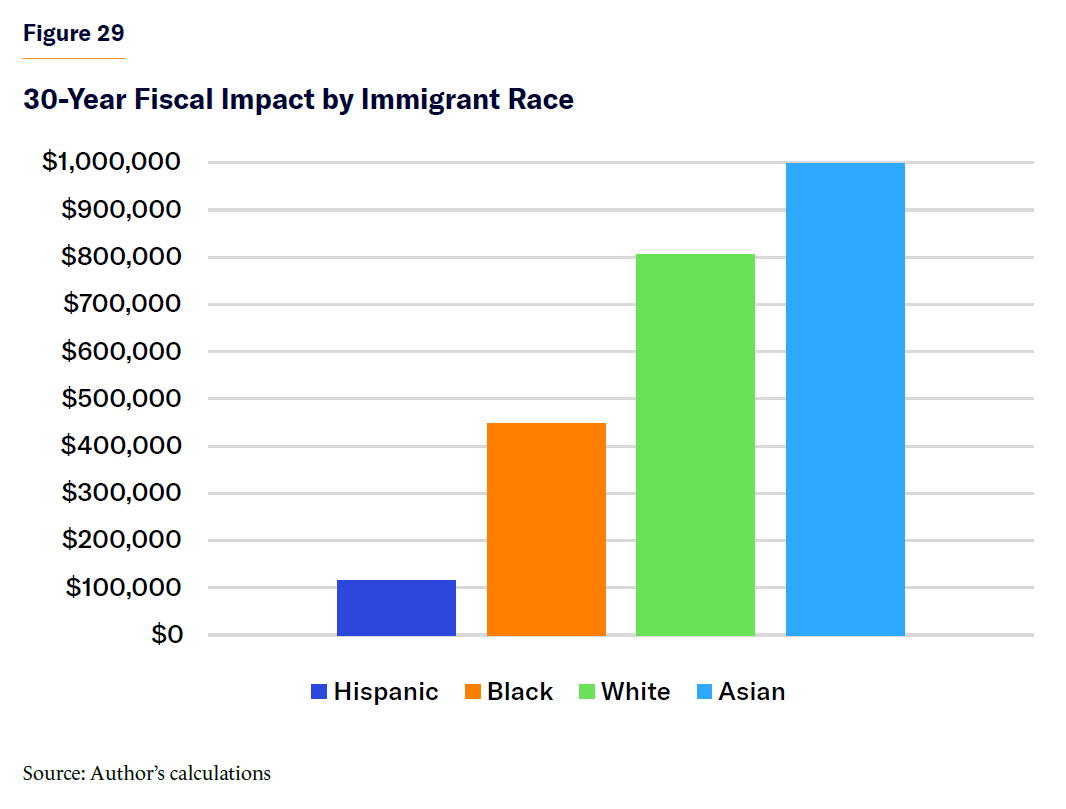
If we subdivide immigrants by self-reported race or ethnicity, based on their education and age at arrival composition, Hispanic immigrants have the least positive fiscal impact. The average Hispanic immigrant reduces the national debt by $116,000 over 30 years (Figure 29). The average black immigrant will reduce the national debt by $450,000, the average white immigrant will reduce the debt by $810,000, and the average Asian immigrant will reduce the debt by $1 million, all over 30 years. These findings reflect the fact that, despite similar ages at time of arrival, Asian immigrants tend to be very highly educated, while most Hispanic immigrants did not attend college and many entered the U.S. unlawfully.
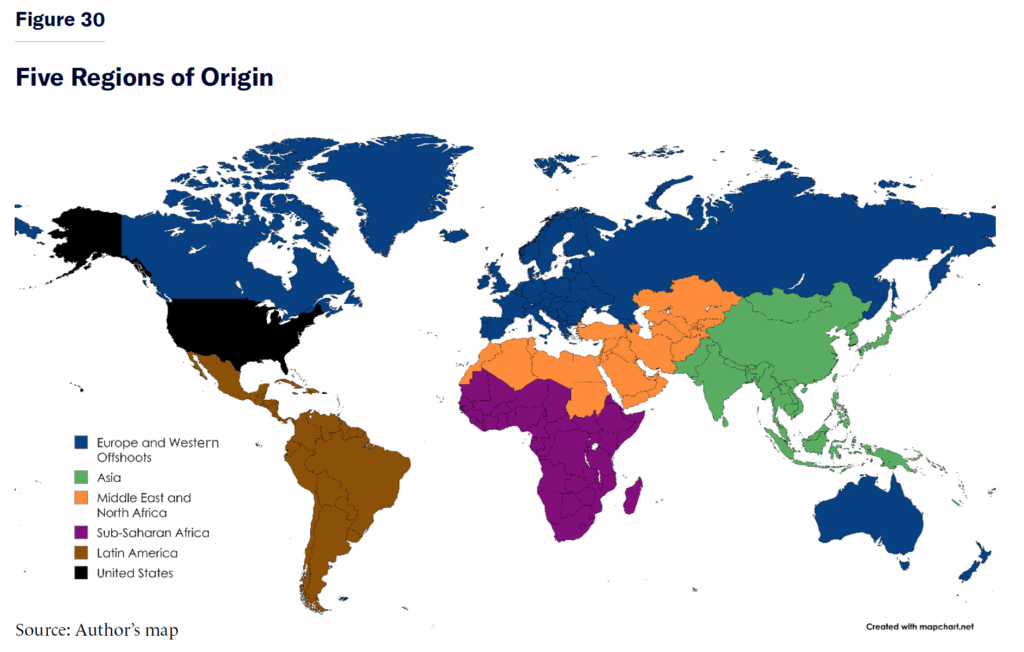
Looking at the region of origin rather than race, the fiscal picture becomes more interesting. Race does not equal region of origin, since many black immigrants are from the Caribbean region rather than Africa, and some immigrants from Africa or Latin America are white rather than black or Hispanic. Even more difficult is the issue of classifying Middle Eastern and North African immigrants. The census considers them to be white, but they self-identify in a multitude of ways and are also culturally different from the rest of Africa and Asia.
In Figure 30, I categorize countries of birth by five regions of origin: European and Western offshoots, Latin America, Sub-Saharan Africa, the Middle East and North Africa, and Asia. Figure 31 shows the average fiscal impact of immigrants of each group.
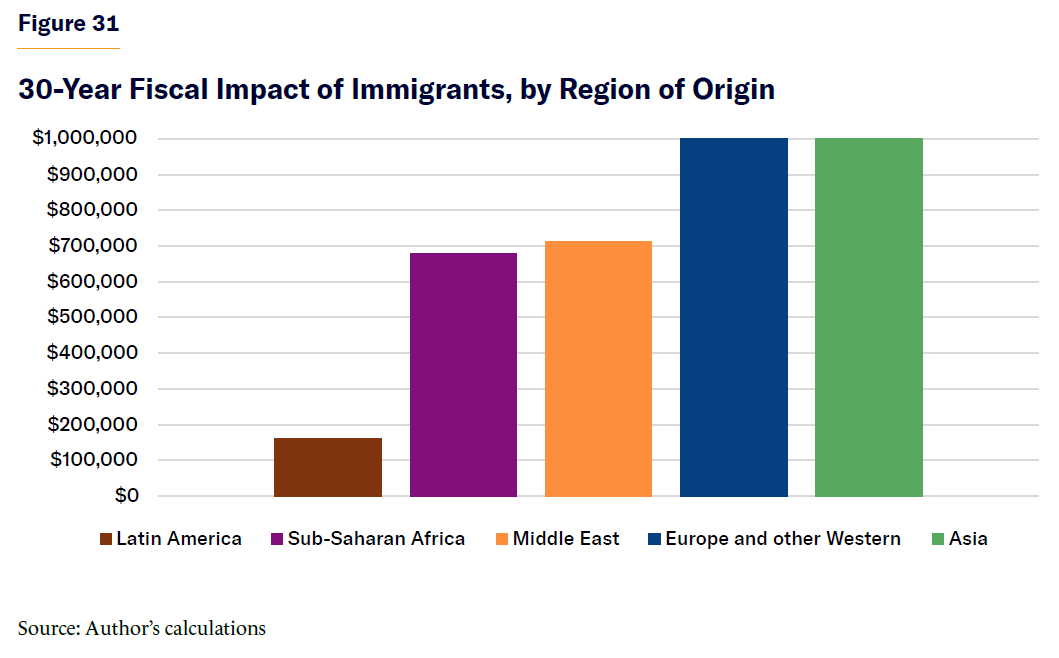
As far as regions of origin, three main groups emerge when looking at fiscal impact. On the most positive end, Asian and European immigrants generate about $1 million net positive impact over 30 years; African and Middle Eastern immigrants generate less than $700,000 net positive impact; and Latin Americans generate $150,000 net positive impact. Remember that, of immigrants to Europe, Middle Easterners and Africans have the worst fiscal impact. In the case of the U.S., that distinction belongs to immigrants from Latin America. This difference reinforces the idea that it is not the region of origin that determines immigrants’ fiscal impact but the degree of positive or negative selection among immigrants. Africans and Middle Easterners can enter Europe by boat or on foot, as Latin Americans can to the United States. But Latin Americans cannot travel easily to Europe, nor can Africans or Middle Easterners travel easily to the United States. Therefore, immigrants from Africa and the Middle East face higher barriers to entry to the U.S. and more vetting by the U.S. government and thus are more positively selected than Africans and Middle Easterners in Europe, while the opposite is true of Latin Americans.[23]
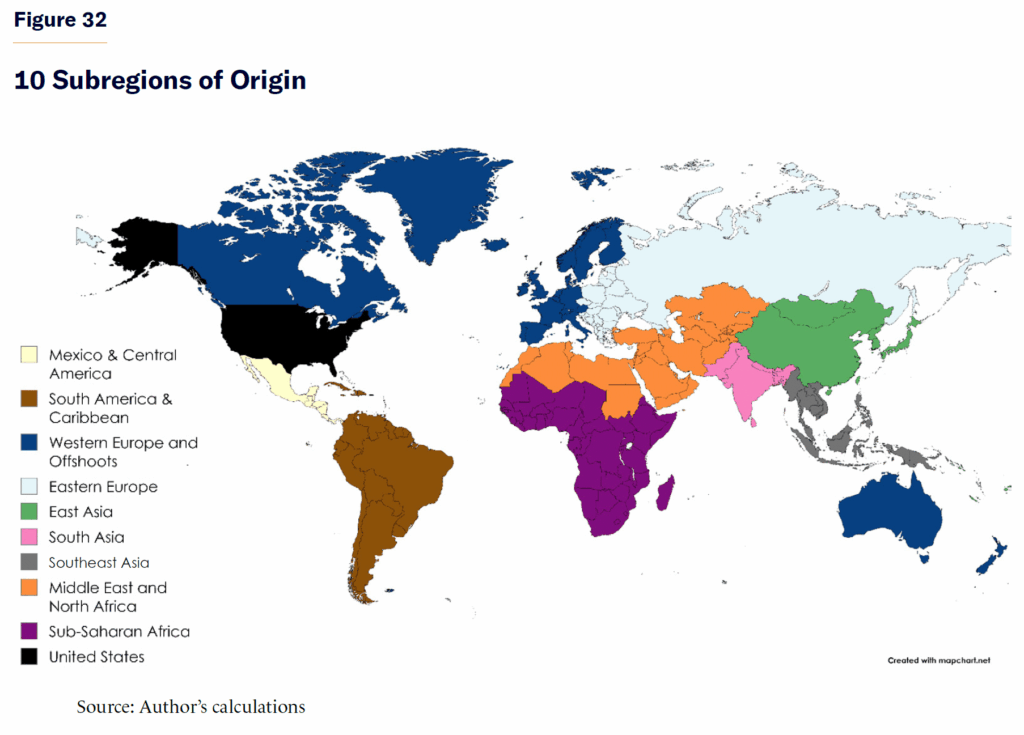
To further explore the idea of selection by region of origin, I subdivide the world into more detailed regions (Figure 32) and show the fiscal impact of an average immigrant from each subregion (Figure 33).
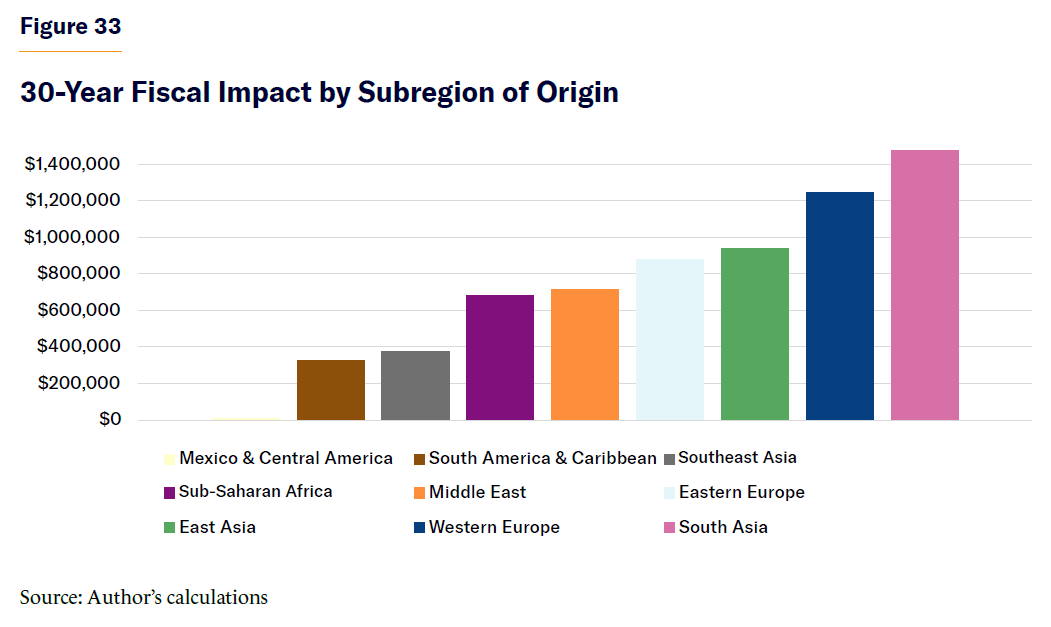
The positive fiscal impact of immigrants from both Asia and Europe is driven specifically by South Asians—predominantly Indian immigrants—and Western Europeans, rather than East Asian and Eastern European immigrants. Meanwhile, the muted fiscal impact of Latin American immigrants is driven by Mexican and Central American immigrants, while South American and Caribbean immigrants have a fiscal impact that is similar to Southeast Asians like Filipinos.
I look at the fiscal impact of the average immigrant from each of the 11 major countries of origin of the last 10 years, according to the U.S. census.[24] I show the fiscal impact among the national origin groups that have a positive fiscal impact (Figure 34) separately from those with a negative fiscal impact (Figure 35), in order to illustrate them more easily.[25]
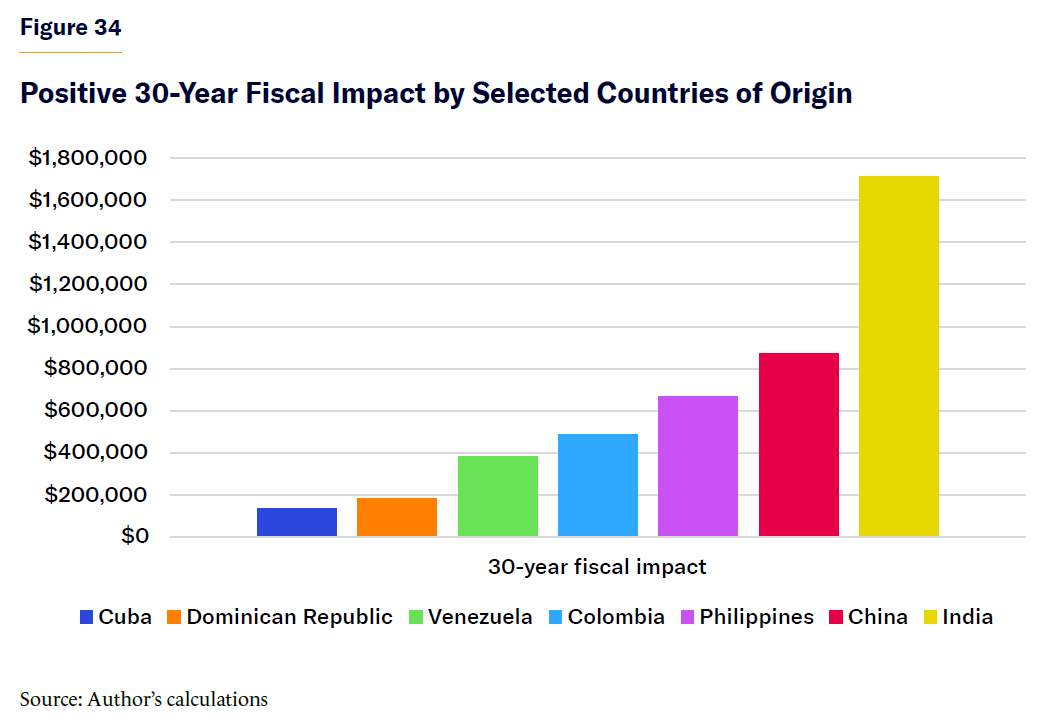
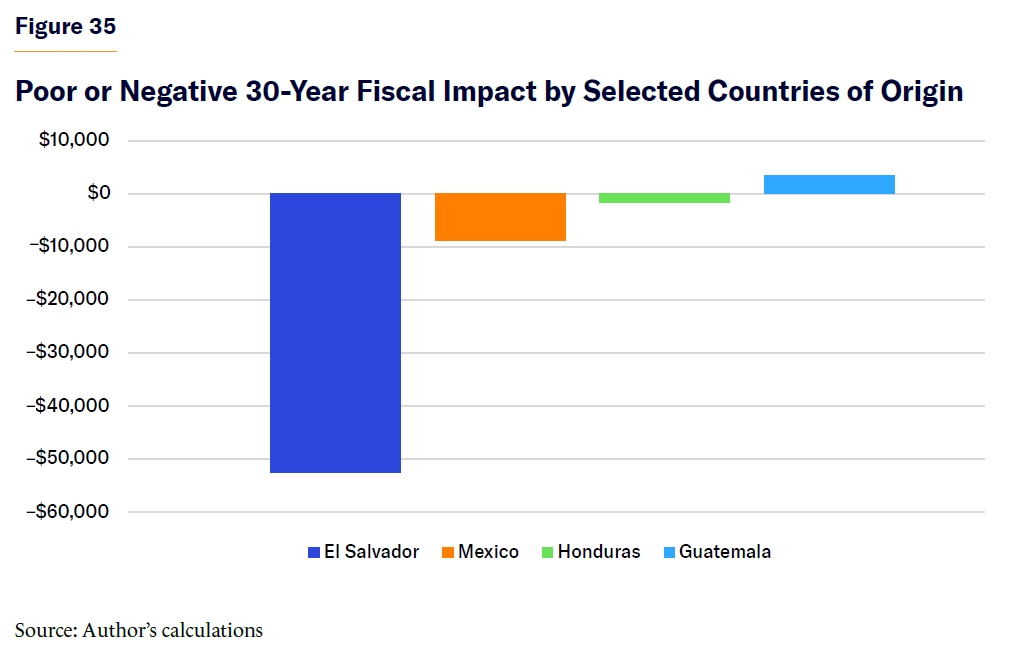
Looking at specific national origin fiscal impact estimates, it becomes clear that among large immigrant groups, Indian immigrants are the most economically beneficial immigrant group in the U.S., with an average Indian immigrant reducing the national debt by over $1.6 million over 30 years and increasing GDP more than immigrants from any other country. Behind Indian immigrants are the Chinese, who reduce the debt by over $800,000 over 30 years. Next, Filipinos reduce the debt by over $600,000. Colombians and Venezuelans reduce the debt by $500,000 and $400,000, respectively. The most fiscally burdensome immigrants are Salvadorans, who increase the national debt by over $50,000 over 30 years, followed by the largest immigrant group, Mexicans, who, on average, increase the national debt by $10,000 each over 30 years.
Part 4: Policy Simulations
In this part, I present the fiscal, economic, and population impact of major immigration reform proposals. Since we know the impact on the deficit, GDP, and population, I also calculate the impact on the debt as a share of GDP and GDP-per-capita impact of each proposal in the 10- and 30-year budget windows. I first consider policies that change the immigrant flow, such as changing immigration quotas or requiring certain conditions to immigrate. Then I consider policies that are a one-time occurrence, such as mass deportations, amnesty, or clearing green-card backlogs. Within each of these divisions, I divide policies into three categories: those that reduce or restrict immigration; those that expand or facilitate immigration; and those that make reforms that neither restrict nor expand immigration. The end of this part includes a table summarizing the impact of each of these policies.
After each individual policy is considered, I evaluate several major comprehensive immigration reform proposals. These are Senator Tom Cotton’s RAISE Act,[26] Representative Maria Elvira Salazar’s Dignity Act,[27] the Democratic immigration reform proposal called the U.S. Citizenship Act,[28] the immigration reform proposal by the libertarian Cato Institute,[29] and the reform proposal by the progressive Center for American Progress.[30] In Part 5, I showcase my own proposed immigration reform framework that I call the “Manhattan Institute Immigration Reform.”
Immigration-Flow Restrictions
I model the impact of the following policies, which decrease legal immigration every year:
Ending the diversity visa lottery, resulting in 55,000 fewer diversity visas annually
Ending the green-card category for parents of U.S. citizens, reducing immigration by about 150,000 people annually for those in their fifties and sixties
Ending “chain migration,” which I define as all nonimmediate relative visas, capped at 226,000 annually, which includes visas for adult children of U.S. citizens, siblings of U.S. citizens, and children and spouses of green-card holders
Capping refugee resettlement at 50,000 annually versus the historical average of 75,000 per year, reducing the net number of refugees by 25,000 annually
Requiring a high school diploma and minimum English proficiency to receive a green card for the extended family of U.S. citizens who are not minor children
Ending the H-1B visa program
Implementing a full moratorium of all legal immigration, reducing net migration by about 1 million annually
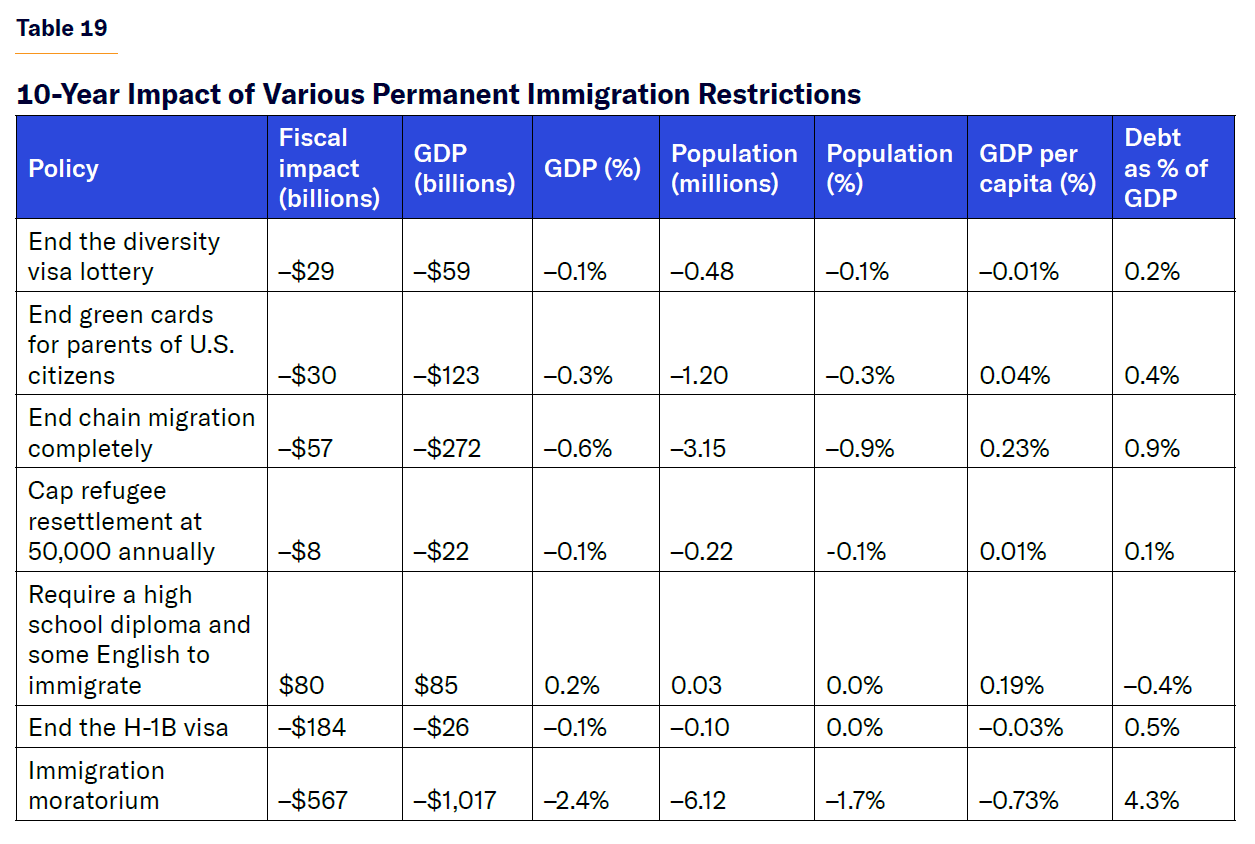
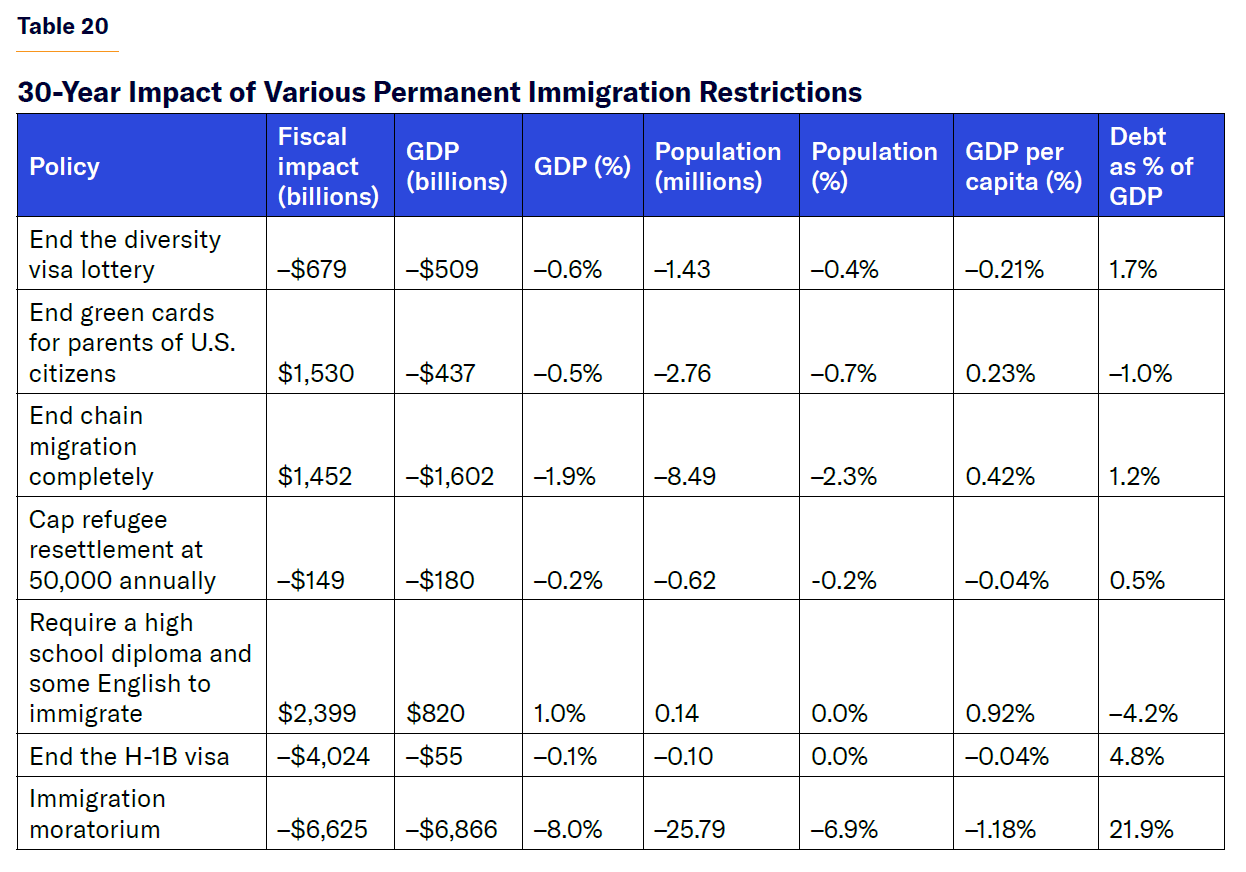
When it comes to major, permanent legal immigration restrictions, requiring a high school diploma and some English to immigrate and ending green cards for parents of U.S. citizens will reduce the debt-to-GDP ratio over 30 years. Minimum education and English requirements for immigrants would not affect refugees who come for humanitarian reasons or employment-based immigrants who already speak English and are overwhelmingly college-educated. This targeted policy would affect more than 200,000 legal immigrants annually and delay immigration for family members of Americans who do not meet the requirements. It would accelerate immigrants in the visa queue who are more educated and speak better English. This policy would reduce the debt by $80 billion over the first 10 years and by a whopping $2.4 trillion over 30 years. As the benefits compound, it would also expand the economy by $85 billion within 10 years and then by $820 billion by the 30th year of policy implementation. This combined deficit reduction and economic expansion would lead to a debt-to-GDP ratio 0.4% smaller in 10 years and 4.2% smaller in 30 years. The tremendous benefits from the policy are a result of the fact that this policy does not change immigration levels but that immigrants are more highly educated. Therefore, the total population is barely affected while the economy grows and the deficit shrinks.
Another immigration restriction that would reduce the size of the debt relative to GDP is ending the green-card category for parents of U.S. citizens. Even though this policy would reduce immigrant admissions by an estimated 150,000 per year, these are mostly 60-year-olds without college degrees, so the debt would increase by $30 billion in the first 10 years of the policy and then fall by $1.5 trillion by the 30th year of implementation. Even though this policy would reduce the size of the economy by some $437 billion by the 30th year, the even larger deficit reduction would result in a 1% smaller debt-to-GDP ratio.
Ending chain migration would also reduce the nominal size of the debt over the long run while increasing it in the short run, but the initial economic contraction would be so large that the $1.45 trillion debt reduction over 30 years would be offset by a $1.6 trillion smaller economy, resulting in a 1.2% larger debt-to-GDP ratio.
Similarly, ending the diversity visa lottery without replacing it with another policy would expand the absolute size of the debt and reduce the size of the economy under every scenario, while capping refugee admissions would be slightly negative economically but not have much impact overall.
Another immigration restriction that has been recently suggested has been ending the H-1B visa program, which allows employers to sponsor up to 85,000 college-educated immigrants for up to six years, extendable if they are approved for a green card. This program exempts colleges and research institutions from this cap and results in approximately 120,000 new visas issued annually. Ending the H-1B visa program would expand the debt by $185 billion over 10 years while shrinking the economy by $26 billion, and it would grow the national debt by $4 trillion over 30 years and shrink the economy by $55 billion. Overall, ending the H-1B visa program would have a negligible effect on the size of the U.S. population because of the high emigration rate and low fertility among these groups of immigrants, but it would increase the debt-to-GDP ratio of the U.S. by 0.5% over 10 years and 4.8% over 30 years. This policy has the most negative consequence of any single immigration restriction because the U.S. would lose the tax revenue paid by these immigrants.
The worst immigration restriction is the most radical: a complete legal immigration moratorium. This policy would result in a U.S. with 6.1 million fewer residents by 2035 and nearly 26 million fewer people by 2055. A legal immigration moratorium would increase the national debt by $567 billion over 10 years and by over $6.6 trillion over 30 years, all while causing an 8% economic contraction, increasing the debt-to-GDP ratio by approximately 22 percentage points. An immigration moratorium would also significantly reduce GDP per capita by about 0.7% over 10 years and 1.2% over 30 years.
Immigration-Flow Expansions
This section models the impact of the following policies that increase legal immigration every year:
Classify spouses and minor children of permanent residents as immediate relatives, therefore uncapping the F2A visa category that includes more than 40,000 people waiting abroad.
Double the H-1B visa cap from 85,000 to 170,000.
End the cap on H-1B visas such that all employers could freely sponsor qualified immigrants, resulting in 254,000 additional H-1B visas annually.
End the EB-1 visa cap for immigrants with extraordinary ability, which would result in about 38,000 additional legal immigrants annually and clear the backlog of green cards for 75,000 people.
End the cap for both the EB-1 visa category for immigrants with extraordinary ability and the EB-2 National Interest Waiver (NIW) visa category for exceptionally qualified immigrants with projects determined to be in the national interest. This would result in nearly 150,000 new immigrants annually and clear the backlog of green cards for 145,000 people.
End the EB-5 visa category for immigrant investors who have invested over $1.1 million in a business and created at least 10 jobs for U.S. workers. This policy would expand investor immigration by about 2,000 people annually and clear the green-card backlog for some 30,000 investors, including their family members.
Exempt foreign graduates of U.S. STEM PhD programs from green-card caps, resulting in some 15,000 additional green cards per year.
Admit 100,000 more refugees annually.
Create a new work visa for citizens from OECD nations under the age of 35, similar to the existing E-3 visa for Australians, assuming that some 10,000 immigrants qualify annually.
End all green-card caps for all permanent visa categories, increasing immigration by 230,000 people annually and clearing the green-card backlog for more than 5 million immigrants, 4 million of whom are extended family members of U.S. citizens waiting abroad.
Implement Senator Todd Young’s Heartland Visa Act,[31] which creates a new work visa for 50,000 college-educated professionals in underpopulated or depressed counties.
Implement the STAPLE Act,[32] which exempts foreign graduates of U.S. STEM PhD programs from both green-card and H-1B visa caps, increasing H-1B visa issuance by about 2,600 and EB-1 and EB-2 green-card issuance by nearly 15,000 annually, and grant green cards to more than 4,000 backlogged immigrants in the EB-1 and EB-2 categories.
Implement the Keep STEM Talent Act[33] by Senators Mike Rounds (R-SD) and Richard Durbin (D-IL), which would exempt foreign graduates of U.S. STEM PhD and master’s degree programs from both the H-1B and green-card caps. This policy would increase H-1B visa issuance by about 27,000 and EB-1 and EB-2 green-card issuance by nearly 70,000 annually, and would grant green cards to more than 40,000 backlogged immigrants in the EB-1 and EB-2 categories.
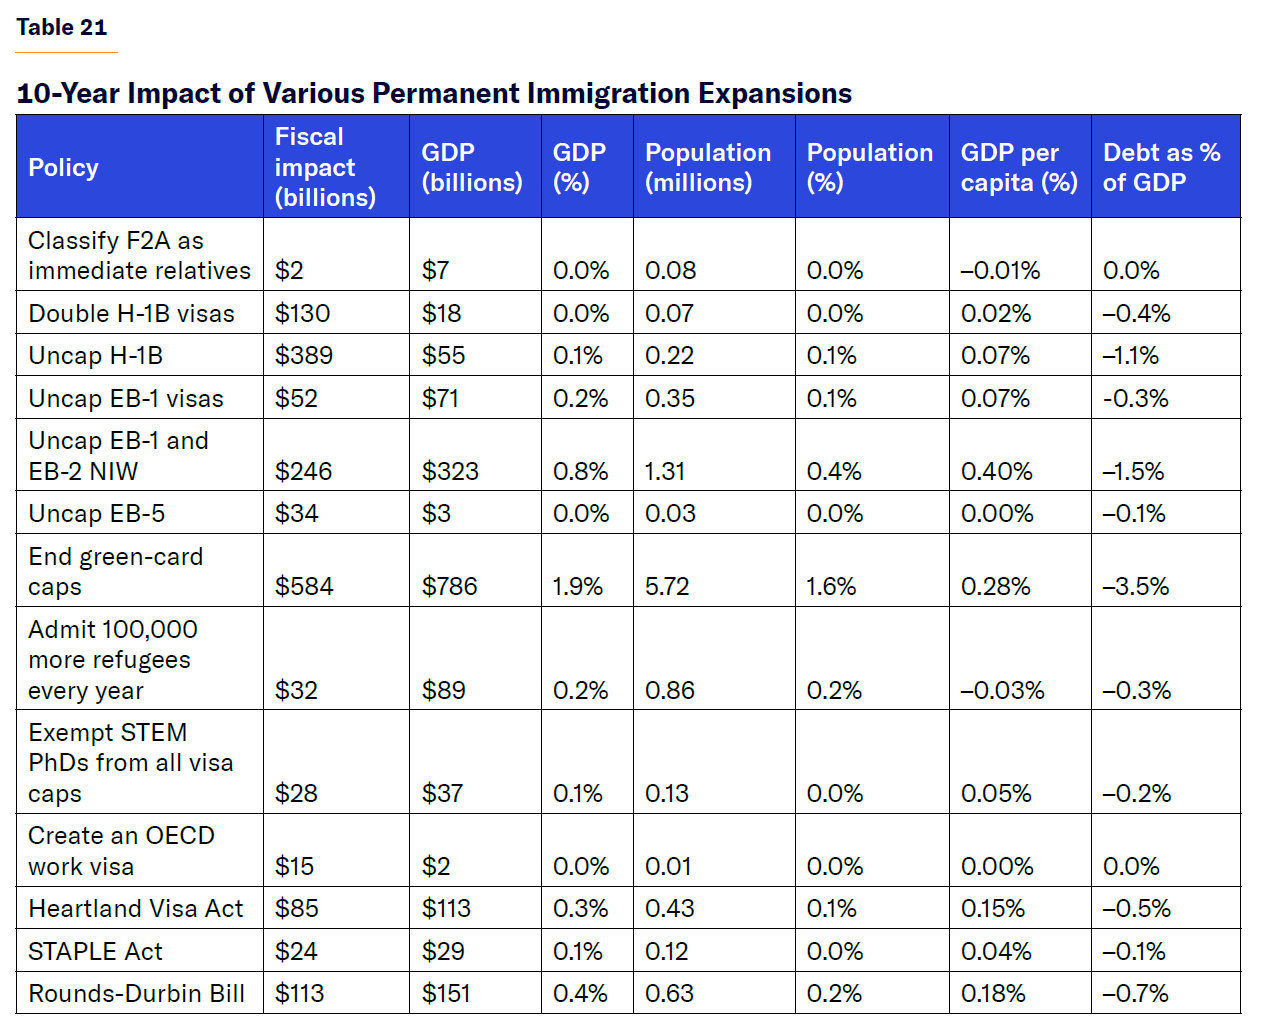
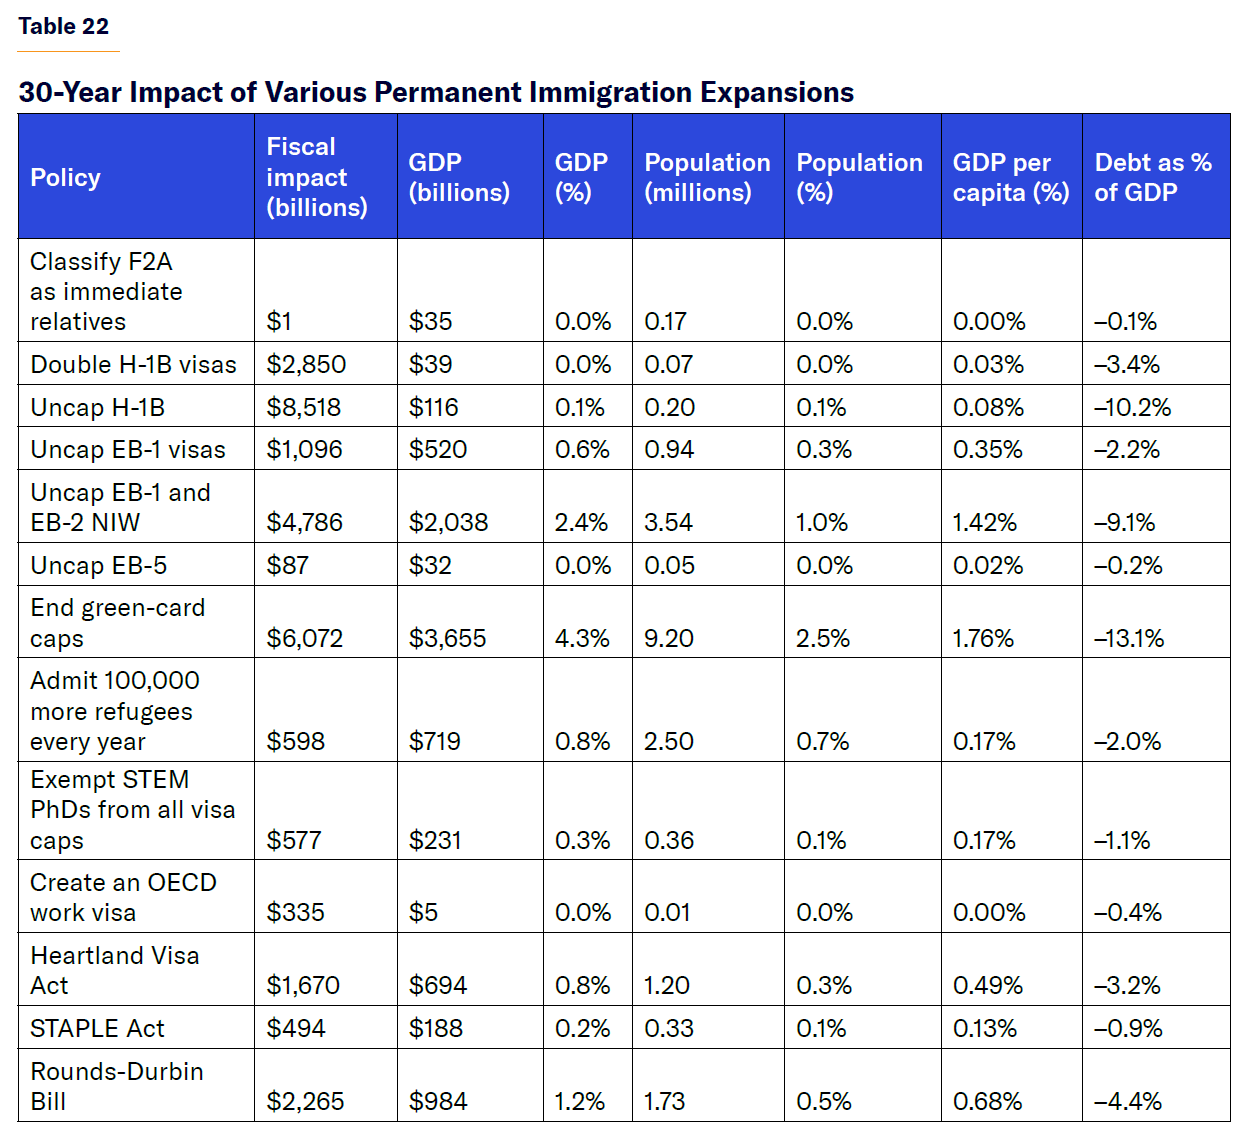
All legal immigration-flow expansions would reduce the debt, expand the economy, and reduce the debt-to-GDP ratio, though some would, in the short run, reduce GDP per capita due to the composition of the population. But not all legal immigration expansions are created equal. Although doubling the H-1B visa cap would increase the U.S. population by only 70,000 over 10 years and reduce the debt by $130 billion, admitting 100,000 more refugees annually would increase the U.S. population by 860,000 people and reduce the debt by just $32 billion. One more H-1B visa annually reduces the debt by $1.8 million over 10 years, while each additional refugee per year reduces the debt by $37,000 over the same period.
Immigration-Flow Reforms
Now I will look at policies that do not increase or decrease the number of legal immigrants or impose new requirements on existing visas. These reforms mostly consist of shifting visa numbers from one category to another or reforming how they are granted. These policies include:
Ending per-country caps on employment-based visas: This policy would grant more green cards to backlogged immigrants from India, which would also limit visa issuances to immigrants from countries other than India for at least 10 years. The consequence is that green-card wait times for the EB-2 and EB-3 categories for new Indian applicants would fall from over 100 years to over 30 years, and they would rise from two years to 30 years for immigrants from all other countries, according to the Congressional Research Service.[34] This policy would partially clear the green-card backlog but result in fewer new employment-based immigrants every year for a net 17,000 in each of the EB-1, EB-2, and EB-3 categories, while having little effect on the EB-5 category.
H-4 work authorization: Currently, only the spouses of H-1B workers with an approved immigrant petition (form I-140)—but who are still waiting for their green card due to the backlog and who are on an H-4 visa—can apply for work authorization. This leaves the spouses of other H-1B workers and children aged 15–21 of all H-1B visa holders without work permission. This policy would grant work authorization to some 80,000 people who are overwhelmingly college-educated and often have an advanced degree.
Grant work authorization to H-4, O-3, and TD dependent visa holders: This policy would further expand work authorization to include spouses and children of high-skilled visa holders, such as O-1 visa holders and Canadians and Mexicans with college degrees and job offers under the TN visa (TN visas are nonimmigrant work visas for citizens of Canada and Mexico to work in the United States). Approximately 110,400 H-4 and TD dependents and 8,000 O-3 dependents would receive work authorization.
Grant work authorization to all work visa dependents as well as F-1 international students and F-2 dependents: This policy would grant work authorization to work visa dependents, as does the previous policy, but also to international students to work off-campus on a part-time basis during the school year and full-time during breaks. Currently, F-1 students can work only on campus and must request special permission to work off-campus. Furthermore, this policy would grant full work authorization to the spouses of F-1 students under the F-2 visa, of which there are very few because most international students are unmarried undergraduate and graduate students. But some graduate students do have F-2 spouses who are currently unable to work. This policy would result in nearly 120,000 work visa dependents being able to work and nearly 800,000 international students and dependents being able to work legally.
Auction EB-5 green cards: Instead of reviewing investor applications with a minimum $1.1 million investment threshold, this policy would auction the 9,940 EB-5 visas to the highest bidders and use the proceeds to reduce the budget deficit. Since the EB-5 program is oversubscribed and the invested dollars are not usually lost but just gain little to no income for several years, I assume that the ultimate price point from this auction would be $500,000, raising approximately $5 billion annually and doubling the positive fiscal impact of those who receive the visas, since they would be allocated to the wealthiest investors, not to those who apply first.
Allocate H-1B visas based on wage offers: Instead of randomly allocating the 85,000 available H-1B visas to for-profit companies every year, this policy would grant them to employers based on the salaries they offer, adjusting for the local cost of living and age of the applicant such that the applicants with the highest location-adjusted wage for their age bracket would receive the visa. Consequently, the median salary of a new H-1B applicant would double from about $100,000 to $200,000, since the current new H-1B median salary is $97,000 and the 75th percentile is $130,000, whereas under the wage-ranking model only the top 25% of earners will be selected and the minimum salary would be $130,000. This policy is assumed to double the positive fiscal impact of the H-1B program.
Change the green-card spillover formula as proposed by the Manhattan Institute: This policy would ensure that unused employment-based visas are available for next year’s quota and that overused visas in any category are subtracted from next year’s family-based quota, resulting in 3,100 fewer family visas and 4,500 more employment visas annually.
Shift all diversity lottery visas to the highest-skilled visa categories: This policy would eliminate the 55,000 diversity lottery visas and divide them equally to increase the EB-1 and EB-2 visa quotas from 40,040 each to 67,540.
Shift all EB-3 visas to the EB-1 and EB-2 visa categories: This policy would eliminate all 40,040 EB-3 visas for workers with an undergraduate degree or no college degree in order to give them to the EB-1 extraordinary ability and EB-2 exceptional ability and advanced degree categories. The result would be zero EB-3 visas and an increase in the EB-1 and EB-2 visa quotas from 40,040 to 60,060.
Shift only the EB-3 Other Worker visas to the EB-1 category: This is a more targeted policy that eliminates the “other worker” category within the EB-3 visa for up to 10,000 workers without any education and uses them to increase the EB-1 visa cap by 10,000.
Shift all sibling of U.S. citizen visas to the EB-1 and EB-2 visa categories: This policy would end all 65,000 visas for siblings of U.S. citizens and use them to increase the EB-1 and EB-2 visa quotas equally by 32,500 visas each, annually.
Award all family-based visas based on merit: This policy would pool all family visas other than those for spouses and minor children of green-card holders and award them every year to immigrants who score the highest in a system that awards points based on education, age, English ability, and salary offer from a U.S. employer, as well as giving additional points for having extended family who are American citizens. This would result in 138,000 fewer family visas annually but would effectively increase high-skilled immigration equivalent to those in the EB-1, EB-2, and EB-3 visa categories in equal numbers. Since these visas would be available regardless of the per-country quotas, I assume that half would go toward reducing the backlog of Indian employment-based applicants every year.
Wage-rank all EB-2 and EB-3 petitions: Rather than shifting visas between categories, this policy would switch the way new EB-2 and EB-3 petitions are granted and gives the green card to the highest-paid 80,080 applicants each year. This policy is assumed to shift all EB-3 visas to the EB-2 category.
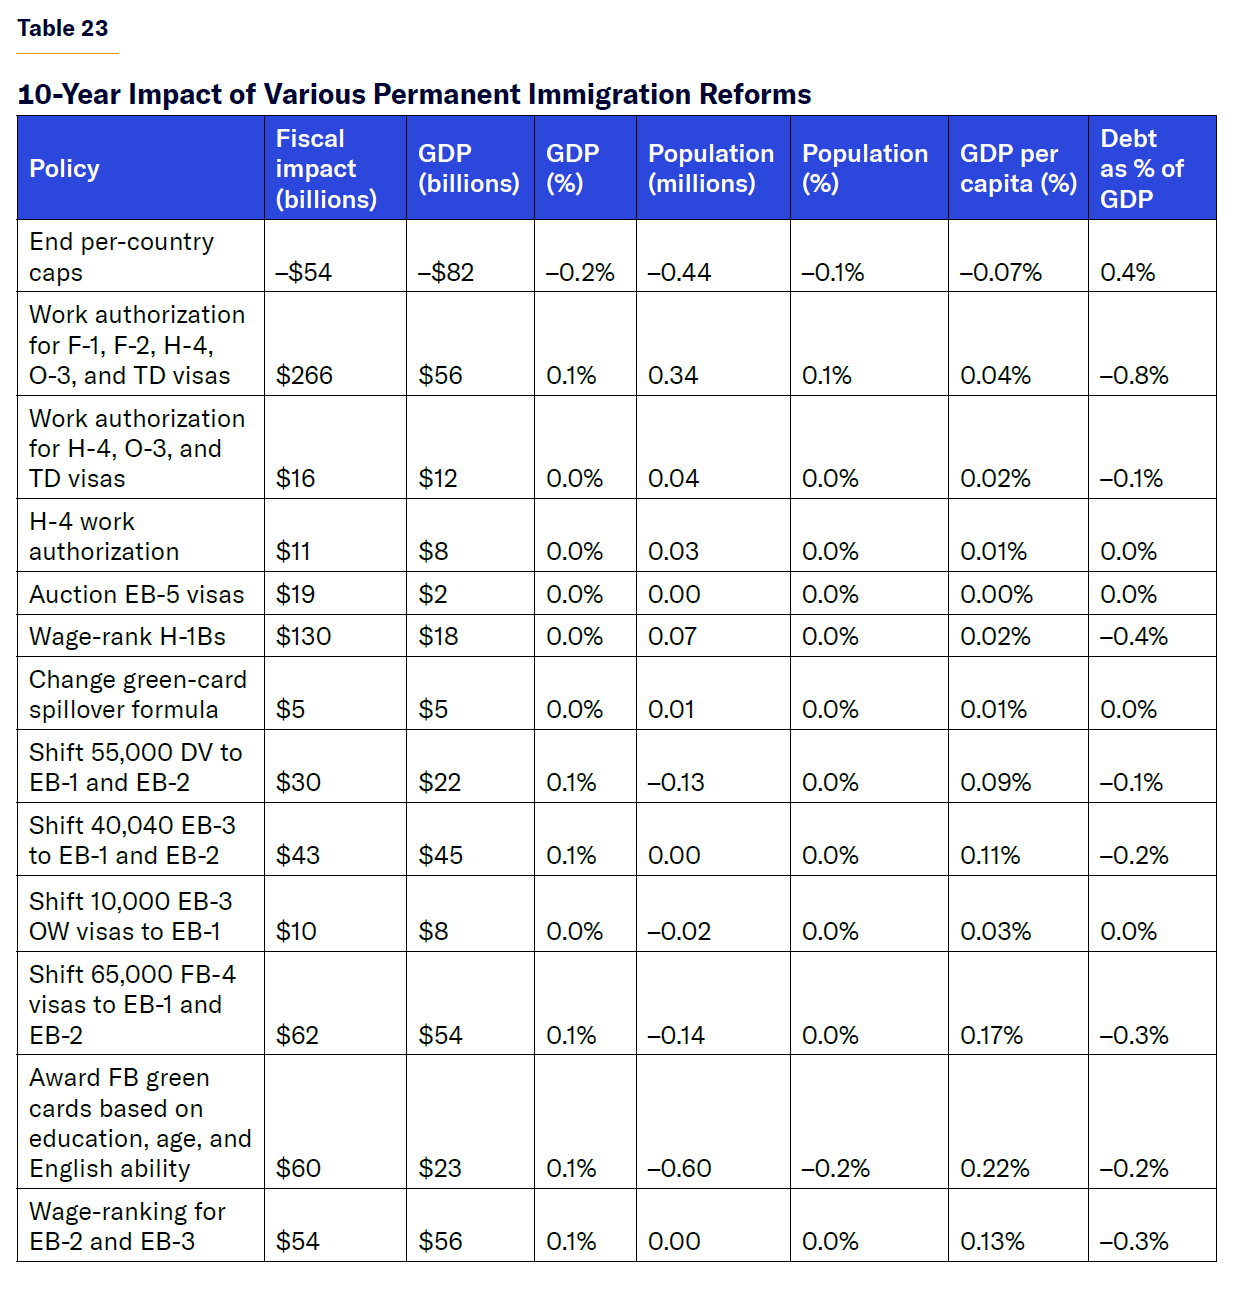
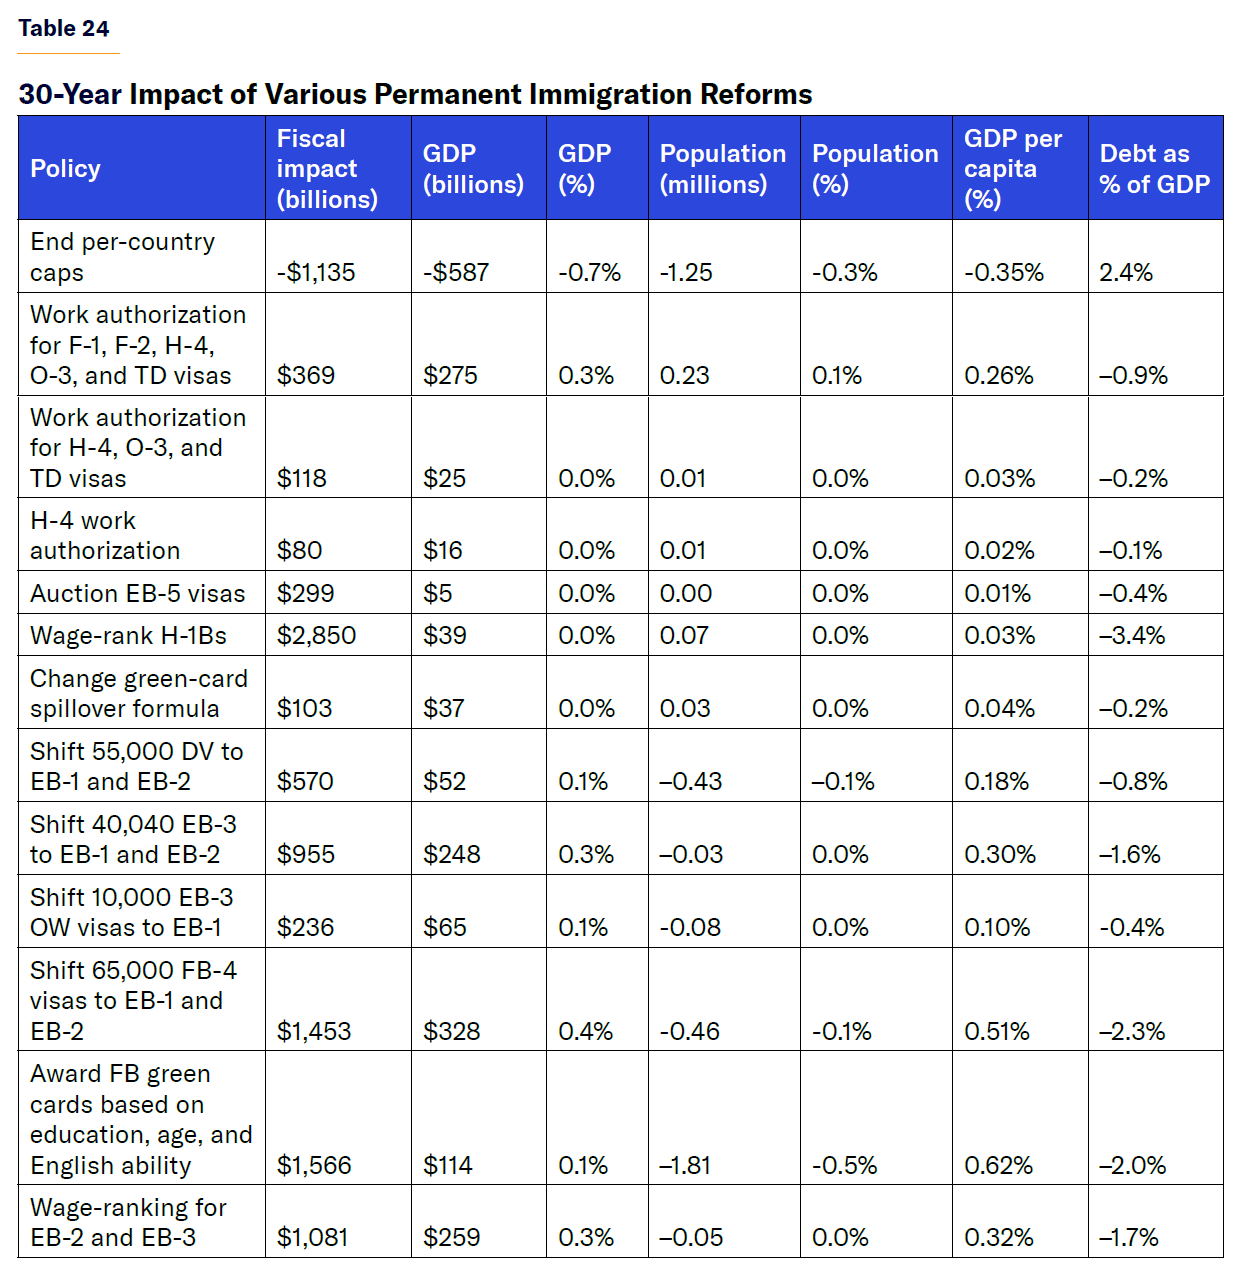
The most fiscally negative green-card category shift would be the elimination of per-country caps on employment-based green cards. This idea would have green cards granted in order of approval, regardless of country of birth, by eliminating the current provision in the law that ensures that no more than 7% of green cards go to immigrants born in any single country. The practical consequence of the current law is that Indian immigrants must wait decades for a green card while those from other countries can receive one in two years. Eliminating this provision would give more green cards to Indian immigrants, but the immigrants who would receive them are almost entirely already in the U.S., and new Indian immigrants would still have to wait over 30 years for a green card. Meanwhile, immigrants from other countries would go from waiting two years to 30 years, reducing net high-skilled immigration significantly. Overall, ending per-country caps would expand the national debt by over $1.1 trillion over 30 years and result in an economy 0.7% smaller with a debt-to-GDP ratio 2.4% larger.
On the other end of the spectrum, introducing wage-ranking for H-1B visas would be the most positive single immigration reform that does not change the flow of immigrants, reducing the federal debt by nearly $2.9 trillion over 30 years and reducing the debt-to-GDP ratio by 3.4%. This is encouraging because awarding the limited 85,000 H-1B visas by wage offer—whether pure wage-ranking or adjusted by age and/or location—has bipartisan support. After wage-ranking for H-1B visas, other solutions that introduce market incentives for green-card grants would also result in significant economic and fiscal gains for the U.S. as well as all proposals that shift family or diversity visas into the employment-based categories.
One idea that I model in this section is Trump’s “Gold Card” reform,[35] but instead of requiring a $5 million payment to receive a green card, I propose that the gold cards be created out of the EB-5 green-card category for investors; these visas would be auctioned to the highest bidder. Currently, 9,940 investors and their family members can immigrate to the U.S. each year by investing (not paying directly to the government) over $1.1 million and creating at least 10 jobs. This program’s main issue is that it takes years to review applications and grant visas—a lot of administrative burden with little government revenue. If these 9,940 visas were auctioned, I estimate that immigrants would be willing to pay approximately $500,000 for each of them, resulting in about $5 billion in direct auction revenue annually and ensuring that those admitted are those with the highest willingness and ability to pay, and are therefore even richer than those who already immigrate. This modified “Gold Card” immigration program would reduce the national debt by $20 billion over 10 years and $300 billion over 30 years.
Other ideas that do not increase immigration that would raise substantial tax revenue are those that expand work authorization for legal visa holders in the country, such as spouses and children of high-skilled immigrants. If almost all non-tourist visa holders are allowed to work, the national debt will be some $370 billion smaller over 30 years, and the economy $275 billion larger.
One-Off Immigration Expansions
Some policies do not change the immigration flow but only grant green cards in one year, such as clearing the backlog of people waiting for green cards. For example, more than 1 million people, mostly from India, are waiting for an employment-based green card in the EB-2 and EB-3 categories, and more than 4 million people from all over the world are waiting for a family-based green card. The difference between evaluating these two categories is substantial—not because of the characteristics of the immigrants but because of their location.
Immigrants waiting for an employment visa are overwhelmingly on H-1B visas in the U.S., and most of them will remain here regardless of whether they receive their green card now or in 30 years. On the other hand, prospective family immigrants must wait abroad, so granting employment-based visas reduces emigration only of the group already here, while granting family visas brings new people into the country who are not yet here. Specifically, I evaluate the following policies:
The Healthcare Workforce Resilience Act: This bill would “recapture” 40,000 employment-based green cards for physicians and nurses, 15,000 for physicians, and 25,000 for nurses in the EB-2 and EB-3 categories, respectively. Recapturing green cards is simply issuing green cards today that went unissued in past years, despite being legally authorized due to administrative inefficiency or the legislative language error in the green-card spillover formula.
Administrative green-card recapture: Many experts argue that the executive branch has the legal authority to issue green cards that have gone unused in past years, exclusively due to executive-branch errors. The number of green cards that could be administratively recaptured is 107,741 family visas and 21,159 employment visas.
AC21 recapture: This policy refers to the concept of amending the American Competitiveness Act of 2021 to recapture unused employment-based green cards, since this act was passed at the turn of the 21st century. The estimated number of green cards that would be issued is nearly 62,000.
Full EB recapture: This option would recapture all unused EB visas since the last immigration act was passed in 1990, which I calculate at 793,861 green cards by subtracting each year’s issued EB visas from that year’s cap from FY1991 to FY2023. This policy would clear the entire employment-based green-card backlog as long as the visas are issued, regardless of country of birth.
Clearing the entire family visa backlog: This policy would allow approximately 4 million approved extended family members of U.S. citizens to make appointments at U.S. consulates to receive their visas and travel to live and work in the United States.
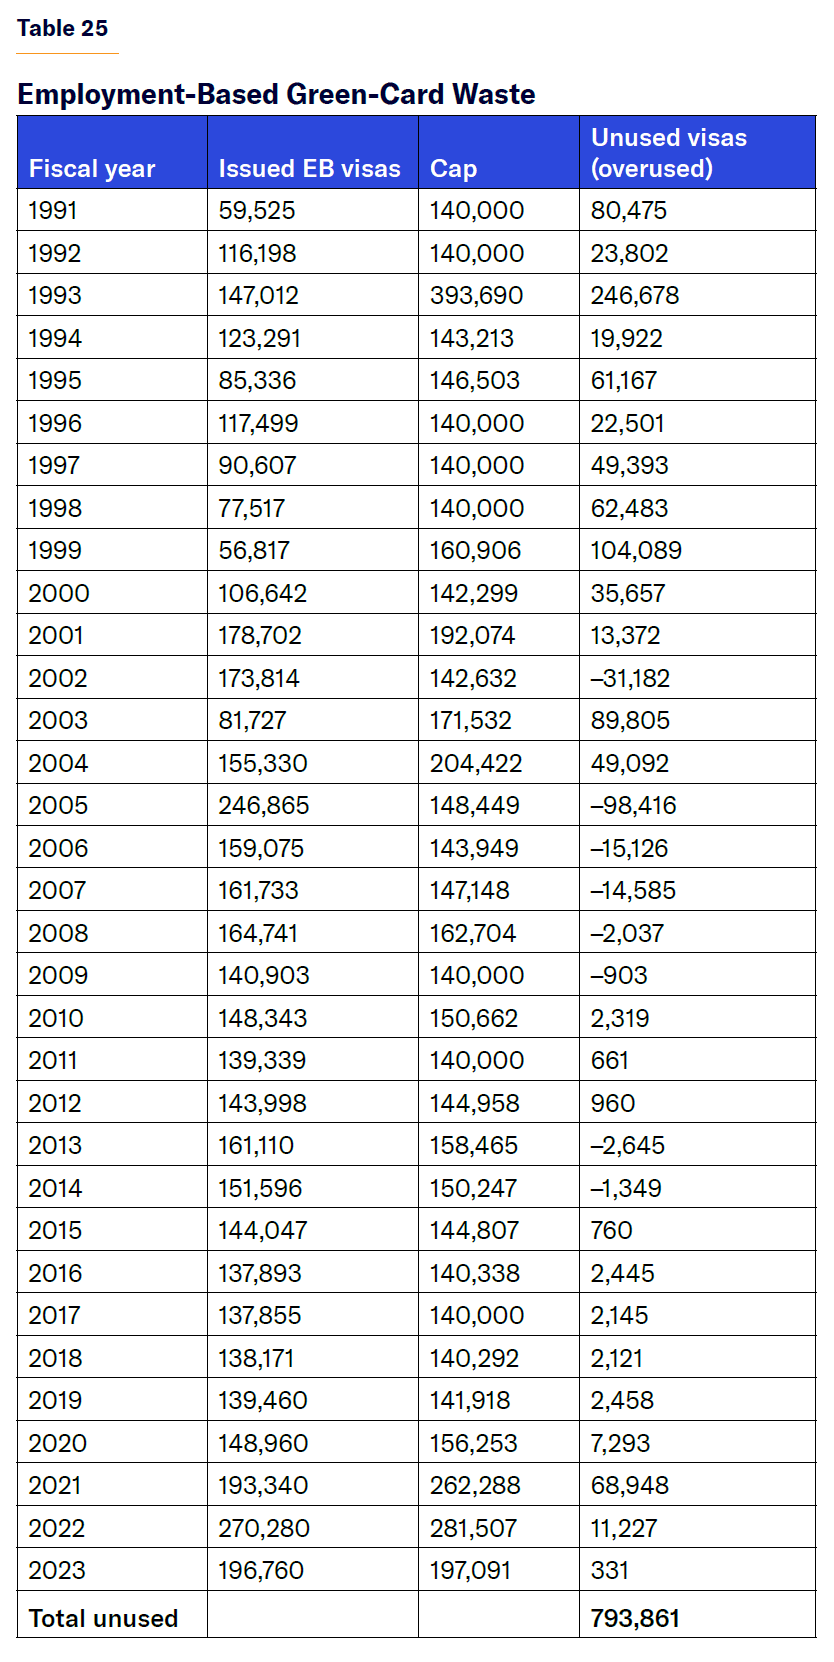
I evaluate the economic impact of the previous four policies that clear some or all of the green-card backlogs in Tables 26 and 27. To estimate the impact of granting green cards to employment-based immigrants already in the U.S. waiting for them, I assume that the policy reduces their emigration rate and is equivalent to admitting half an immigrant of their characteristics. I also assume that granting family visas brings new family immigrants but only in the first year of the policy, rather than changing the flow of immigrants permanently.
![]()
![]()
It becomes clear that the policy that would reduce the debt the most without increasing the population significantly is that of recapturing employment-based green cards. Fully recapturing all EB visas and clearing the backlog of high-skilled immigrants waiting for a green card would reduce the national debt by $172 billion over 10 years and nearly $600 billion over 30 years. It would also expand GDP by over $200 billion, increase GDP per capita by 0.21%, and reduce the debt-to-GDP ratio by over 1 percentage point in the same 30-year time frame. On the other hand, clearing the family visa backlog would actually grow the national debt over the long run because such immigrants do not tend to be highly educated and their large numbers would increase the population.
Deportations
To estimate the impact of deportations, I first estimate the cost of deporting one person. For this estimate, we will assume that “mass deportations” result in 10 million unlawful immigrants being directly deported. Deporting one unlawful immigrant would cost $12,606 per person. This includes $4,300 for arrest and apprehension, $4,828 for detention (based on an average 34-day stay at a cost of $142 per day), $1,500 for legal processing (covering immigration court proceedings, interpreters, government attorneys, and document handling), and $1,978 for physical removal. Mass deportation, in this case, would cost the federal government $126 billion over 10 years. For the sake of fiscal evaluation, I will assume that each deportation costs $12,600, and this cost is added to the net tax revenue lost, minus the net spending saved, in order to estimate the interest cost or savings from deporting an immigrant.[36]
To illustrate the fiscal impact of deporting an average illegal immigrant, I show the primary fiscal impact alongside the costs of a deportation over a 30-year period in Table 28. While in the first 10 years, it looks as though deportations will impose a net cost on the federal government of $8,400 per immigrant, deporting an average unlawful immigrant will save the federal government over $164,000 over 30 years, even after accounting for the costs of deportation. However, deporting an average unlawful immigrant would result in a smaller GDP by approximately $150,000 after 30 years. This GDP loss means that, despite the fiscal savings, the debt-to-GDP ratio would grow as a result of each regular deportation at least over the next 30 years. Beyond the 30-year period, there would be permanent savings, and the GDP loss would subside. Therefore, GDP losses are temporary while the fiscal savings are permanent.
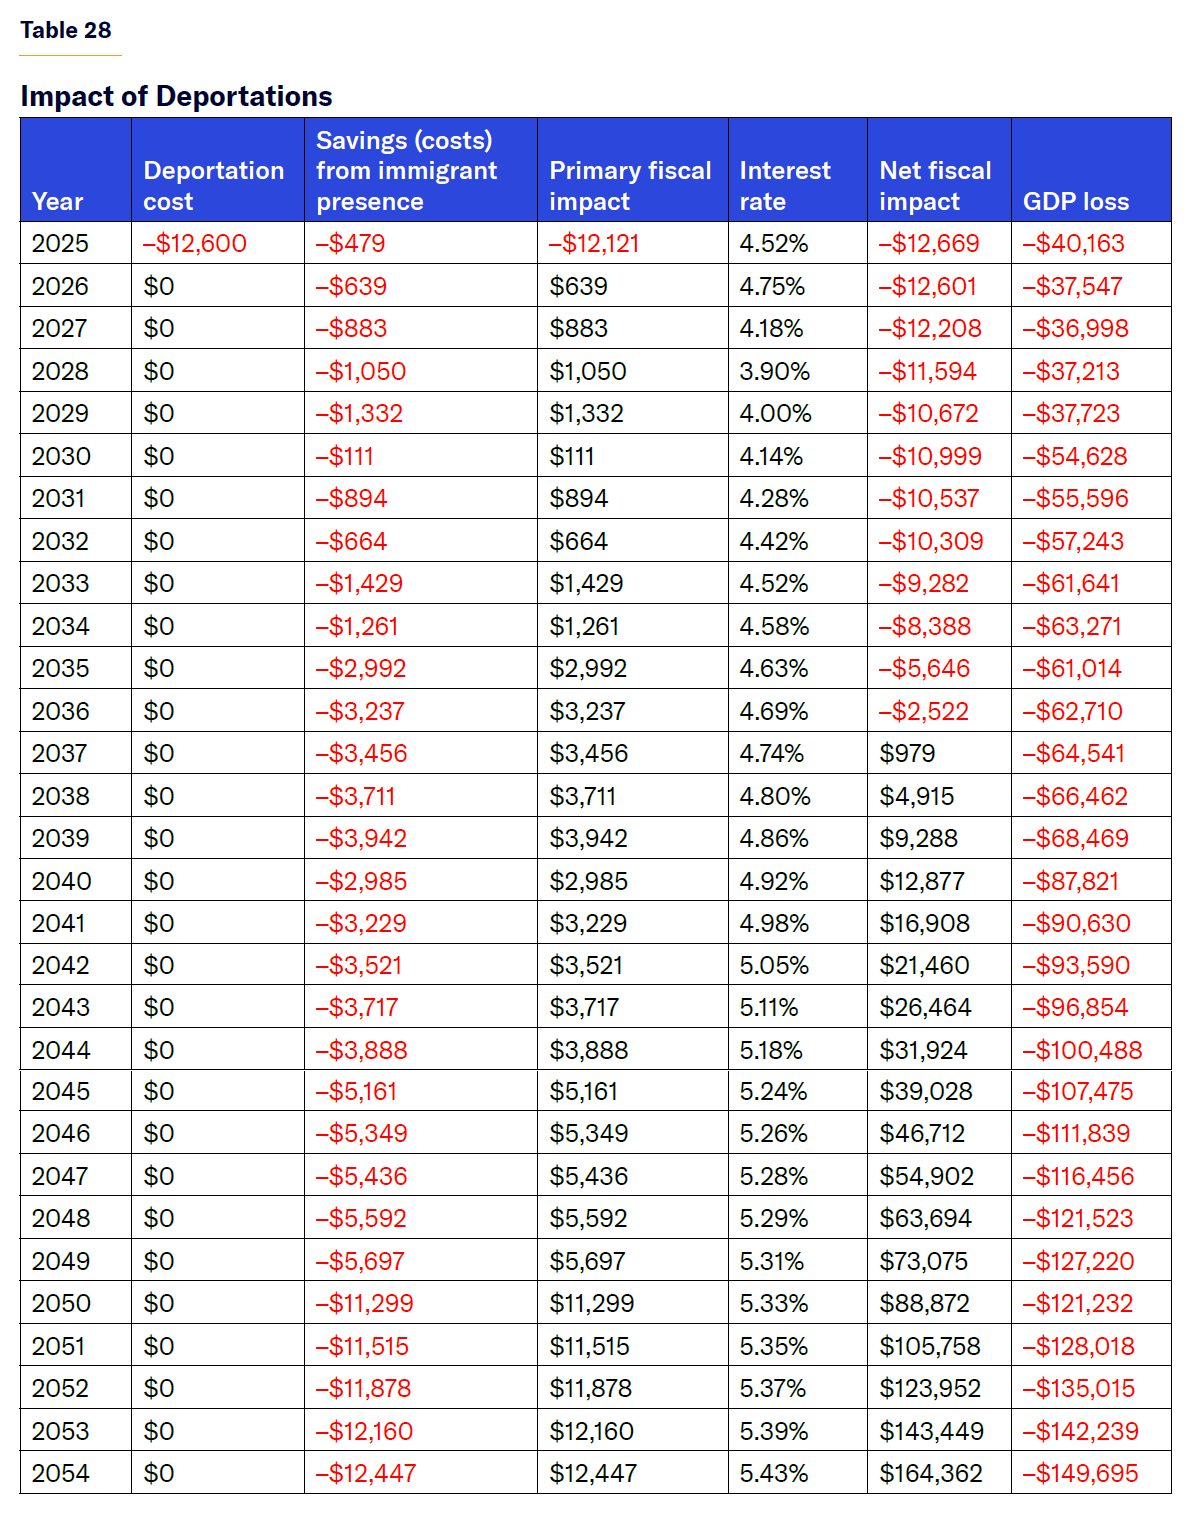
The economic consequences of deporting the average unlawful immigrant imply that mass deportations reduce the national debt over 30 years but at the cost of shrinking the economy and thus slightly raising the debt-to-GDP ratio. Over a 10-year period, deporting 5 million unlawful immigrants increases the debt by $42 billion and results in a GDP loss of $316 billion, increasing the debt-to-GDP ratio by 1%. But as more years pass and the savings from removing fiscally burdensome unlawful immigrants accumulate, a deportation program for 5 million unlawful immigrants results in a net debt reduction of $822 billion and raises the debt-to-GDP ratio by only 0.4%. If the time horizon is extended beyond 30 years to 50 years, deportations result in a lower debt-to-GDP ratio. On the other hand, if deportations go beyond 5 million and instead target 10 million unlawful residents—our definition of “mass deportation”—the national debt would be $1.6 trillion smaller after 30 years, while the debt-to-GDP ratio would rise by 0.8% due to a $1.5 trillion smaller economy.
If instead of looking at deporting the average illegal immigrant, the federal government revokes the Deferred Action for Children Arrivals (DACA) program and deports all 550,000 of the program’s enrollees, there would be a substantial cost to the federal government. Deporting all DACA recipients would increase the national debt by $29 billion over 30 years and shrink the economy by $55 billion. This is because of the higher level of education and younger age of DACA recipients, relative to other immigrants who were unlawfully present in the United States.
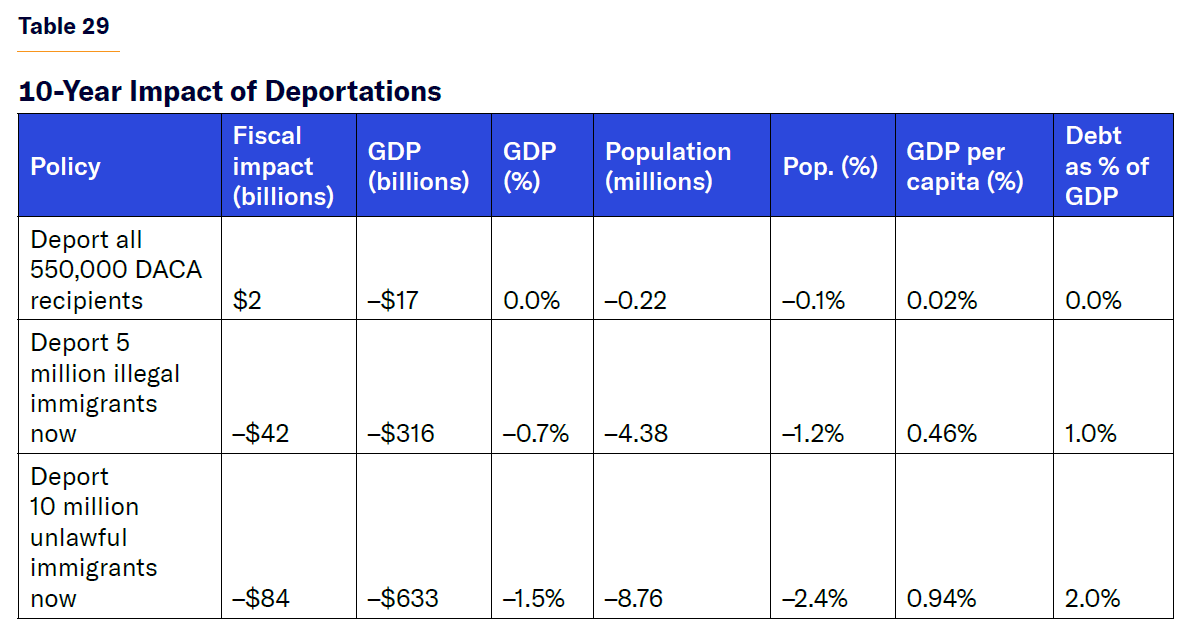
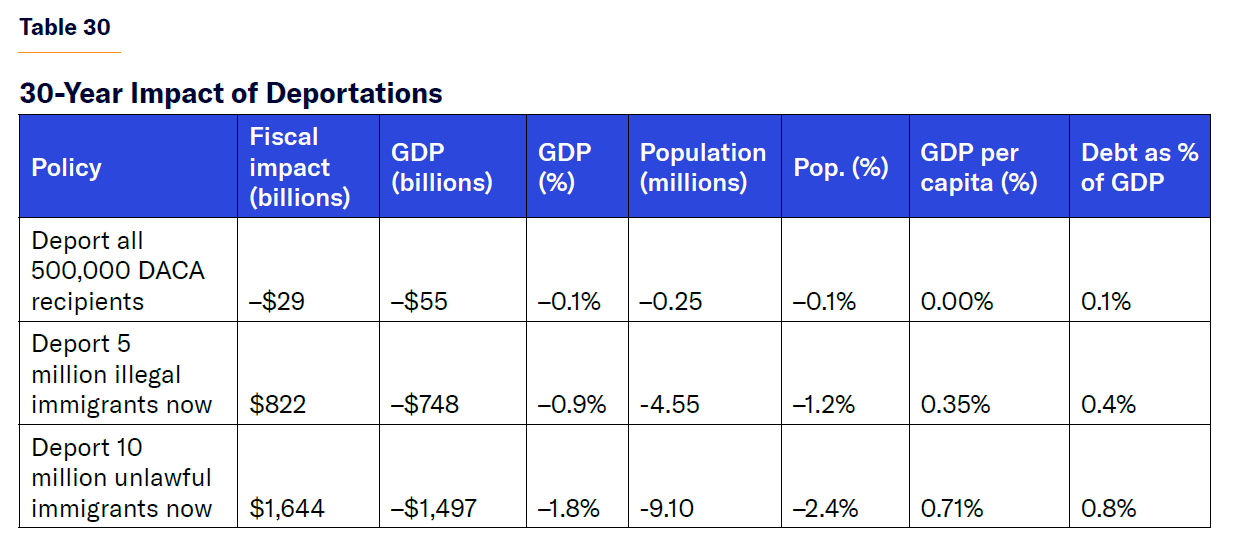
Amnesty or Legalization
Amnesty, like deportation, is always at the forefront of the policy debate. We know the likely age and education distribution of unlawful immigrants from private estimates and surveys, rather than from government data. Official data document only how much all immigrants without legal status pay in taxes and receive in benefits by education and age. This presents a methodological challenge, since a similarly educated legal immigrant of the same age is eligible for more government benefits but also earns more income because he can access better jobs by virtue of his legal status. This means that he can pay more in taxes and becomes ineligible for some means-tested welfare. The consequence is that using the data on all immigrants for illegal immigrants overstates their receipt of government benefits but also overstates their tax payments, leading to an ambiguous effect. Unlawful immigrants also obscure the true impact of other low-education legal immigrants such as family-based immigrants.
For purposes of this analysis, I assume that the overstated costs of unlawful immigrants are offset by their overstated tax payments, so we should assume that the estimates are roughly accurate. Therefore, legalization increases the earnings of unlawful immigrants and thus their payments but also makes them eligible for Social Security and Medicare, increasing government spending later in life. I assume that legalization truly leads to only half the legalized population remaining in the U.S., since many of them would never have been deported under current policy.
In this subsection, I estimate the impact of the following policies:
Legalization for farmworkers: This policy would create a pathway to citizenship for the approximately 283,000 illegal immigrants working in farms across the United States. To estimate this policy’s fiscal impact, I assume that they have the same age distribution as all unlawful immigrants but that none of them has any college education, unlike the rest of the unlawful population.
Full amnesty for 15 million people: I assume that the final number of approved legalized illegal immigrants is 15 million, which is slightly higher than the latest estimate of the unauthorized immigrant population as of 2023.[37]
Legalization for 10 million people: I assume that only 10 million people ultimately qualify for an amnesty.
Path to citizenship for DACA: In this case, the 500,000 DACA recipients would be allowed to apply for green cards and then citizenship, or immediately citizenship.
Legalization for a fee: I estimate the economic impact of legalizing 5 million, 8 million, or 10 million illegal immigrants in exchange for a $5,000 annual fee for 10 years, for a total of $50,000 in additional revenue per legalized alien.
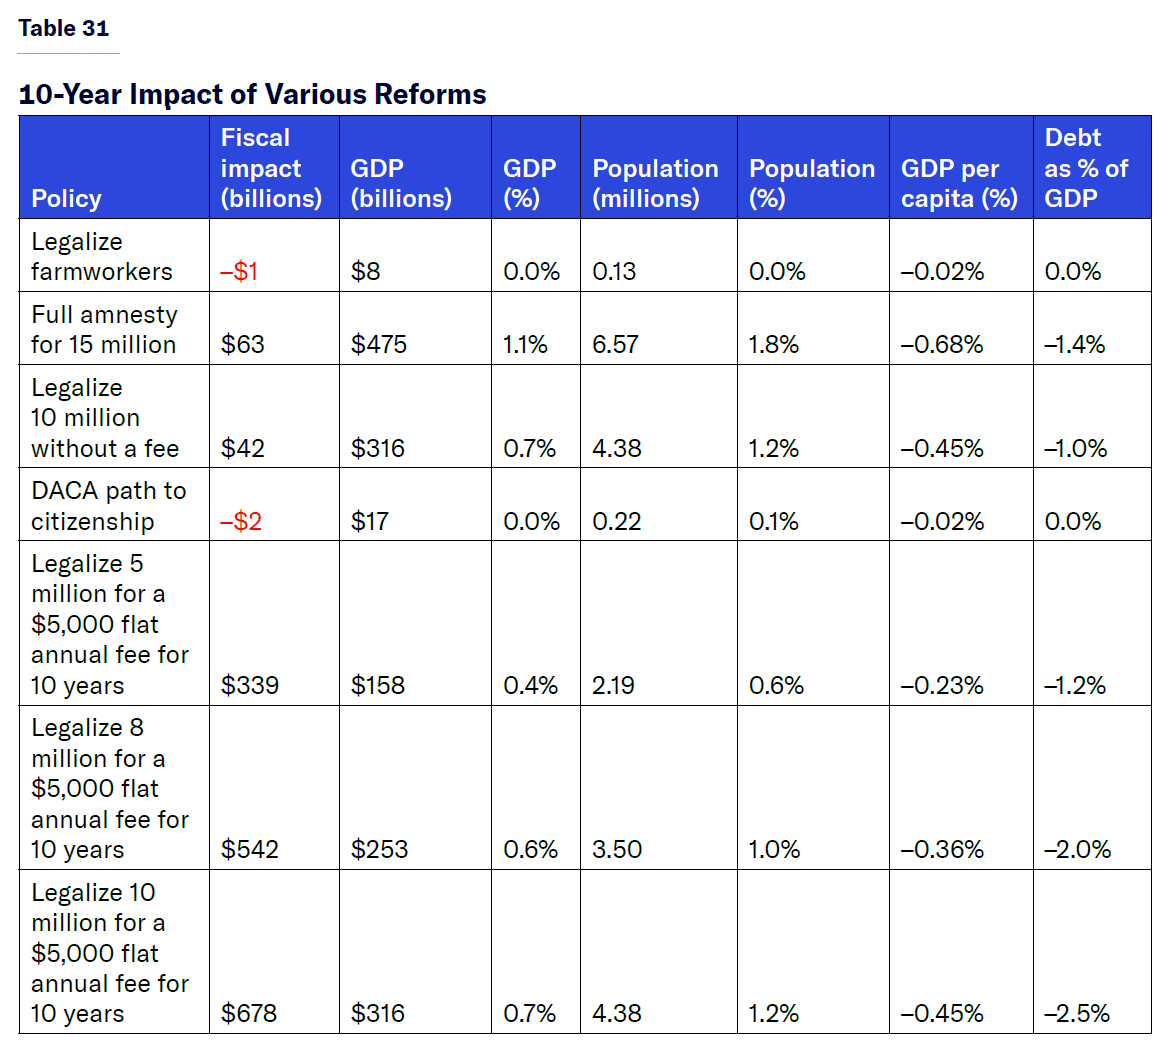
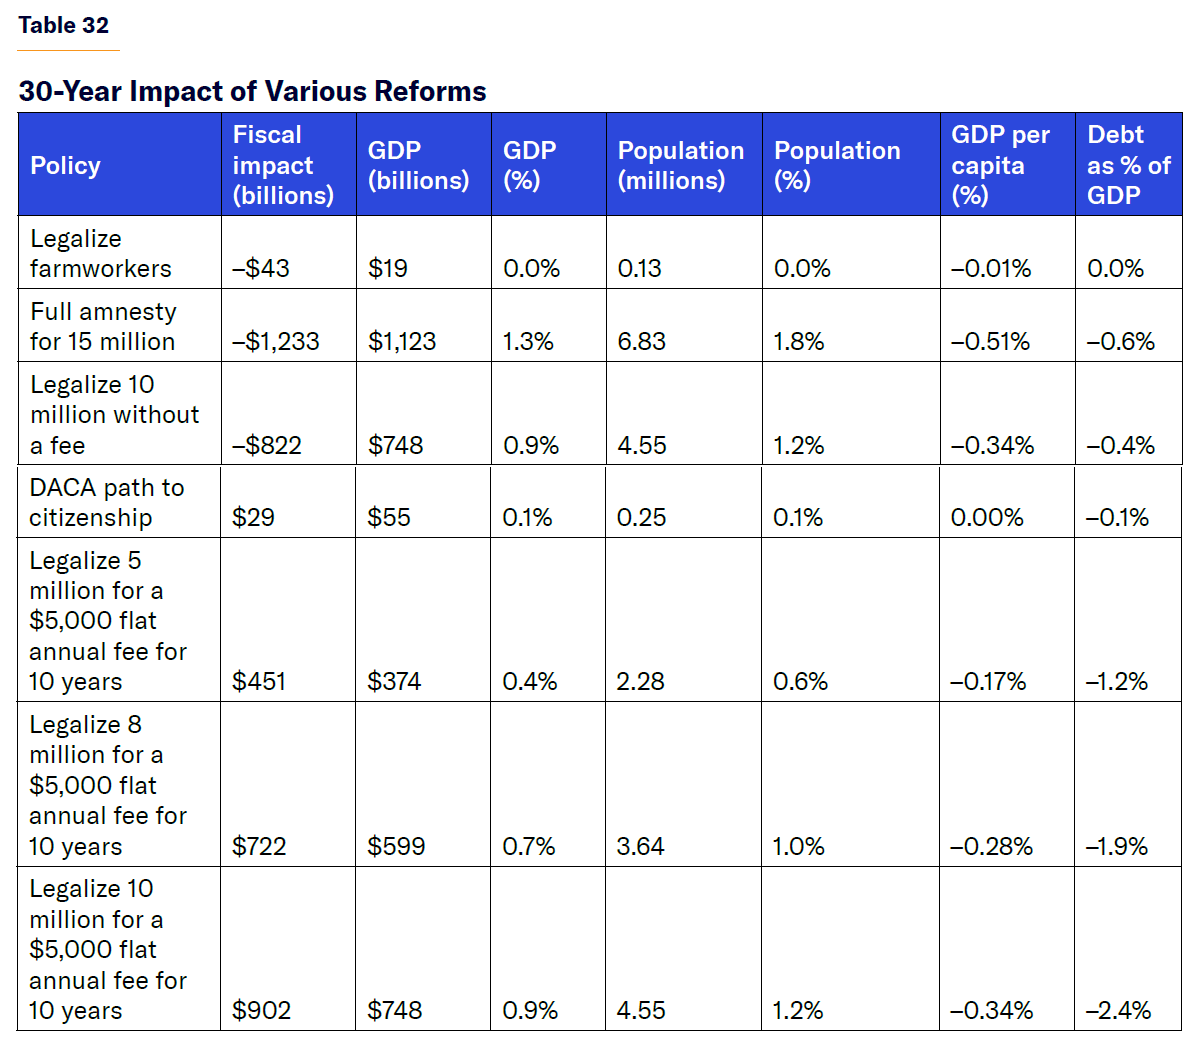
Interestingly, amnesty barely affects the national debt over the next decade, but it would increase the U.S. population by 6.5 million people, and consequently expand GDP by half a trillion dollars. This leads to a temporarily lower debt-to-GDP ratio despite growing the nominal size of the debt. Over 30 years, full amnesty for all unlawful immigrants would grow the national debt by $1.3 trillion but also expand the economy, reducing the debt-to-GDP ratio by 0.6% relative to the baseline. This reduction in the debt-to-GDP ratio should become positive after 30 years, since the costs of amnesty keep growing over time because of the fiscally burdensome and unlawful immigrants remaining, and the GDP boost becomes smaller over time as the initial population ages. Legalizing 10 million illegal immigrants has the same impact as a full amnesty but proportionally smaller. Given the much larger population of low-income immigrants, full amnesty would reduce GDP per capita by over half a percentage point.
On the other hand, legalizing the DACA population would be more beneficial in the long run, reducing the national debt by $29 billion over 30 years and having little impact in the short run. The other popular segment of the illegal immigrant population—farmworkers—would be the most economically negative, with farmworker legalization leading to a $43 billion increase in the national debt for less than half the GDP boost.
Legalizing illegal immigrants in exchange for a substantial $50,000 fee over 10 years would raise large amounts of revenue and reduce the national debt. If 10 million illegal immigrants are given the option to pay $5,000 annually over a decade to remain in the U.S. legally, the national debt would shrink by $674 billion after a decade and $889 billion after 30 years, all while expanding the size of the economy, ultimately leading to a debt-to-GDP ratio 2.4% lower.
Part 5: The Manhattan Institute Immigration Reform Proposal
In this part, I describe a proposed immigration reform that maintains the projected population of the U.S. but shifts the composition of the immigrant flow toward younger and highly skilled immigrants, substantially reducing the national debt and expanding the size of the economy by more than any other previous legislation. I then compare this proposal with other comprehensive reforms proposed by legislators and think tanks across the political spectrum.
The Manhattan Institute’s immigration reform includes the following:
Ends the green-card category for parents of U.S. citizens
Caps refugee resettlement at 50,000 annually, reducing the average refugee admissions to 40,000 annually relative to the historical average of 75,000
Classifies spouses and minor children of green-card holders as immediate relatives and ends the cap on their entry
Uncaps EB-1 visas and EB-2 visas in the national interest waiver category
Exempts graduates of U.S. colleges with a PhD in a designated STEM area from all visa caps
Creates an OECD work visa for up to 10,000 college-educated workers under the age of 35
Grants work authorization to all long-term visa holders in the H-4, O-3, and TD visa categories while allowing international students and their spouses to work off-campus part-time
Auctions all 9,940 EB-5 green cards every year
Implements wage-ranking for the 85,000 cap-subject H-1B visas
Ends the diversity visa lottery and shifts those 55,000 green cards to the EB-2 category
Ends the EB-3 category and shifts those 40,040 visas to the EB-2 category
Grants the annual 135,000 EB-2 visas in order of salary offer rather than first-come first-served
Converts the remaining 138,000 extended family visas into a points-based system that grants visas to those with the highest education, youngest age, and best English proficiency and prefers those with some family ties in the United States
Recaptures all unused employment-based visas to clear the existing backlog of visas
Creates a pathway to citizenship for DACA recipients
Grants a new permanent legal status without a pathway to citizenship for up to 10 million illegal immigrants in exchange for a $5,000 annual fee for 10 years
Deports the remaining 5 million illegal immigrants who do not qualify, either because they have a criminal record or lack the means to pay the legalization fee in full and on time
Table 33 and Figure 36 describe the change in the legal immigrant flow by category from this reform; Table 34 and Figure 37 describe the change in the educational composition of the immigrant flow; and Table 35 and Figure 38 describe the change in the age composition of the immigrant flow.
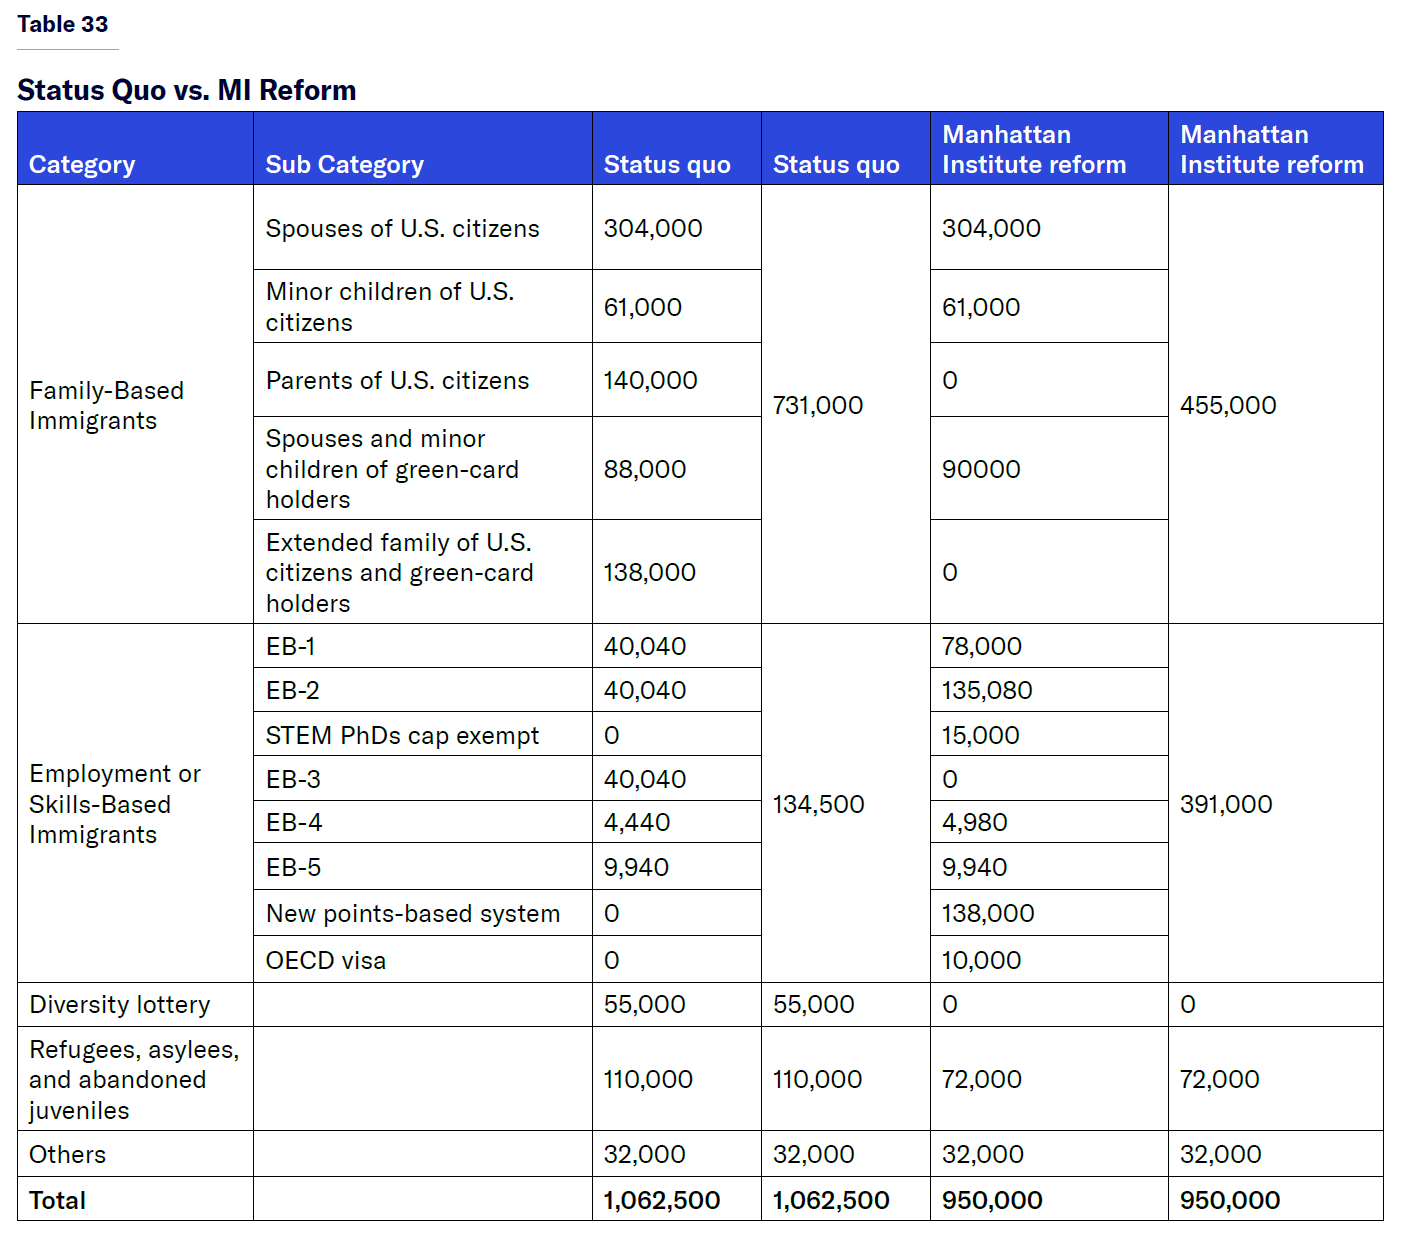
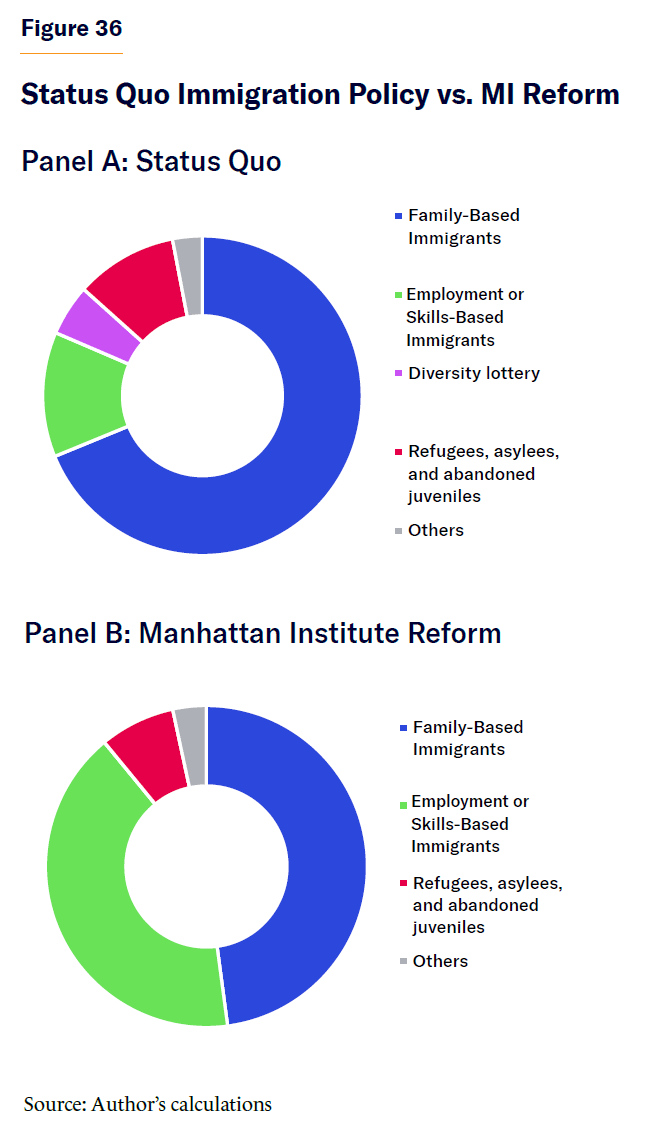
Under the proposed reform, the permanent immigrant flow would go from nearly 69% family-based immigration to under 48%, while the share of employment-based and skills-based immigrants would jump from under 13% to over 41% of new immigrants, all while slightly reducing the flow of new immigrants from more than 1 million to 950,000 annually, approximately a 10% reduction. This reduction in future immigration would occur after a temporary jump from green-card recapture for employment-based immigrants waiting for a green card, as well as the legalization under a new visa without a path to permanent residency for some illegal immigrants.
Still, showing the share of immigrants in each legal category does not fully reflect how the characteristics of the immigrant flow would change. Table 34 and Figure 37 describe the share of immigrants in each education level now versus after the proposed reform to the immigration system. Now, nearly 45% of new immigrants hold a high school diploma or less education, and just over 40% have a college degree. Under the Manhattan Institute reform, those shares would change to under 30% with just a high school diploma or less and nearly 60% with a college degree or higher.
Regarding the age composition, the Manhattan Institute reform would significantly reduce the average age of new immigrants. As Table 35 and Figure 38 show, the number of immigrants aged 60 and older would decline by 70% under this proposal from over 13% of new immigrants to under 4%. On the other hand, the share of new immigrants in their thirties and forties would rise from under 25% and 20% to 30% and over 27%, respectively. This will mean more working-age and fertile immigrants, who will live longer and pay more in taxes before collecting old-age entitlements.
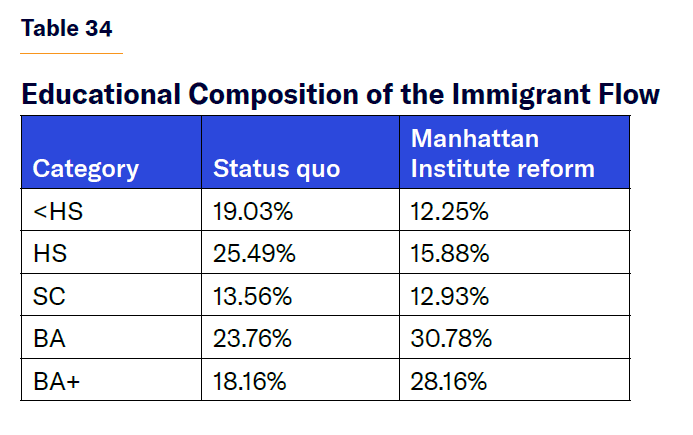
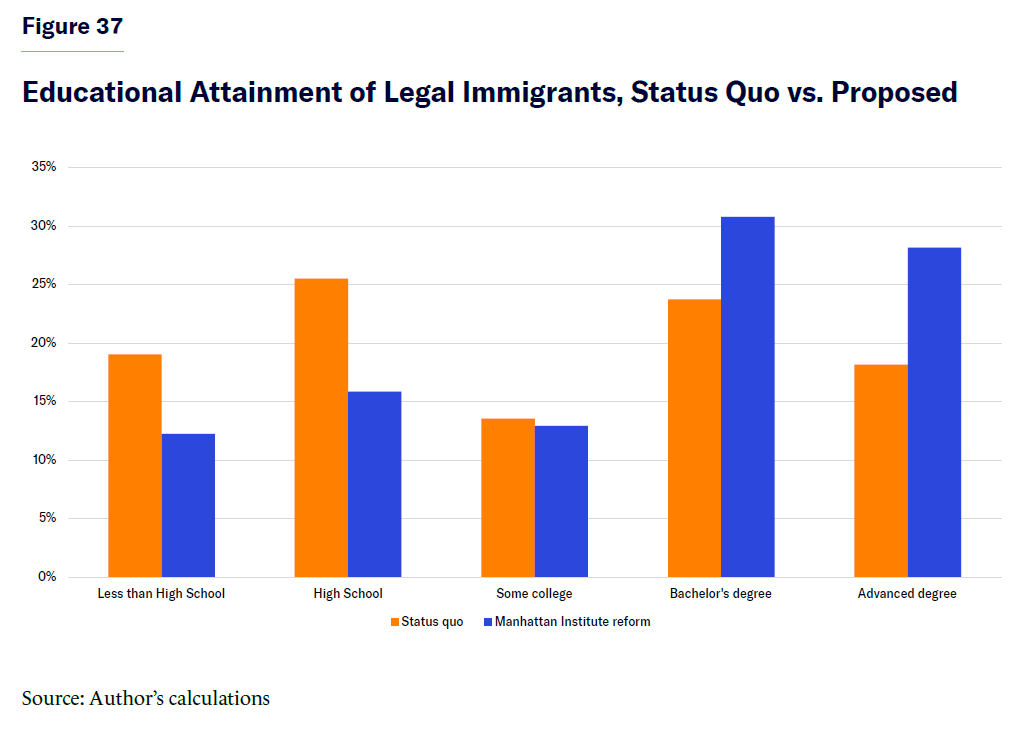
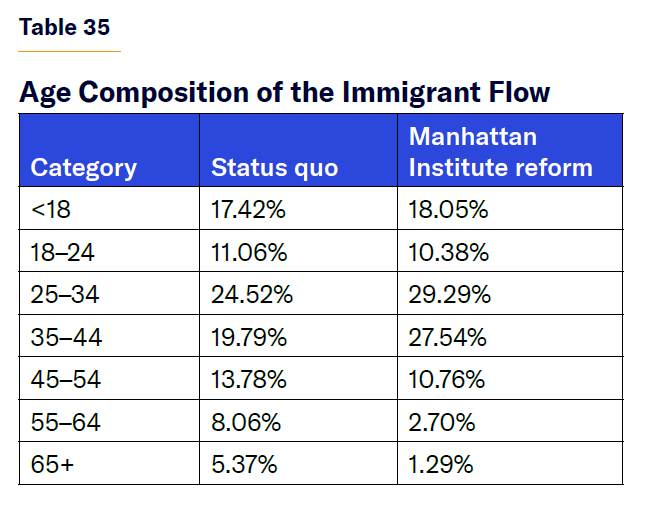
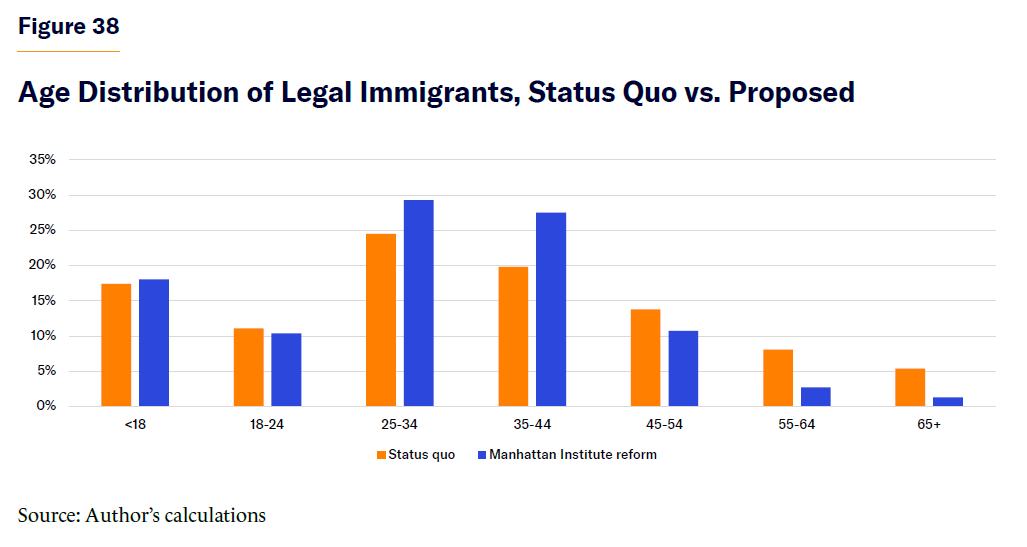
Table 36 summarizes the impact of the proposed Manhattan Institute immigration reform on the economy, national debt, and population of the United States. Under this comprehensive immigration reform, the U.S. population would barely change—0.18% over 30 years above existing projections—but GDP would be 4.6% larger and the federal debt would be nearly $20 trillion smaller than currently projected, reducing the debt-to-GDP ratio by almost 29 percentage points. This immigration reform proposal would stabilize the debt-to-GDP ratio of the U.S. around 125% of GDP by the mid-21st century, all without cutting government spending or increasing taxes. This analysis proves that an aggressive immigration reform that rebalances the immigration flow from old to young and less educated to more educated can essentially fix American budgetary issues over the long run without expanding the size of the U.S. population or creating assimilation concerns.
In fact, this reform would alleviate immigrant assimilation concerns because a greater share of new immigrants would speak English, and fewer of them would be in poverty or go on to commit crimes, just by virtue of their higher educational attainment, some of the foremost concerns of Americans regarding immigration.[38]
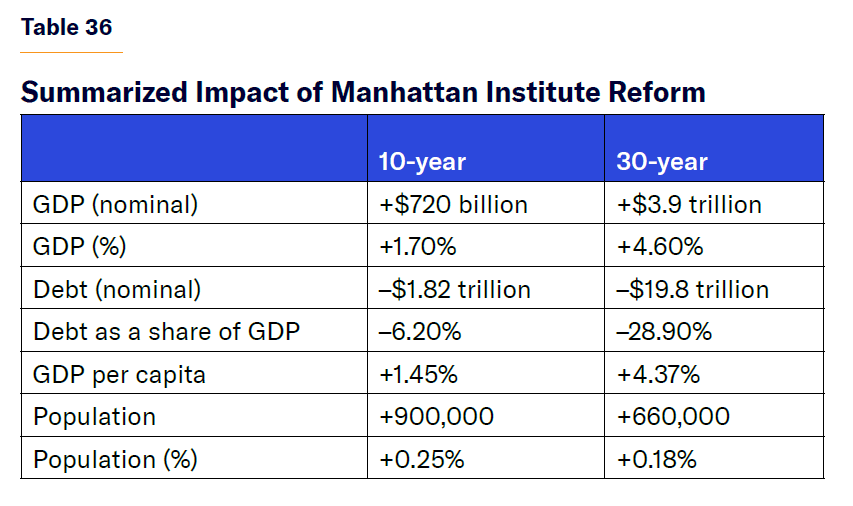
Next, I compare the MI plan (as far as how it affects the economy and population) with other comprehensive immigration reform proposals, specifically:
Representative Maria Elvira Salazar’s and Veronica Escobar’s Dignity Act[39]
The Democrats’ U.S. Citizenship Act of 2021[40]
Senator Tom Cotton’s RAISE Act[41]
Cato Institute[42]
Center for American Progress[43]
Center for Immigration Studies
The Dignity Act would allow illegal immigrants present in the U.S. in January 2021 or earlier to apply for legal status as long as they pay $1,000 annually for seven years and do not have a criminal record. It would also create a pathway to citizenship for all illegal immigrants brought to the U.S. as children. This means that about 7.5 million unlawfully present immigrants obtain legal status and 2.5 million immigrants illegally brought as children obtain a pathway to citizenship. The Dignity Act would also cap the number of years to wait for an approved immigrant petition through family or employment at 10 years. This would halve the family-based backlog and allow 2 million people waiting abroad with an approved family petition to immigrate. This provision, alongside the exemption of dependents and STEM graduate holders from the cap of employment-based petitions, would clear the entire employment-based backlog in a short time, by more than 1 million people. Additionally, by excluding dependents from the EB cap, the Dignity Act would effectively double employment-based immigration, raising overall immigration levels by approximately 135,000 people annually, or 13%.
The U.S. Citizenship Act of 2021 (USCA) was President Joe Biden’s and congressional Democrats’ comprehensive immigration proposal introduced at the beginning of his presidency. This reform would give legal status to an even greater number of unlawful and temporarily lawful immigrants with temporary protected status than the Dignity Act, as well as an expanded population of “Dreamers,” legalizing approximately 10 million illegal immigrants and 2.5 million Dreamers. The USCA would increase refugee numbers by expanding capacity abroad, which, I assume, would double the average annual refugee flow, resulting in an additional 75,000 refugees per year. USCA would recapture all unused green cards, clearing the entire legal immigration backlog for both family and employment petitions, allowing 4 million relatives of U.S. citizens and legal permanent residents to immigrate to the U.S. and permitting more than 1 million work visa holders already in the U.S. to receive green cards. This bill would expand family and diversity immigration quotas by increasing family migration from 226,000 annually to 480,000 and by increasing the slots in the diversity visa lottery from 55,000 to 80,000. USCA would exempt immigrants with STEM PhDs from a U.S. university from immigration quotas, add 30,000 visas for employment-sponsored immigrants with low levels of education, and end the H-1B visa lottery in favor of a wage-ranked allocation. Overall, the U.S. Citizenship Act would increase permanent immigration by almost 400,000 people annually.
The RAISE Act was the framework supported by Trump in his first term as a starting point to negotiate immigration reform. This bill would have ended the green-card category for parents of U.S. citizens, capped refugee admissions, and ended all family-based immigration except for spouses and children of permanent residents. The bill would have then pooled the 140,000 employment-based green cards into a points-based system and ended the diversity visa lottery. I assume that this points-based system effectively ends the EB-1 category backlog and the EB-3 category visas, which would then be received by immigrants with characteristics similar to those in the more highly skilled EB-1 and EB-2 visa categories. The RAISE Act would reduce legal immigration by nearly 360,000 people annually.
Then we have the Cato Institute’s immigration reform plan, the greatest expansion in immigration proposed. The main provision suggested by the Cato Institute is a new low-skilled work visa similar to the H-2A and H-2B programs. This plan would like to allow unlimited seasonal labor and uncapped visas in both the H-2A and H-2B visa categories, create a new unlimited year-round visa category, create a new state-based visa, and a new points-based immigration system on top of the current one. I assume that this proposal would ultimately draw 1 million workers—overwhelmingly without a college education—into the U.S. annually. They would impose a floor of 95,000 for refugee admissions, 20,000 higher than the current historical average of 75,000. Therefore, I assume that average admissions would rise to 100,000 per year. The plan would exempt spouses and children of permanent residents, cap the visa wait time at 10 years, and increase the family visa cap by population growth. I estimate that these provisions would increase annual family visa issuance by 10,000 annually, on average, in the near term, and clear most of the visa backlog, similar to the Dignity Act. Furthermore, the Cato immigration plan would effectively uncap all employment-based immigration, clearing the backlog of EB petitions, and recapture unused green cards. This would fully clear both the family and employment visa backlogs. The plan would raise the cap on H-1B visas to 275,000 annually, up from 85,000 today, and would provide legal status to all unlawful immigrants in the United States. Overall, the Cato Institute’s immigration reform plan would increase total annual immigration by more than 1.4 million, or more than double the current immigration level, of which nearly 1.3 million people would be permanent immigrants.
The Center for American Progress released its immigration reform proposal this year; while it was mostly a border security plan, it described several major immigration changes. Among the changes that CAP advocates are increasing refugee admissions and increasing legal immigration overall. While its plan lacks details, I assume that, as with the Dignity Act, it would cap green-card wait times at 10 years. The plan does state that it would exempt spouses and children of permanent residents from green-card caps, which would increase family immigration by 5,000 annually. CAP states that it wants to increase employment-based immigration without offering more detail, so I assume that it would issue 100,000 more EB-2 visas annually. CAP’s immigration plan would increase immigration by 130,000 people annually.
The Center for Immigration Studies plan[44] is a rough approximation of the policies advocated for by the think tank when it comes to permanent and some temporary migration. This plan would more than cut in half legal immigration, ending the diversity visa lottery, and end the parents of U.S. citizens and extended relatives of Americans with green-card categories. Unlike the MI plan, the CIS plan does not replace these visas with other paths to select immigrants, and unlike the RAISE Act, the CIS plan goes further and eliminates the EB-2 and EB-3 employment categories, keeping only the EB-1 category for the most extraordinary and established immigrants. The CIS plan would cap refugee resettlement and reduce the average annual intake from 75,000 to 25,000, and it would end the H-1B visa program. Altogether, the CIS plan would reduce immigration by more than 670,000 people annually.
The numerical effect of each immigration plan, including the Manhattan Institute plan, is summarized in Table 37 and illustrated in Figure 39. The creation of new points-based systems and other high-skilled visas is modeled as an increase in current employment-based categories; low-skilled visas are modeled as an increase in H-2B visas.
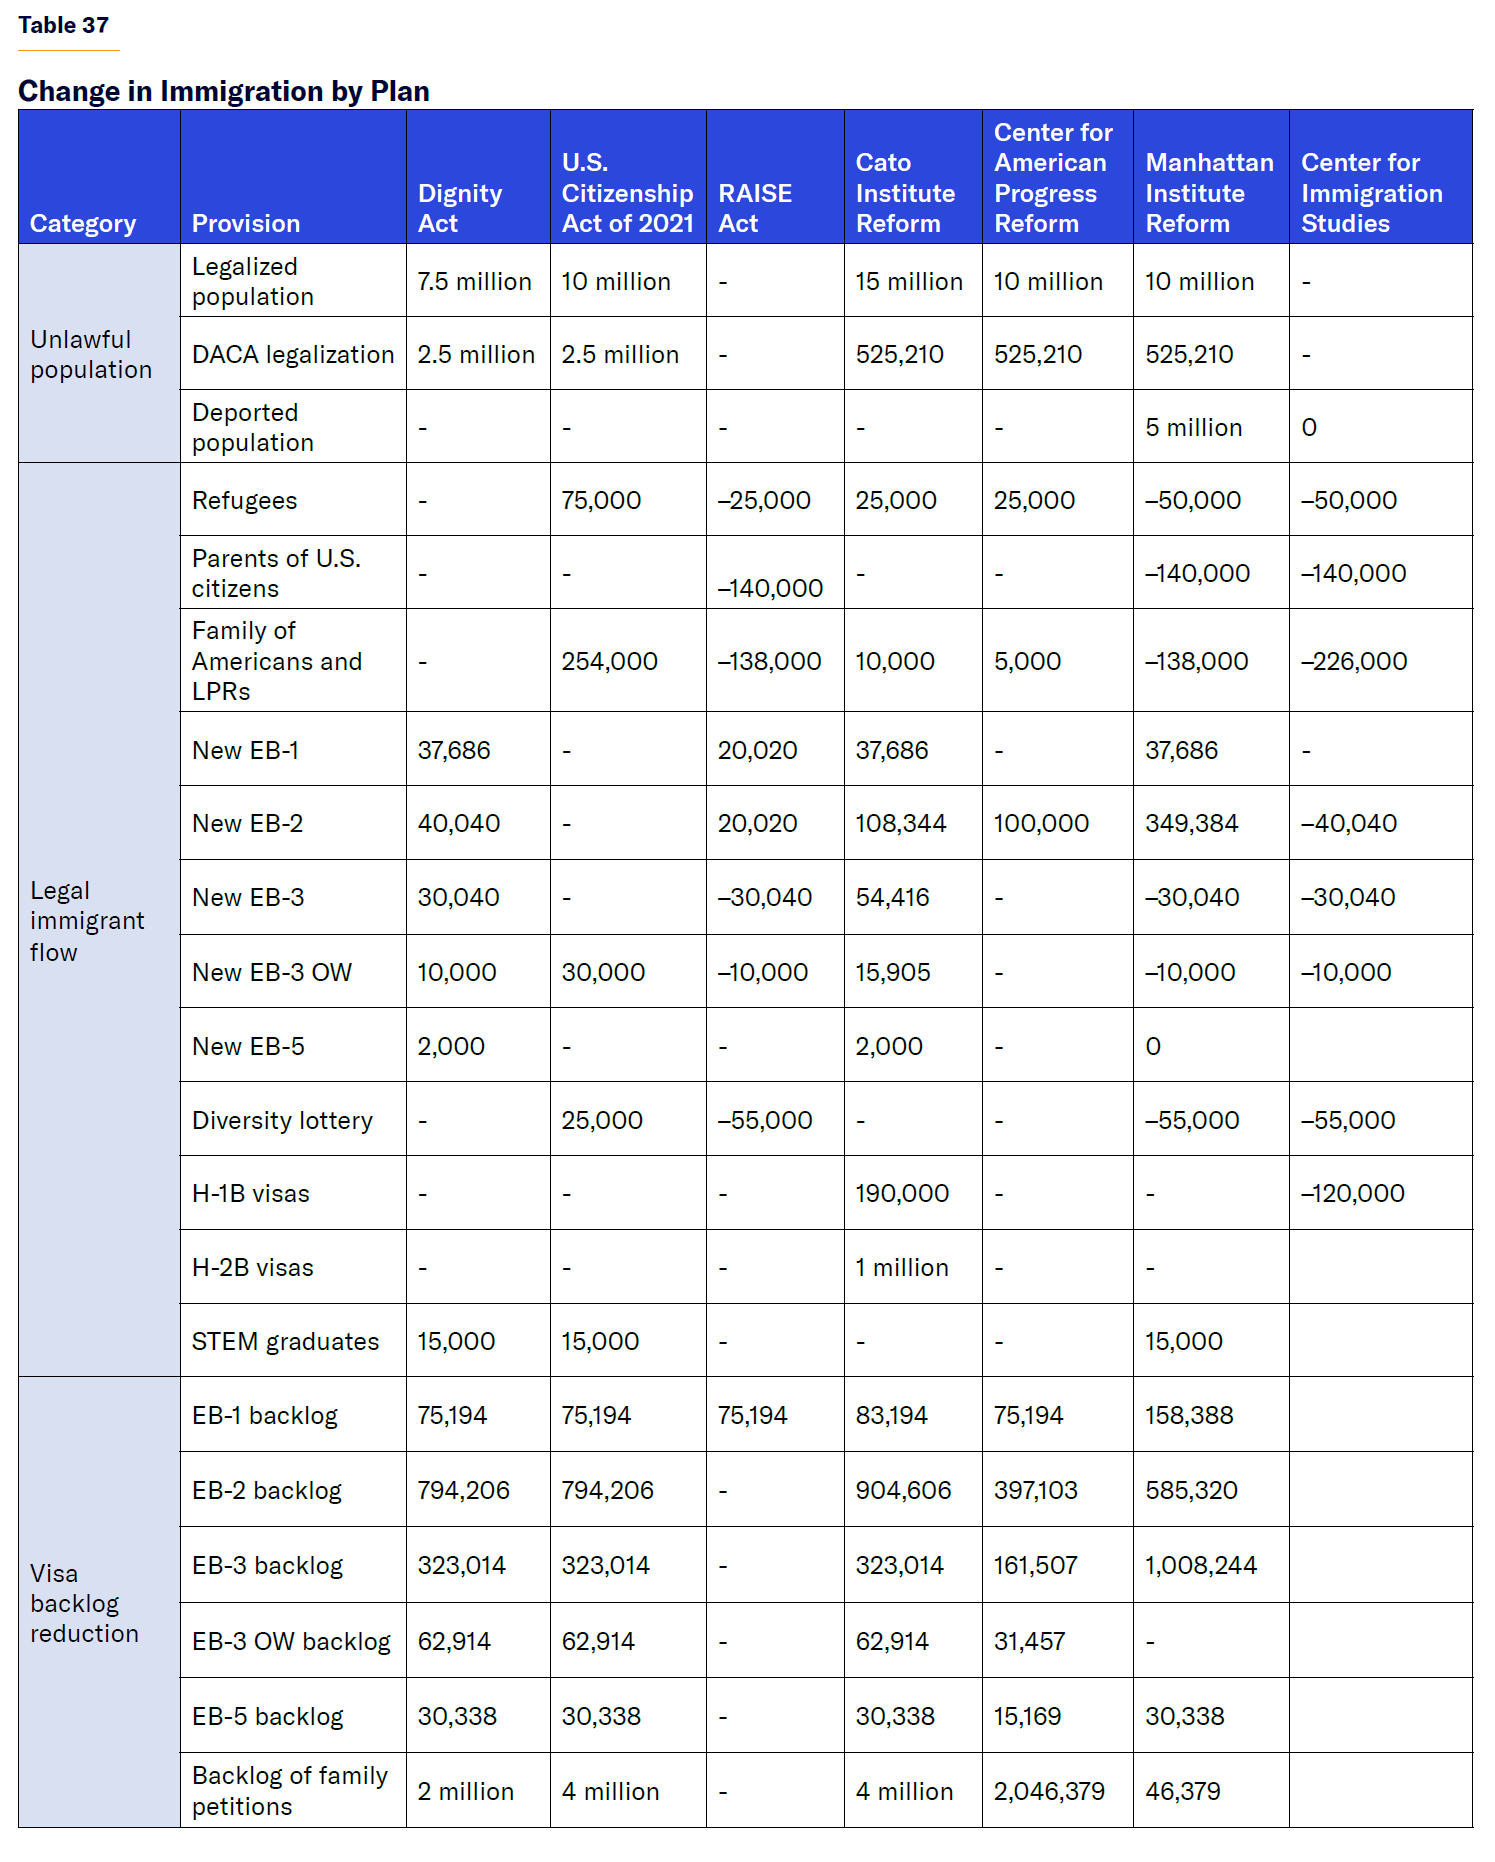
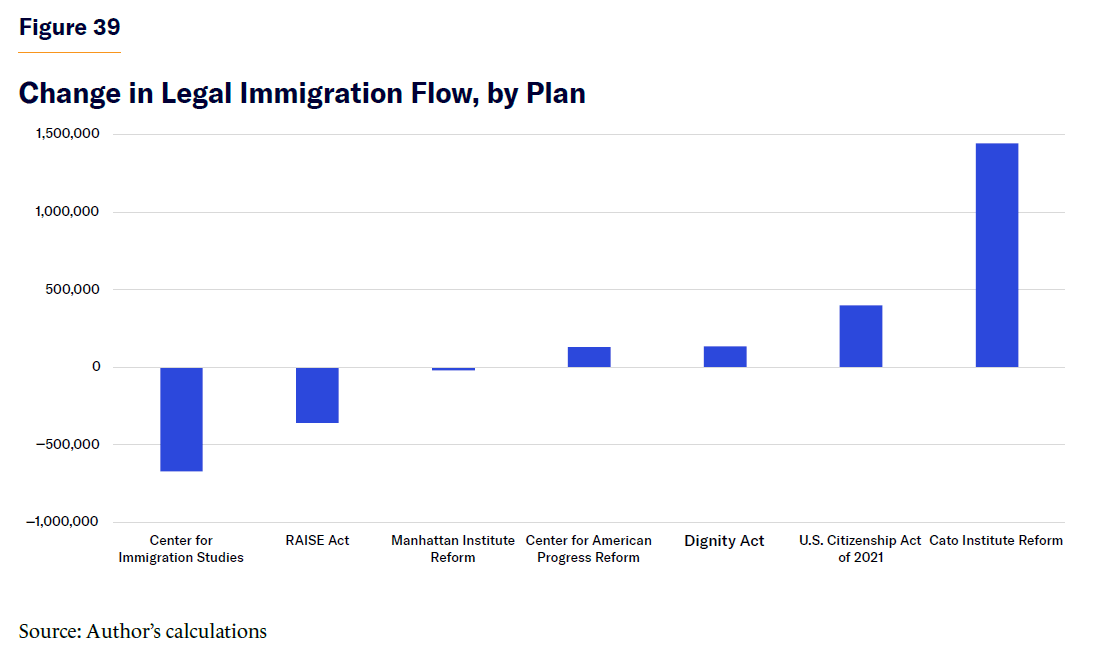
Each of these plans would have different effects on the size of the population of the U.S. in 10 and 30 years. As Figure 40 shows, the Manhattan Institute’s immigration plan would have the least meaningful impact on the trajectory of the U.S. population, slightly increasing it by 900,000 over 10 years and increasing it by 660,000 after 30 years. The CIS plan would reduce the U.S. population significantly, by more than 13 million after 30 years, and the Cato Institute’s reform proposal would increase the size of the U.S. population by nearly 45 million people after 30 years. The change in the U.S. population would be so large under the Cato Institute’s immigration reform proposal that over 25% of residents of the U.S. would be foreign-born in less than 30 years, relative to the baseline census projection of about 17%.
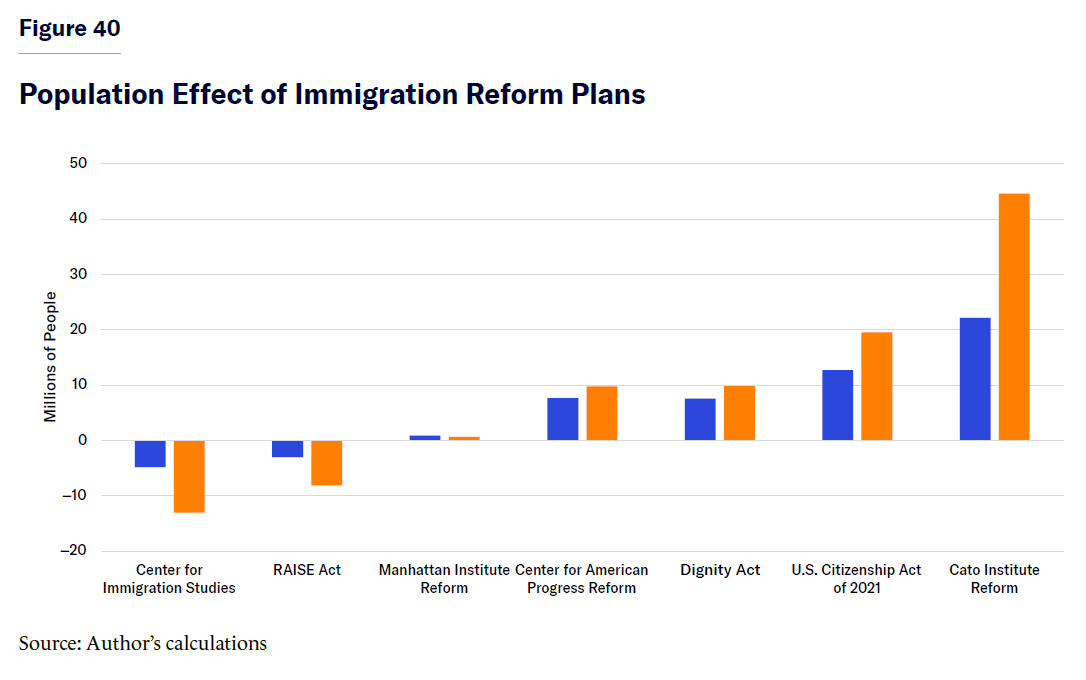
Next, I compare the 10- and 30-year effects of these plans on the national debt in Figures 41 and 42. All the plans would reduce the debt over the long run, except for the Center for Immigration Studies proposal, which would increase the national debt in the first 10 years of implementation by $370 billion and by nearly $5.5 trillion over 30 years. The RAISE Act would increase the deficit in the first 10 years and reduce it over 30 years. The Manhattan Institute plan would reduce the debt the most of any of the proposed reforms in both the 10- and 30-year periods, with a national debt $1.8 trillion smaller in 10 years and nearly $20 trillion smaller in 30 years. The Cato Institute’s plan would reduce the national debt by about $1 trillion in 10 years and $11 trillion in 30 years.
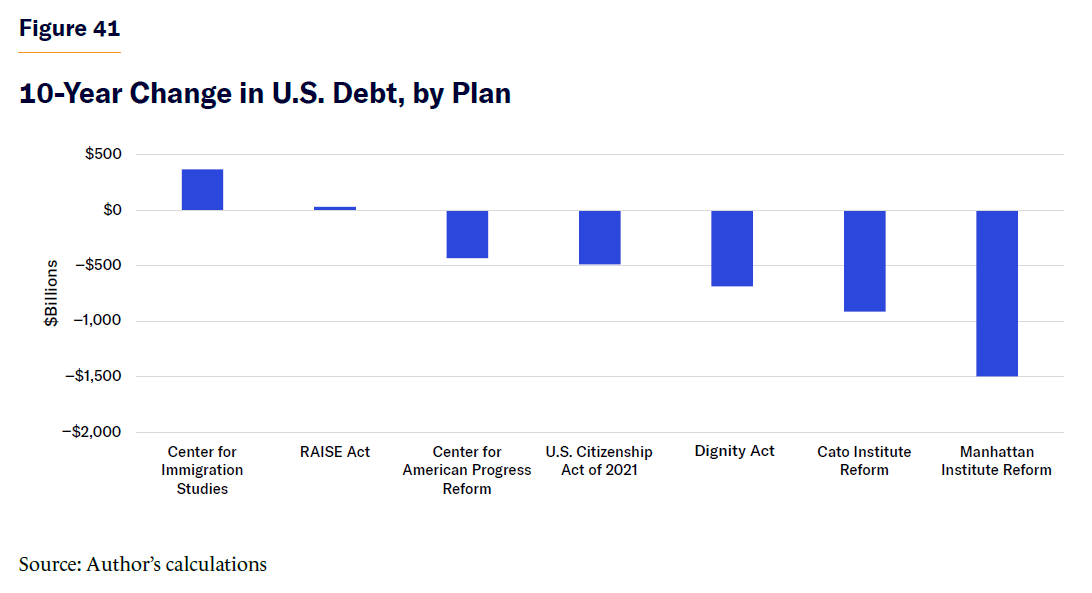
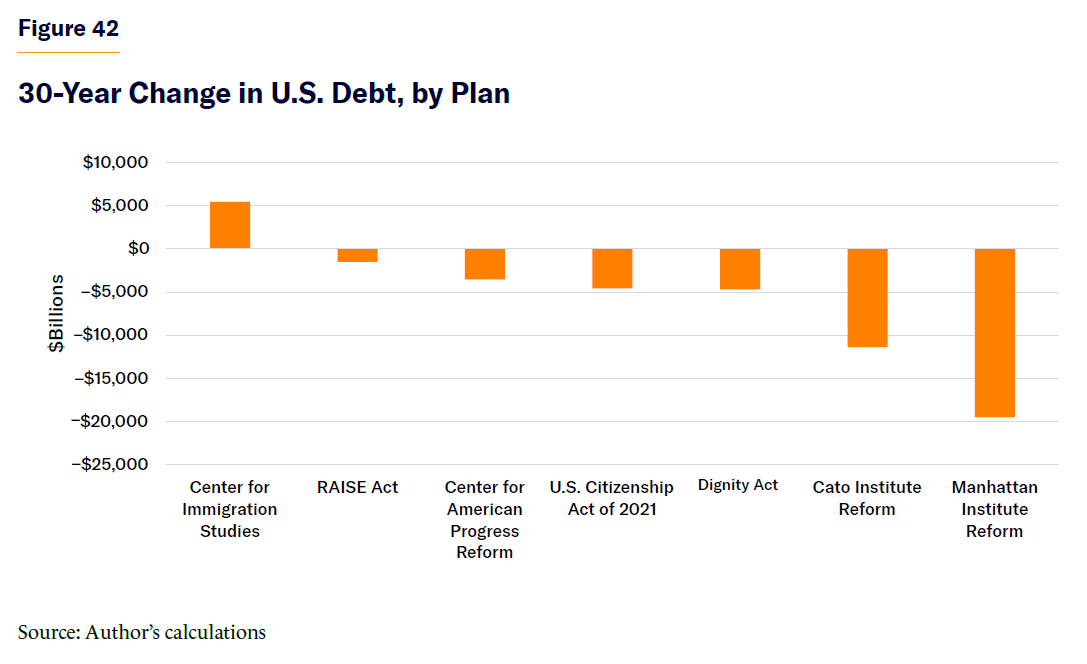
While the Manhattan Institute plan would, by far, reduce the national debt the most of any other proposal, the Cato Institute’s immigration plan would expand the economy more than any other because it also expands the size of the U.S. population by over 10% (Figure 43). GDP in the 10th year of the Cato plan would be $2 trillion greater and over $9 trillion greater after 30 years. The Manhattan Institute plan, despite not increasing immigration levels, would increase the size of the economy more than the Dignity Act, CAP’s plan, and the U.S. Citizenship Act, expanding GDP by $720 billion after 10 years and $3.9 trillion after 30 years. Only the RAISE Act and the Center for Immigration Studies plan would reduce the size of the U.S. economy because of drastic cuts to legal immigration. The RAISE Act would shrink the economy by $1.5 trillion after 30 years while the immigration proposal of the Center for Immigration Studies would shrink the size of the U.S. economy by over $3.3 trillion while adding nearly $5.5 trillion to the debt over 30 years.
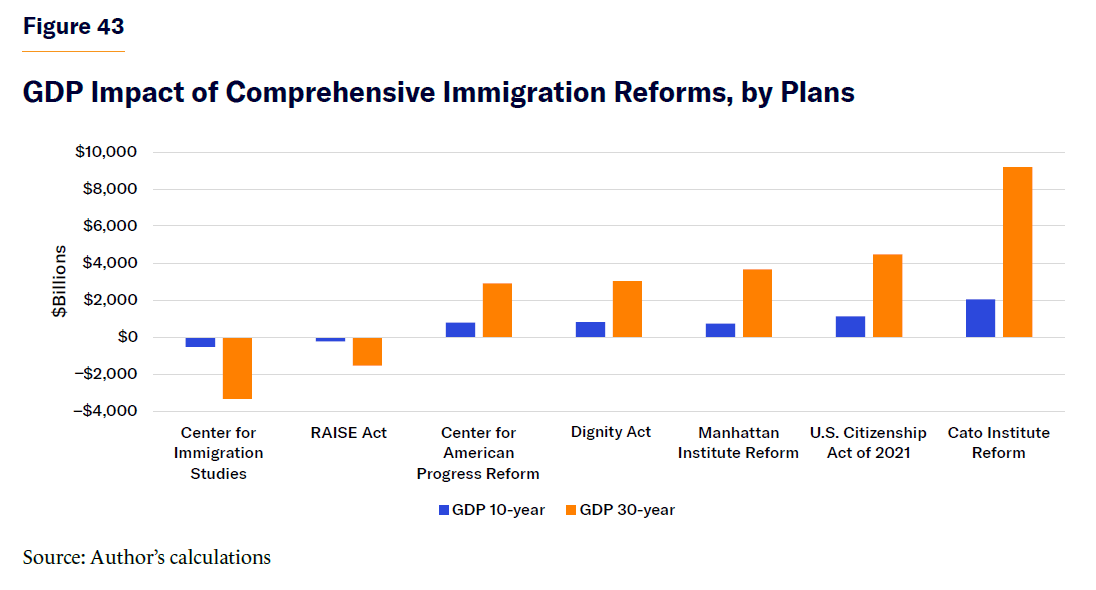
Since we know the impact on both GDP and the national debt, I can easily calculate the impact of each immigration plan on the size of the debt relative to the economy. Only the plan proposed by the Center for Immigration Studies would substantially raise the debt-to-GDP ratio among all the immigration plans analyzed. Specifically, the debt would be 2.3% larger relative to the size of the economy in 10 years and 12.8% larger in 30 years if the CIS immigration cuts are implemented. And the debt-to-GDP ratio would grow to almost 167% in 2054 instead of the projected 154%. The RAISE Act would also increase the burden of the national debt, only by 1.1% over 30 years, because it does not cut the highly skilled immigration pathways but only just so-called chain migration. The U.S. Citizenship Act, the Dignity Act, and the Center for American Progress plans would all reduce the debt-to-GDP ratio by 3.1%–4.1% in 10 years and 9%–12.6% over 30 years. Despite massively increasing the size of the U.S. population, the Cato Institute’s plan would not reduce the size of the debt relative to the economy more than the Manhattan Institute plan over the long run. The Cato Institute’s immigration plan would reduce debt to GDP ratio by 7.4% in 10 years and 26.7% over 30 years. The Manhattan Institute’s immigration plan would reduce the debt by 5.4% in 10 years and by 27.9% in 30 years.
Figures 44 and 45 suggest an important trend: if the period of analysis is extended beyond 30 years, the Manhattan Institute’s immigration reform proposal would stabilize the size of the debt relative to the economy in the long run, as fewer low-skilled immigrants consume government benefits and more high-skilled immigrants pay large sums in taxes and grow the size of the economy.
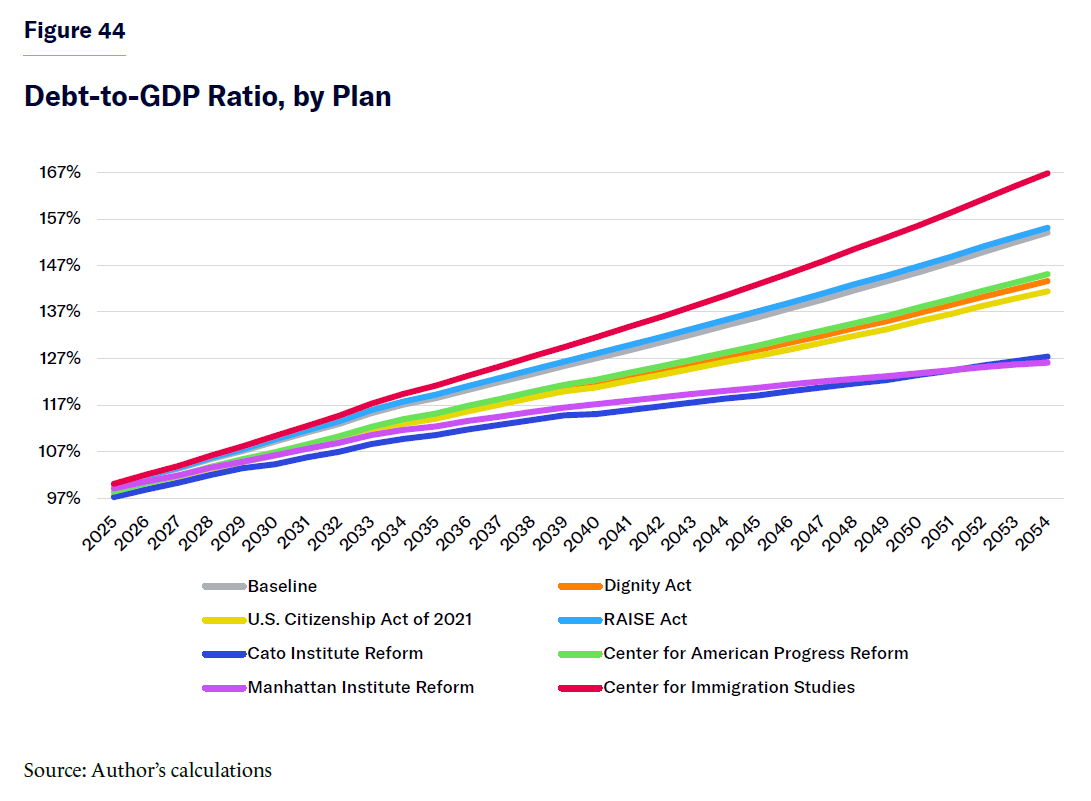
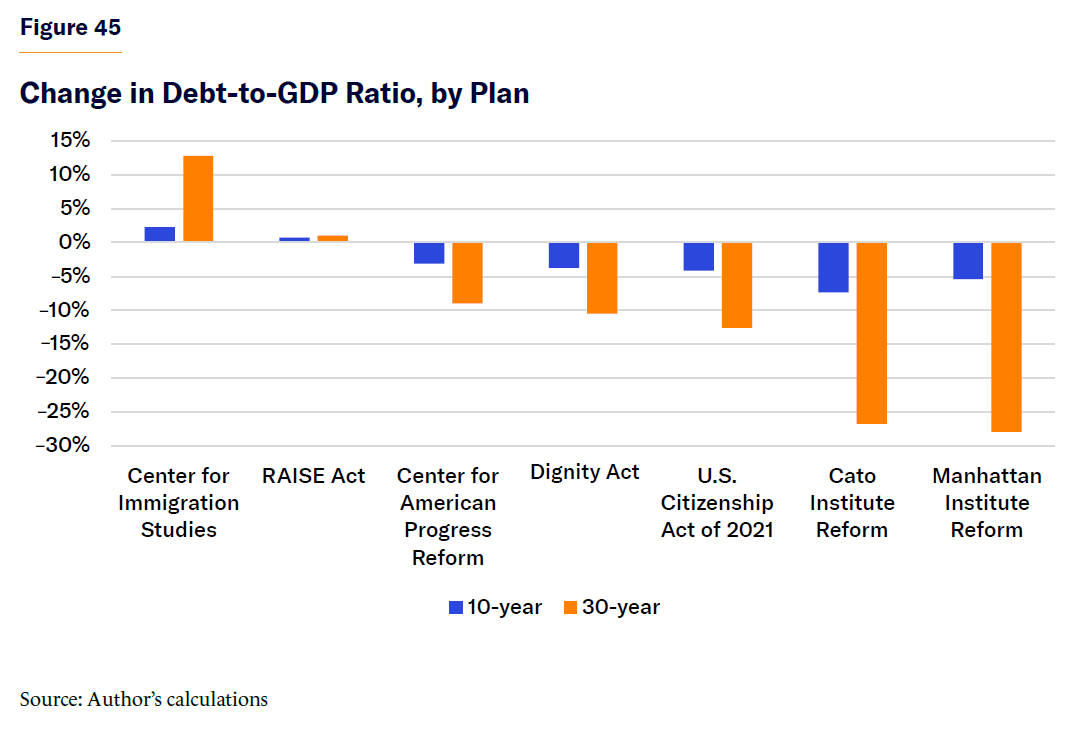
Conclusion
This report demonstrates that the fiscal and economic effects of immigration depend heavily on the age, education, and legal status of immigrants admitted to the United States. By employing a CBO-like framework that measures the 10- and 30-year impacts on tax revenues, federal spending, GDP, and population, I reveal that immigration policy can be a powerful lever to influence the federal budget trajectory—positively or negatively—without altering spending programs or changing tax policy.
The results confirm that younger, highly educated immigrants are consistent net fiscal contributors over both budget windows, with larger positive spillovers on economic growth and capital formation. In contrast, less educated immigrants—particularly those without a high school diploma—tend to impose a net fiscal burden, especially after the costs of their typically more numerous and less educated children are considered. Age at arrival is equally important: older immigrants may appear fiscally positive in the short run because they contribute payroll taxes without drawing on entitlements; but over 30 years, they often become net burdens as Social Security and Medicare eligibility set in.
Legal status and visa category matter greatly because each visa category selects immigrants of different characteristics. Employment-based immigrants, especially those with STEM graduate degrees and on H-1B visas, yield the largest fiscal surpluses, of several million dollars each, while extended family and parents of U.S. citizens, along with some low-skilled permanent workers, tend to increase the budget deficit. Differences also emerge by region of origin, largely explained by variation in educational attainment rather than geography per se, with South Asian immigrants, especially Indians, the most fiscally positive group, and Latin Americans, especially Mexicans and Central Americans, the most fiscally burdensome immigrants.
Policy simulations show that targeted reforms—such as requiring minimum education and English proficiency, reallocating visas toward high-skilled categories, wage-ranking H-1B visas, and recapturing unused employment-based green cards—can dramatically improve the American fiscal picture. Conversely, broad restrictions on high-skilled immigration, such as ending the H-1B program or a complete immigration moratorium, would increase deficits and shrink GDP significantly. A full immigration amnesty would worsen the fiscal picture in the U.S., given the low education and high costs of this population, but legalization of most illegal immigrants can reduce the deficit significantly and grow the economy if these immigrants pay a substantial fee to remain in the country. Indeed, while drastic cuts to legal immigration like those proposed by the Center for Immigration Studies would likely lead to a debt crisis in the next three decades, drastic increases in immigration as proposed by the Cato Institute would likely harm assimilation and erode the social fabric. Only shifting the immigrant flow from old to young and less educated to more educated is guaranteed to maintain social cohesion and reduce the national debt in the long run.
The Manhattan Institute’s comprehensive reform proposal combines selective restrictions with high-skilled expansions, visa reallocations, and market-oriented mechanisms such as auctions. This package would rebalance immigrant inflows toward younger, more educated, entrants while keeping total numbers stable. Model results indicate that it would increase GDP by 4.6% and reduce the national debt by nearly $20 trillion over 30 years, lowering the debt-to-GDP ratio by almost 29 percentage points—more than any other major reform considered.
Ultimately, while fiscal outcomes should not be the sole criterion for immigration policy, they are a crucial and quantifiable measure of long-term national interest. A well-designed policy mix can simultaneously strengthen the federal balance sheet, boost economic growth, and ease assimilation pressures—achieving a sustainable immigration system that aligns demographic, economic, and budgetary goals.
About the Author
Daniel Di Martino is a PhD candidate in economics at Columbia University and a graduate fellow at the Manhattan Institute, where he focuses on high-skill immigration policy. Born and raised in Venezuela, he came to the U.S. in 2016. He has appeared many times on national TV, including Fox News and CNN, and has written for USA Today and National Review. Di Martino speaks regularly on college campuses and at high schools. He is the founder of the Dissident Project and a member of the board of advisors of Young America’s Foundation.
Appendix
Below are tables with the age and education of each legal status group measured in this report.
Immigrants by Legal Status
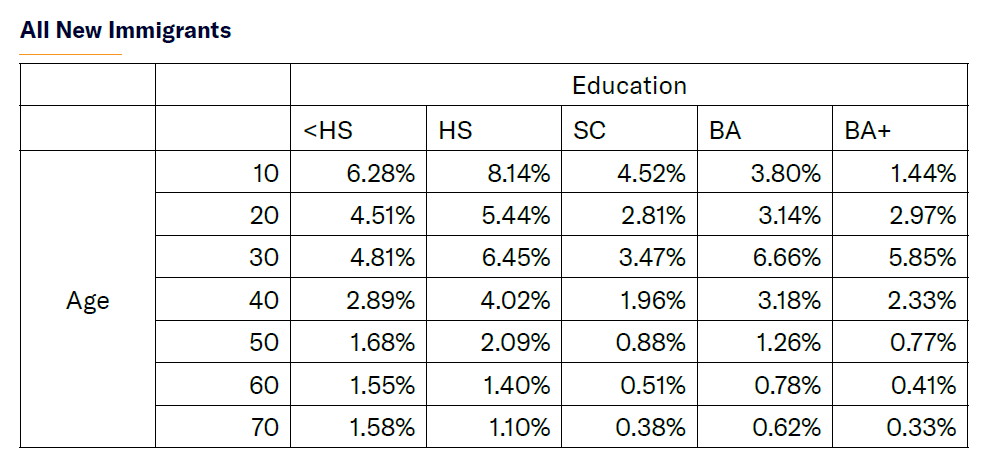
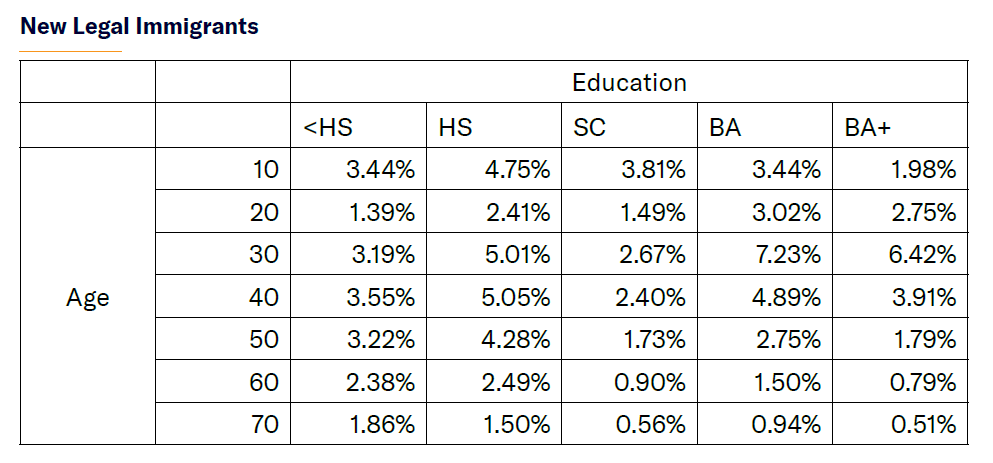
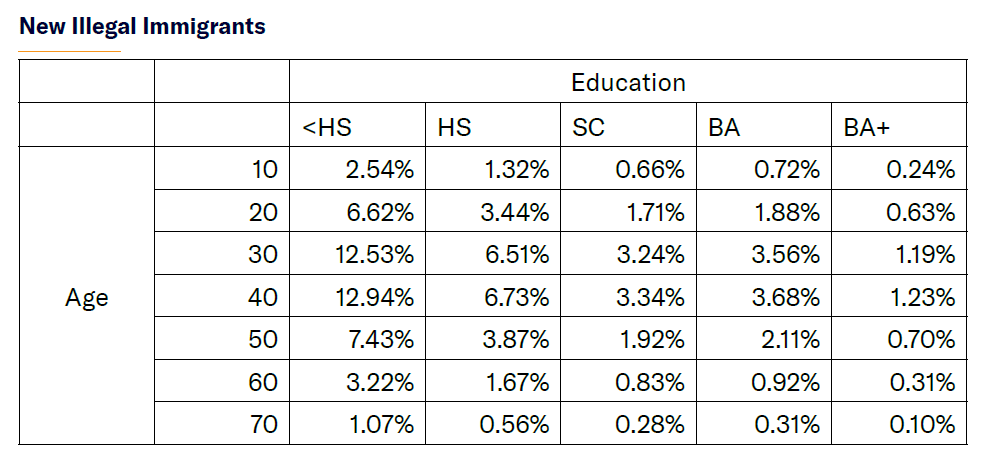
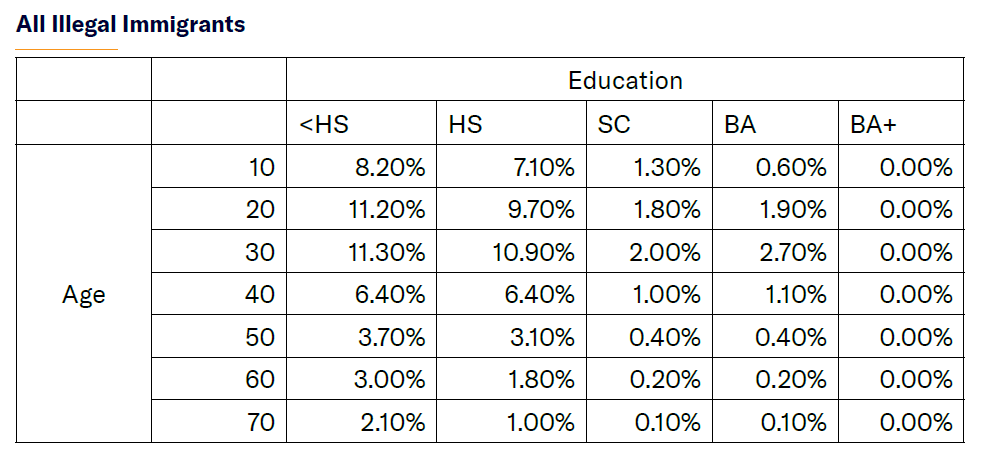
Immigrants by Race
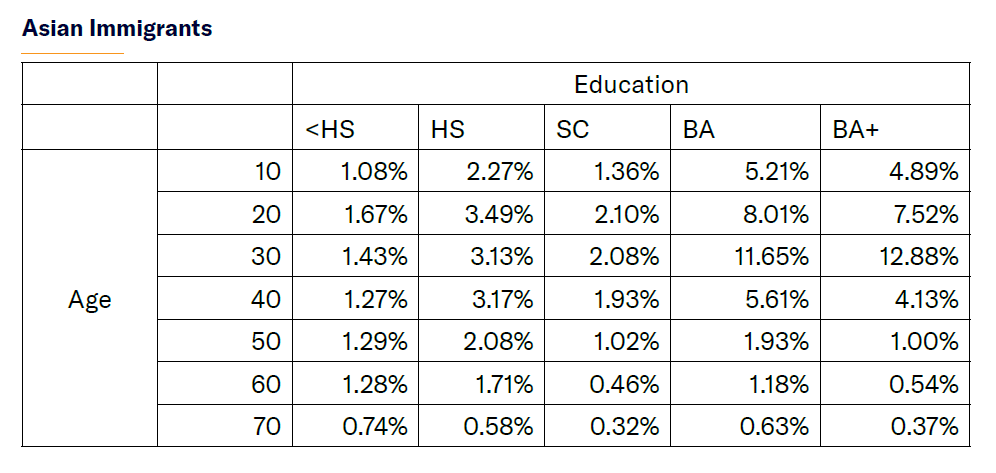
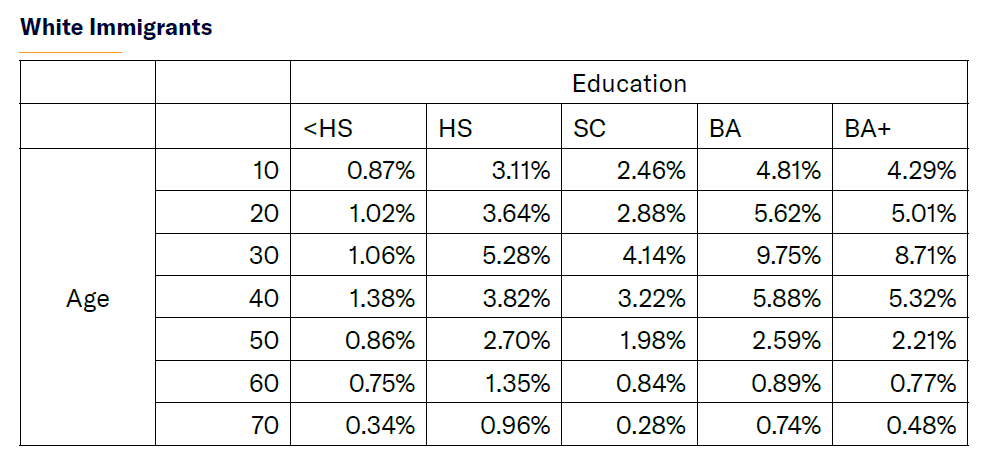
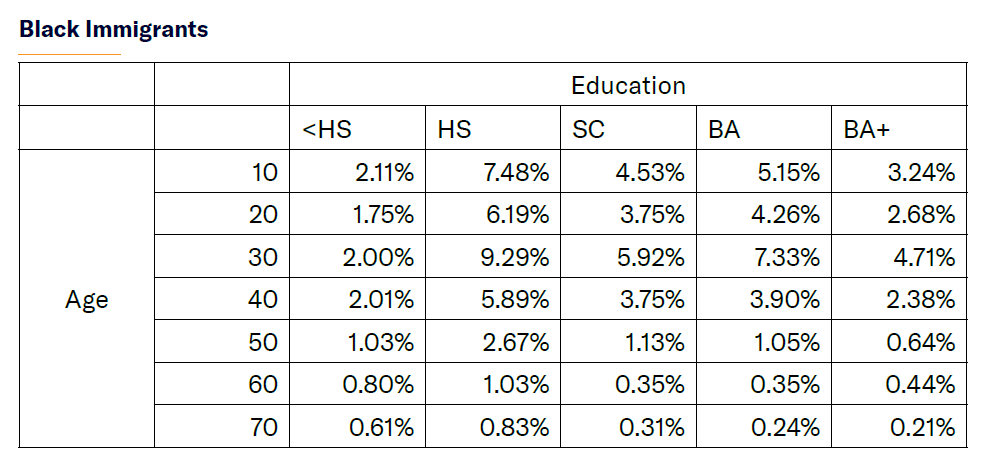
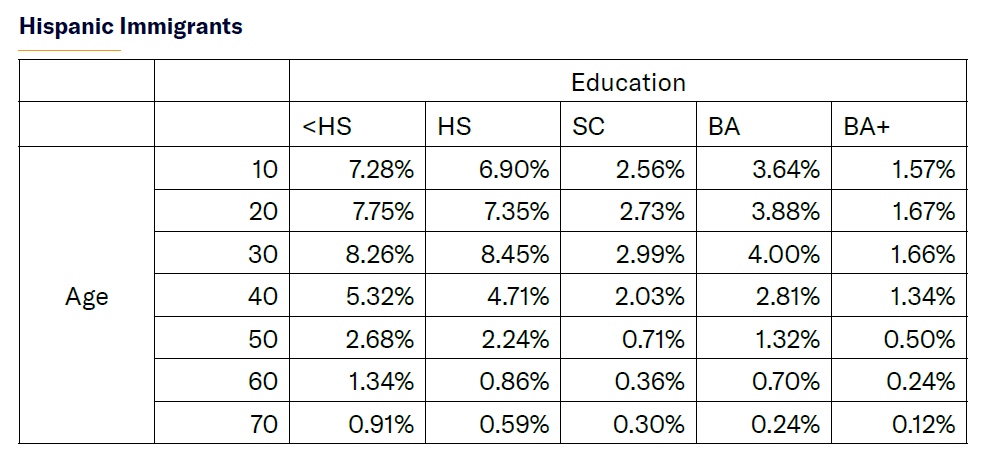
Immigrants by Region of Origin
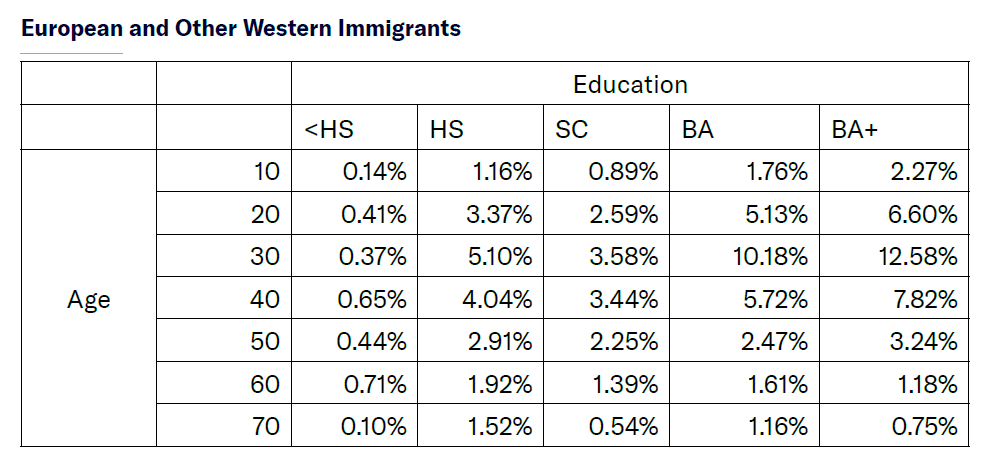
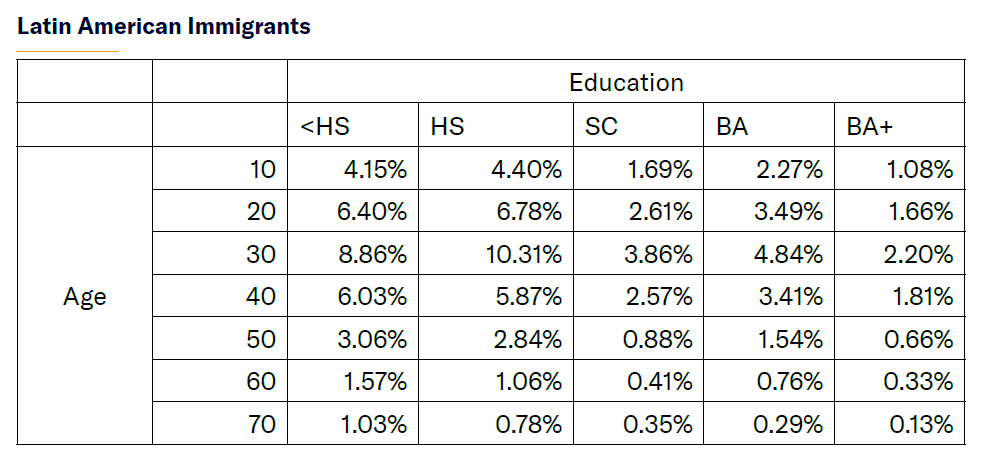
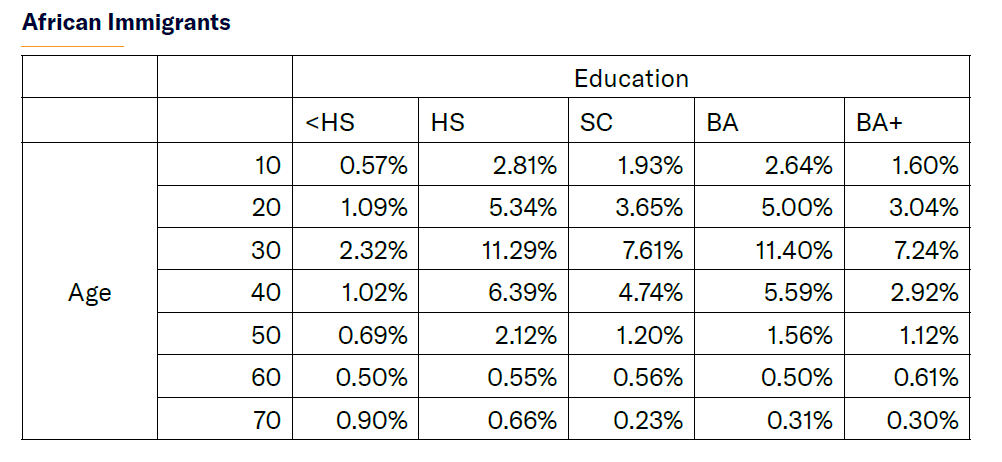
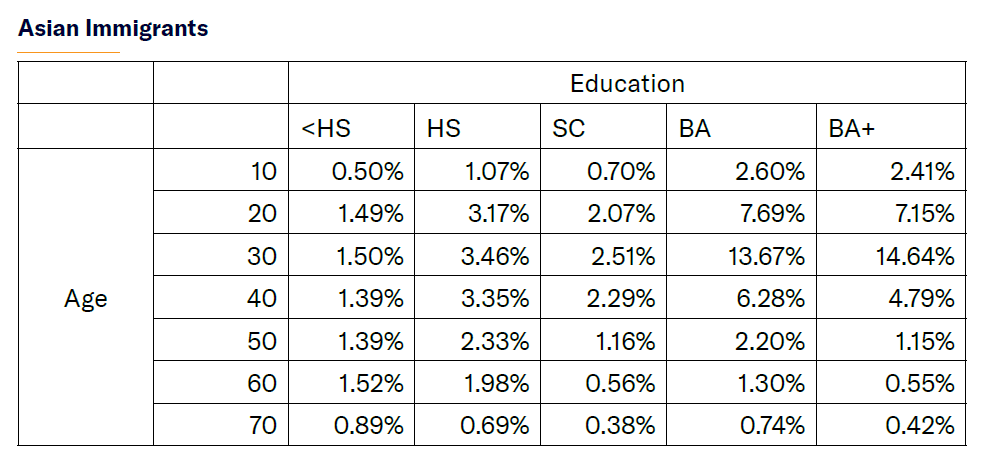
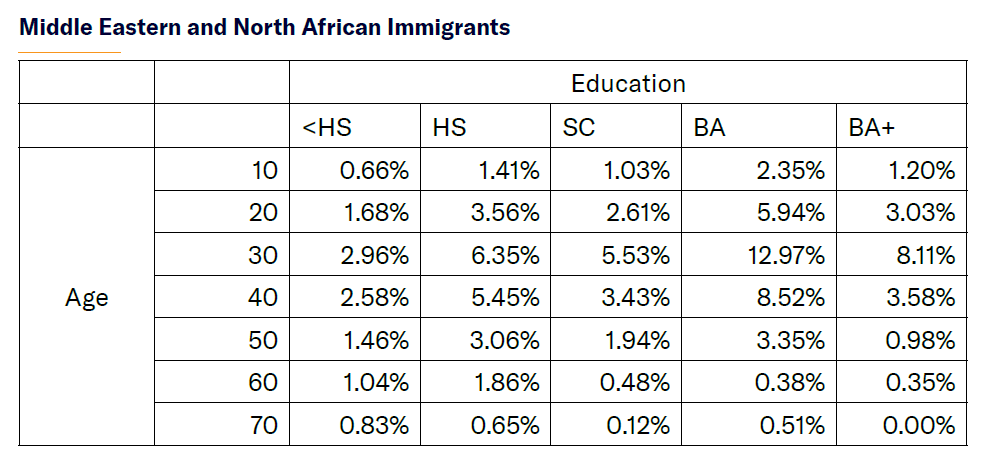
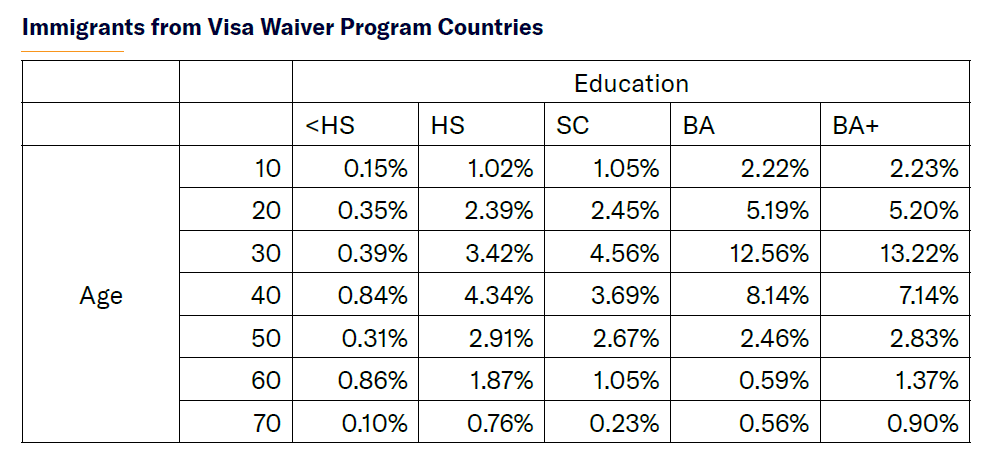
Endnotes
Photo: Ariel Skelley / Photodisc via Getty Images
Are you interested in supporting the Manhattan Institute’s public-interest research and journalism? As a 501(c)(3) nonprofit, donations in support of MI and its scholars’ work are fully tax-deductible as provided by law (EIN #13-2912529).