

If you are wondering whether Manhattan Associates is trading at a fair price or not, it helps to step back and look at what the current share price is really implying about the business. The stock closed at US$148.26, with a 7 day return of 11.2%, a 30 day return of a 1.8% decline, a year to date return of an 11.4% decline, and a 1 year return of a 13.5% decline, which may have caught the attention of investors thinking about risk and reward. These moves sit against a backdrop where longer term returns of 3.7% over 3 years and 25.2% over 5 years offer additional context on how sentiment has shifted over time. That mix of shorter term weakness and longer term gains can influence how investors think about what counts as a reasonable price today. On our framework, Manhattan Associates has a valuation score of 3 out of 6, with one point for each check where the shares look undervalued. We will look at what that means using several valuation approaches before finishing with a broader way to judge whether the current price makes sense.
Find out why Manhattan Associates’s -13.5% return over the last year is lagging behind its peers.
Approach 1: Manhattan Associates Discounted Cash Flow (DCF) Analysis
A Discounted Cash Flow, or DCF, model takes projected future cash flows and then discounts them back into today’s dollars to estimate what the business might be worth at present.
For Manhattan Associates, the model uses last twelve months Free Cash Flow of about $379.2 million as a starting point, then applies analyst estimates for the next few years along with extrapolated figures beyond that. By 2030, projected Free Cash Flow is $741.6 million, with a 2 Stage Free Cash Flow to Equity approach used to reflect both nearer term and longer term expectations.
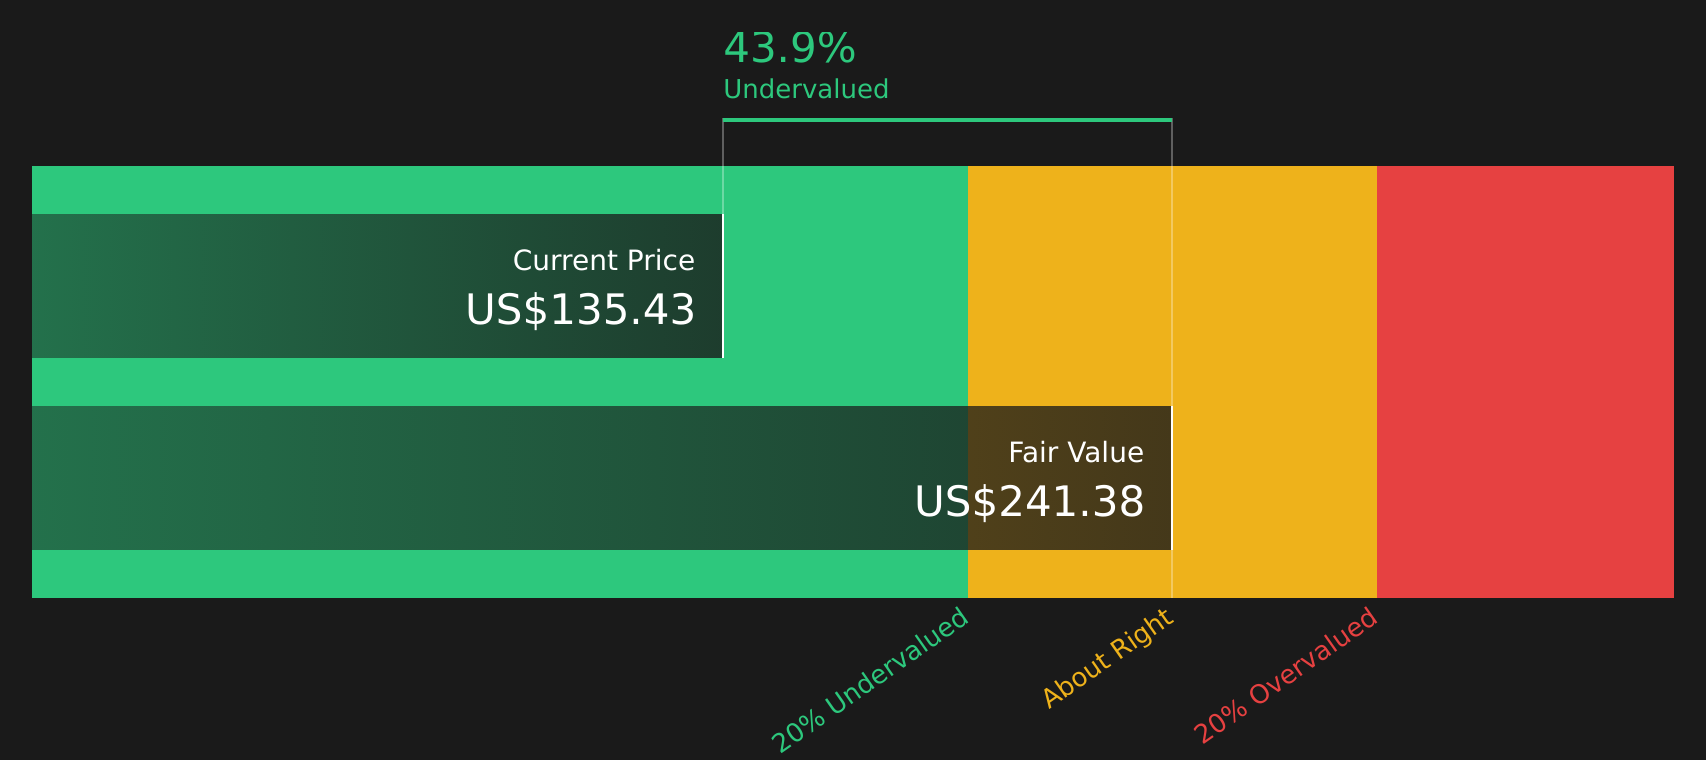
Bringing all those projected cash flows back to today, the model arrives at an estimated intrinsic value of about $236.75 per share. Compared with the recent share price of $148.26, the DCF output suggests a 37.4% discount. This indicates that the shares are trading below this model’s estimate of fair value.
Result: UNDERVALUED
Our Discounted Cash Flow (DCF) analysis suggests Manhattan Associates is undervalued by 37.4%. Track this in your watchlist or portfolio, or discover 49 more high quality undervalued stocks.
 MANH Discounted Cash Flow as at Mar 2026
Approach 2: Manhattan Associates Price vs Earnings
For profitable companies, the P/E ratio is a useful shortcut because it links what you pay for each share to the earnings that business is currently generating. Investors usually accept a higher P/E when they expect stronger earnings growth or see the company as lower risk, and they look for a lower P/E when growth expectations are more modest or perceived risk is higher.
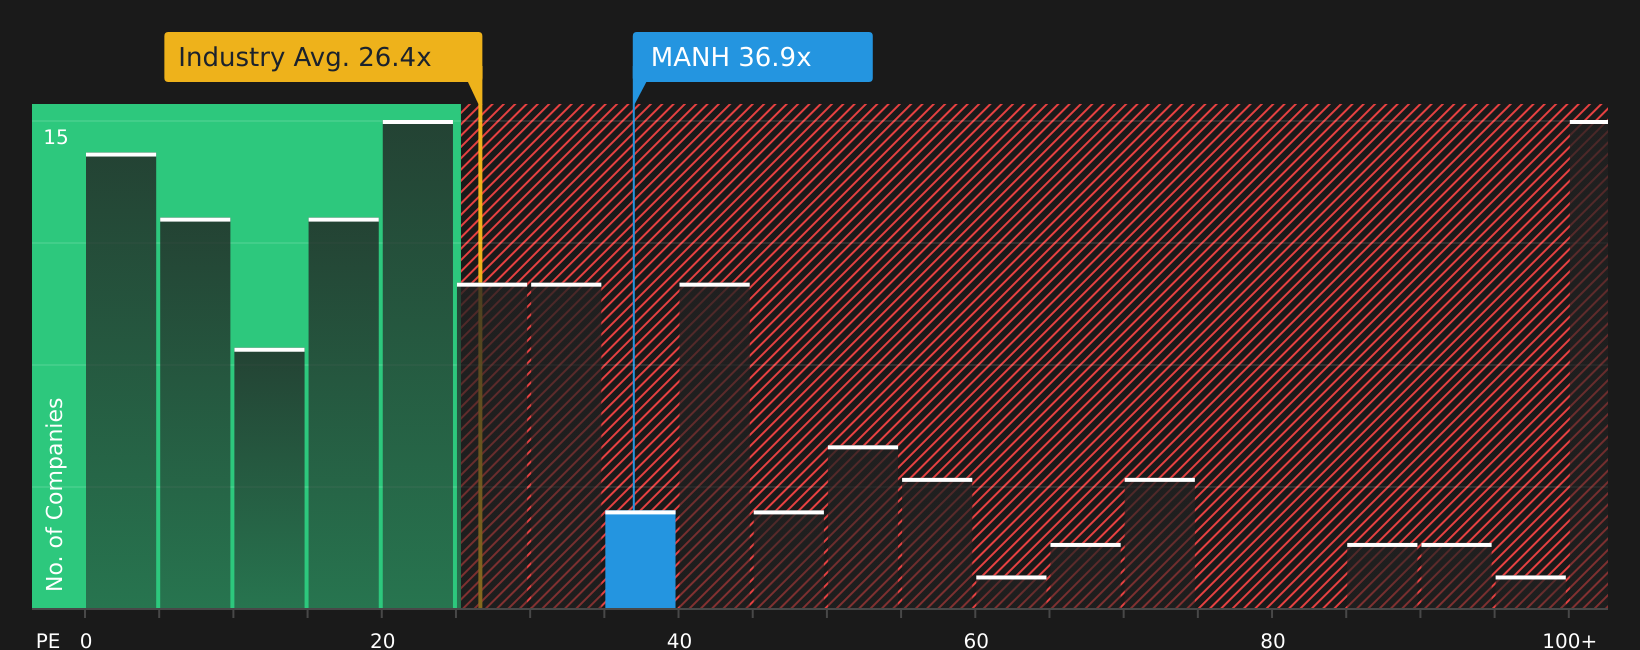
Manhattan Associates currently trades on a P/E of 40.34x. That sits above both the Software industry average P/E of 26.44x and a peer group average of 33.62x, which suggests the market is currently putting a richer earnings multiple on the stock than on many comparable names.
Simply Wall St’s Fair Ratio for Manhattan Associates is 26.98x. This is a proprietary estimate of what a P/E might look like given the company’s earnings growth profile, profit margins, risk factors, market value and its Software industry membership. Because it blends these company specific drivers rather than relying only on broad peer or industry comparisons, the Fair Ratio can be a more tailored benchmark for “normal” pricing. Set against the current P/E of 40.34x, the Fair Ratio points to the shares looking overvalued on this metric.
Result: OVERVALUED
 NasdaqGS:MANH P/E Ratio as at Mar 2026
P/E ratios tell one story, but what if the real opportunity lies elsewhere? Start investing in legacies, not executives. Discover our 18 top founder-led companies.
Upgrade Your Decision Making: Choose your Manhattan Associates Narrative
Earlier we mentioned that there is an even better way to understand valuation. Let us introduce Narratives, which simply means you pair your view of Manhattan Associates’ story with your own estimates for future revenue, earnings and margins. You then link that to a fair value, and compare that fair value to today’s price using an easy tool on Simply Wall St’s Community page that updates automatically when new information like news or earnings arrives. One investor might side with a higher fair value such as US$240 based on stronger growth and margin assumptions, while another might lean toward a lower fair value such as US$160 based on more cautious assumptions. Both can clearly see how their story and numbers line up with the current share price.
Do you think there’s more to the story for Manhattan Associates? Head over to our Community to see what others are saying!
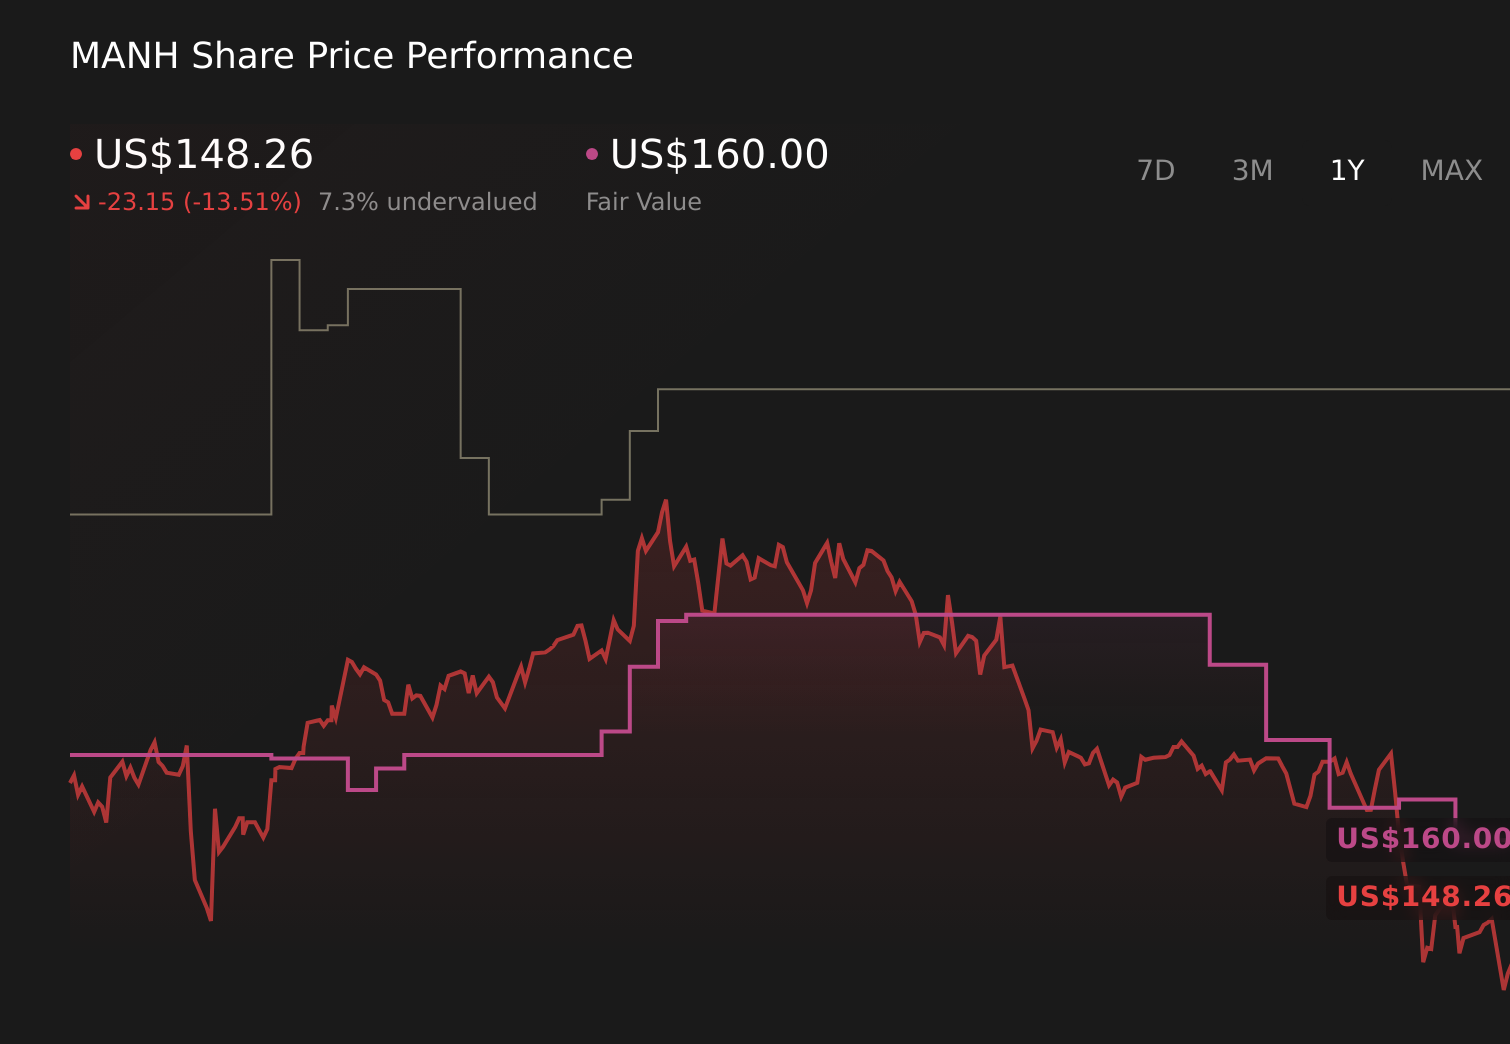 NasdaqGS:MANH 1-Year Stock Price Chart
This article by Simply Wall St is general in nature. We provide commentary based on historical data
and analyst forecasts only using an unbiased methodology and our articles are not intended to be financial advice. It does not constitute a recommendation to buy or sell any stock, and does not take account of your objectives, or your
financial situation. We aim to bring you long-term focused analysis driven by fundamental data.
Note that our analysis may not factor in the latest price-sensitive company announcements or qualitative material.
Simply Wall St has no position in any stocks mentioned.
New: Manage All Your Stock Portfolios in One Place
We’ve created the ultimate portfolio companion for stock investors, and it’s free.
• Connect an unlimited number of Portfolios and see your total in one currency
• Be alerted to new Warning Signs or Risks via email or mobile
• Track the Fair Value of your stocks
Have feedback on this article? Concerned about the content? Get in touch with us directly. Alternatively, email editorial-team@simplywallst.com