

Wondering if Manhattan Associates at around US$138 per share still offers value, or if most of the opportunity has already been priced in. The stock is down about 3.6% over the past week, 1.6% over the past month, and 17.4% year to date, with a 20.8% decline over the last year and a 19.5% gain over five years. These moves can change how investors think about both risk and opportunity. Recent coverage has focused on Manhattan Associates as a key player in supply chain and warehouse management software, highlighting how its role in logistics and retail operations keeps it on many investors’ watchlists. At the same time, broader conversations around software valuations and interest rate expectations have influenced sentiment toward technology names generally. Against that backdrop, Manhattan Associates currently has a valuation score of 2 out of 6. This raises useful questions about how different valuation methods judge the stock and sets up a closer look at those methods, along with a more comprehensive way to think about value later in this article.
Manhattan Associates scores just 2/6 on our valuation checks. See what other red flags we found in the full valuation breakdown.
Approach 1: Manhattan Associates Discounted Cash Flow (DCF) Analysis
A Discounted Cash Flow model looks at the cash Manhattan Associates is expected to generate in the future, then discounts those projected cash flows back to today to estimate what the business could be worth right now.
Manhattan Associates currently reports last twelve months free cash flow of about $379.2 million. Using a 2 Stage Free Cash Flow to Equity model based on analyst inputs and further projections by Simply Wall St, free cash flow is projected to reach about $719.2 million in 2030. Interim years between 2026 and 2035 are also modeled with specific annual free cash flow estimates in the hundreds of millions of dollars.
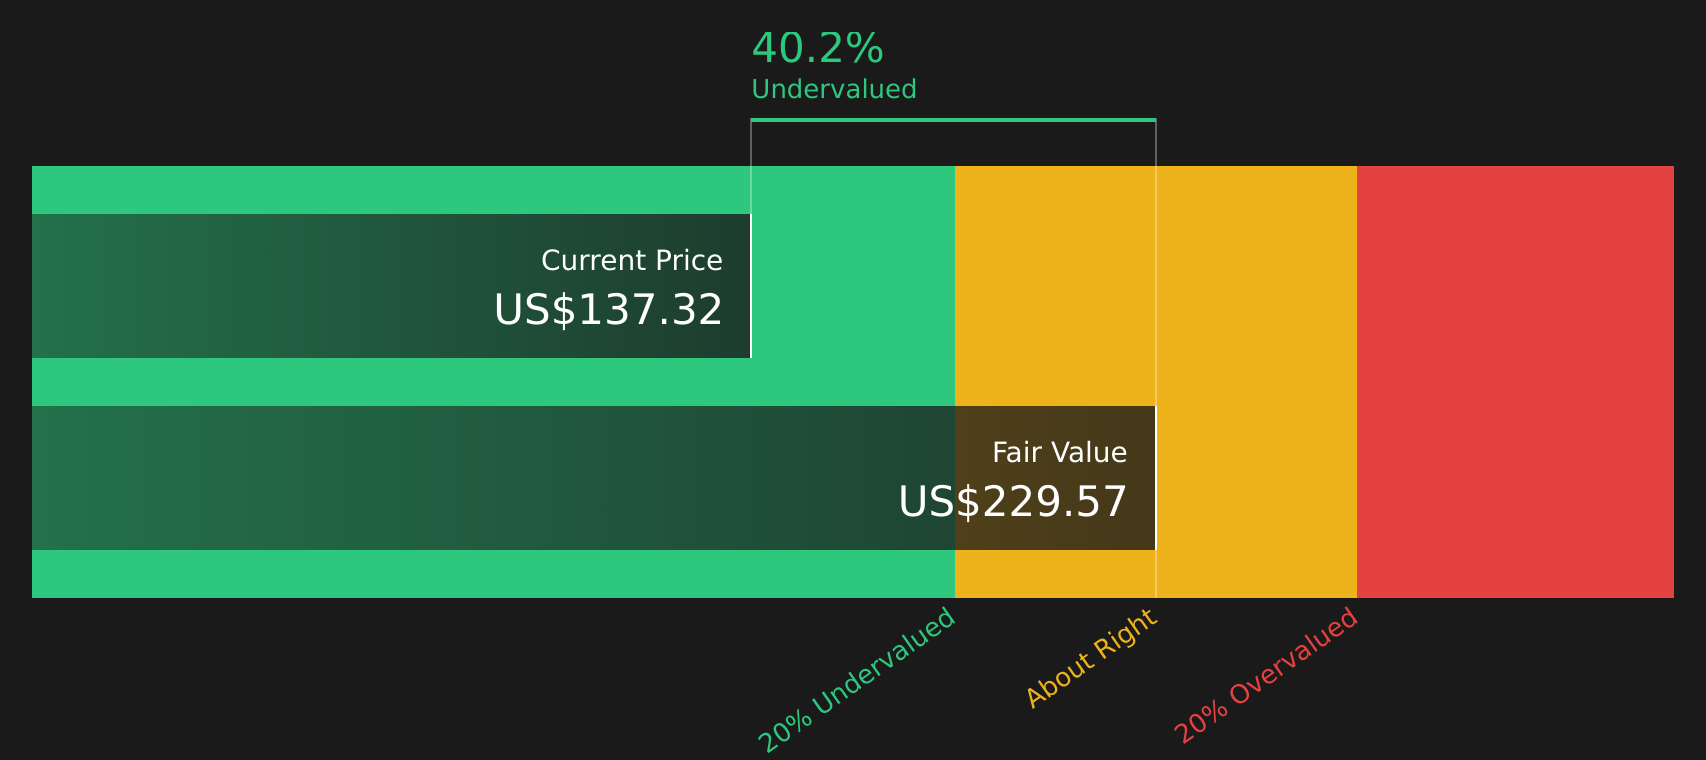
Bringing all those projected cash flows back to today results in an estimated intrinsic value of about $229.13 per share. Compared with a current share price around $138, the model implies the stock is about 39.7% undervalued on this set of assumptions.
Result: UNDERVALUED
Our Discounted Cash Flow (DCF) analysis suggests Manhattan Associates is undervalued by 39.7%. Track this in your watchlist or portfolio, or discover 49 more high quality undervalued stocks.
 MANH Discounted Cash Flow as at Mar 2026
Approach 2: Manhattan Associates Price vs Earnings
For a profitable software company, the P/E ratio is a useful yardstick because it ties the share price directly to the earnings that support it. What investors are really judging is how much they are willing to pay for each dollar of earnings, given their expectations for growth and the risks they see in the business.
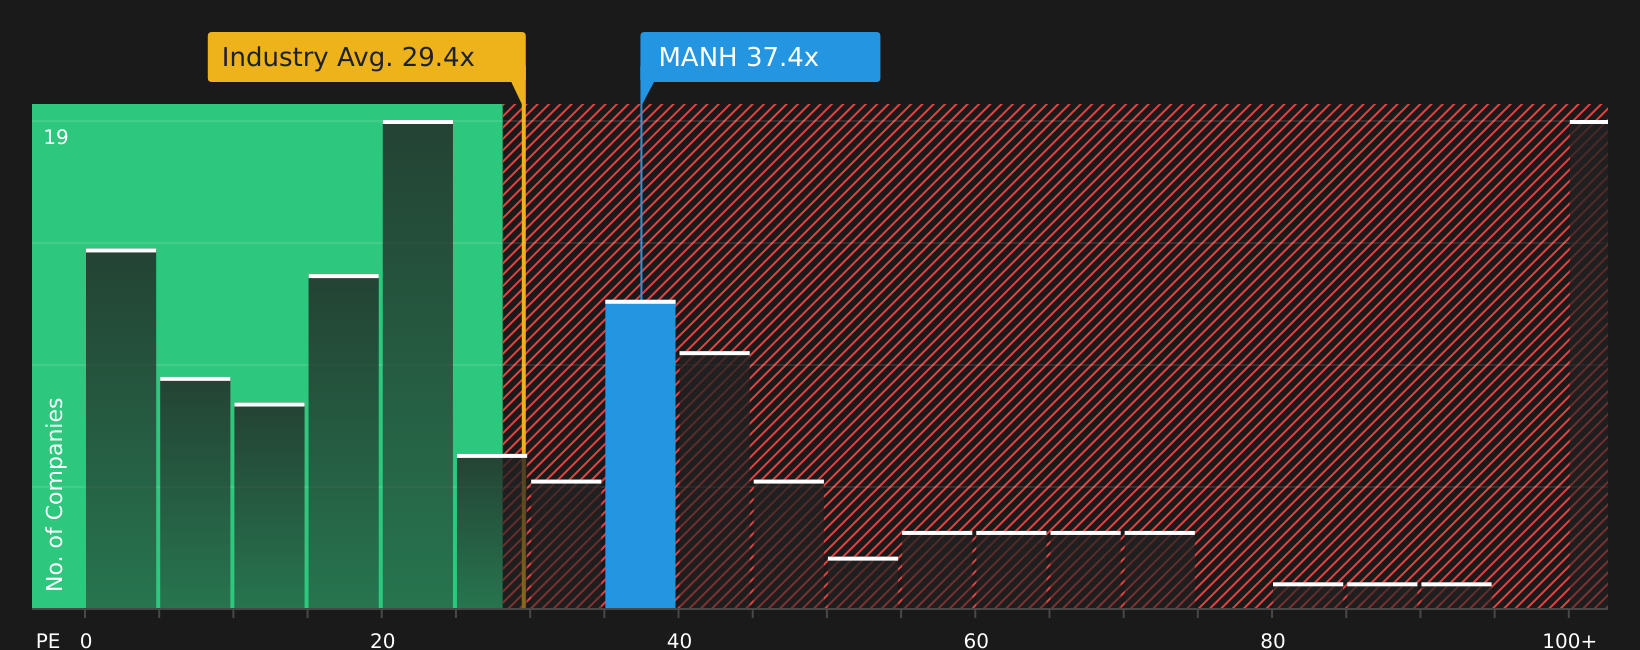
Higher expected growth and lower perceived risk usually support a higher, or more generous, P/E ratio, while slower growth or higher risk tend to justify a lower multiple. Manhattan Associates currently trades on a P/E of about 37.6x. That sits above both the Software industry average of about 29.4x and the peer group average of about 28.4x, which suggests the market is paying a premium compared with those simple benchmarks.
Simply Wall St’s Fair Ratio is designed to go a step further. It estimates what a more tailored P/E might look like for Manhattan Associates, given factors such as earnings growth, profit margins, industry, market cap and risk profile. For Manhattan Associates, the Fair Ratio is 26.8x, which is meaningfully below the current 37.6x. On this metric, the shares screen as expensive relative to what the Fair Ratio implies.
Result: OVERVALUED
 NasdaqGS:MANH P/E Ratio as at Mar 2026
P/E ratios tell one story, but what if the real opportunity lies elsewhere? Start investing in legacies, not executives. Discover our 20 top founder-led companies.
Upgrade Your Decision Making: Choose your Manhattan Associates Narrative
Earlier it was mentioned that there is an even better way to understand valuation. Narratives are introduced here as simple, story-driven models on Simply Wall St’s Community page, where you connect your view of Manhattan Associates to a clear forecast for revenue, earnings and margins, translate that into a Fair Value, and then compare it with the current share price. The system updates your Narrative as new news or earnings arrive, so you can see, for example, how a cautious view closer to the US$170 bearish target and a more optimistic view near the US$270 bullish target can both be valid starting points, depending on how you think the company’s supply chain, cloud and AI themes will play out over time.
Do you think there’s more to the story for Manhattan Associates? Head over to our Community to see what others are saying!
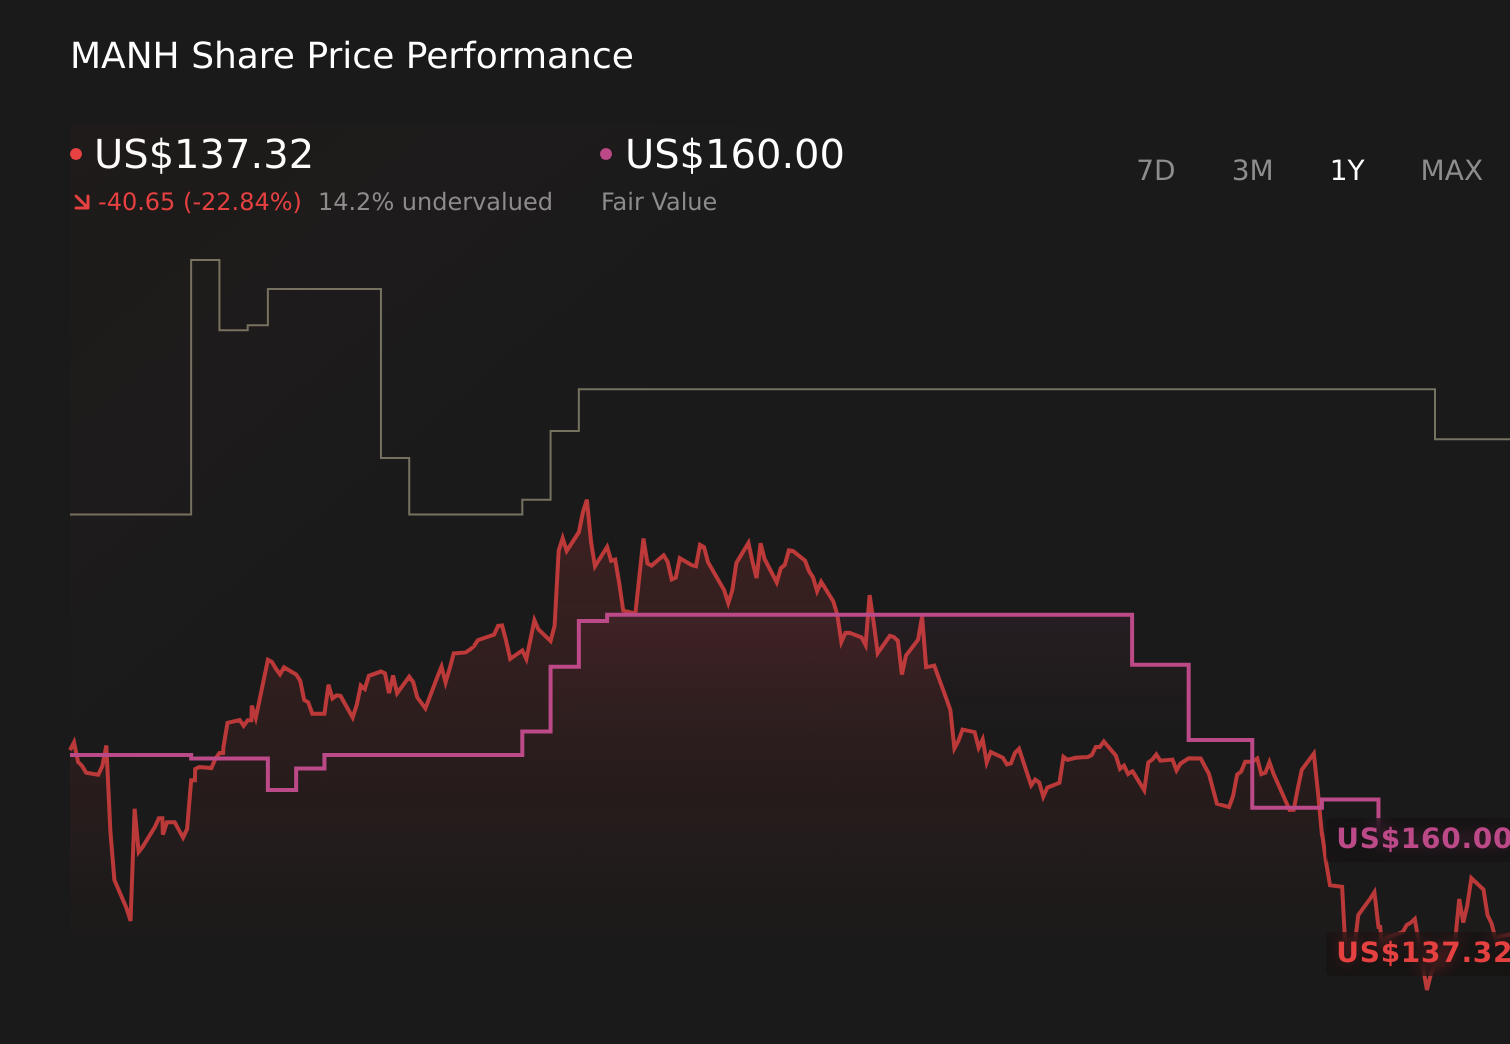 NasdaqGS:MANH 1-Year Stock Price Chart
This article by Simply Wall St is general in nature. We provide commentary based on historical data
and analyst forecasts only using an unbiased methodology and our articles are not intended to be financial advice. It does not constitute a recommendation to buy or sell any stock, and does not take account of your objectives, or your
financial situation. We aim to bring you long-term focused analysis driven by fundamental data.
Note that our analysis may not factor in the latest price-sensitive company announcements or qualitative material.
Simply Wall St has no position in any stocks mentioned.
New: Manage All Your Stock Portfolios in One Place
We’ve created the ultimate portfolio companion for stock investors, and it’s free.
• Connect an unlimited number of Portfolios and see your total in one currency
• Be alerted to new Warning Signs or Risks via email or mobile
• Track the Fair Value of your stocks
Have feedback on this article? Concerned about the content? Get in touch with us directly. Alternatively, email editorial-team@simplywallst.com