

Manhattan Associates (MANH) opened 2026 with Q1 revenue of US$282.2 million and basic EPS of US$0.83, setting the tone for how its profit engine is carrying into the new year. Over recent quarters the company has seen revenue move from US$262.8 million in Q1 2025 to US$270.4 million in Q4 2025 and now US$282.2 million, while basic EPS has ranged from US$0.86 to US$0.97 over that period and sits at US$0.83 this quarter, putting the focus squarely on how efficiently that top line is being converted into profit. Against that backdrop, investors are likely to pay close attention to margin resilience as they interpret what this latest set of numbers signals for the rest of the year.
See our full analysis for Manhattan Associates.
With the headline figures in place, the next step is to see how these results line up with the key narratives around Manhattan Associates, highlighting where the story is supported by the numbers and where expectations might need a reset.
See what the community is saying about Manhattan Associates
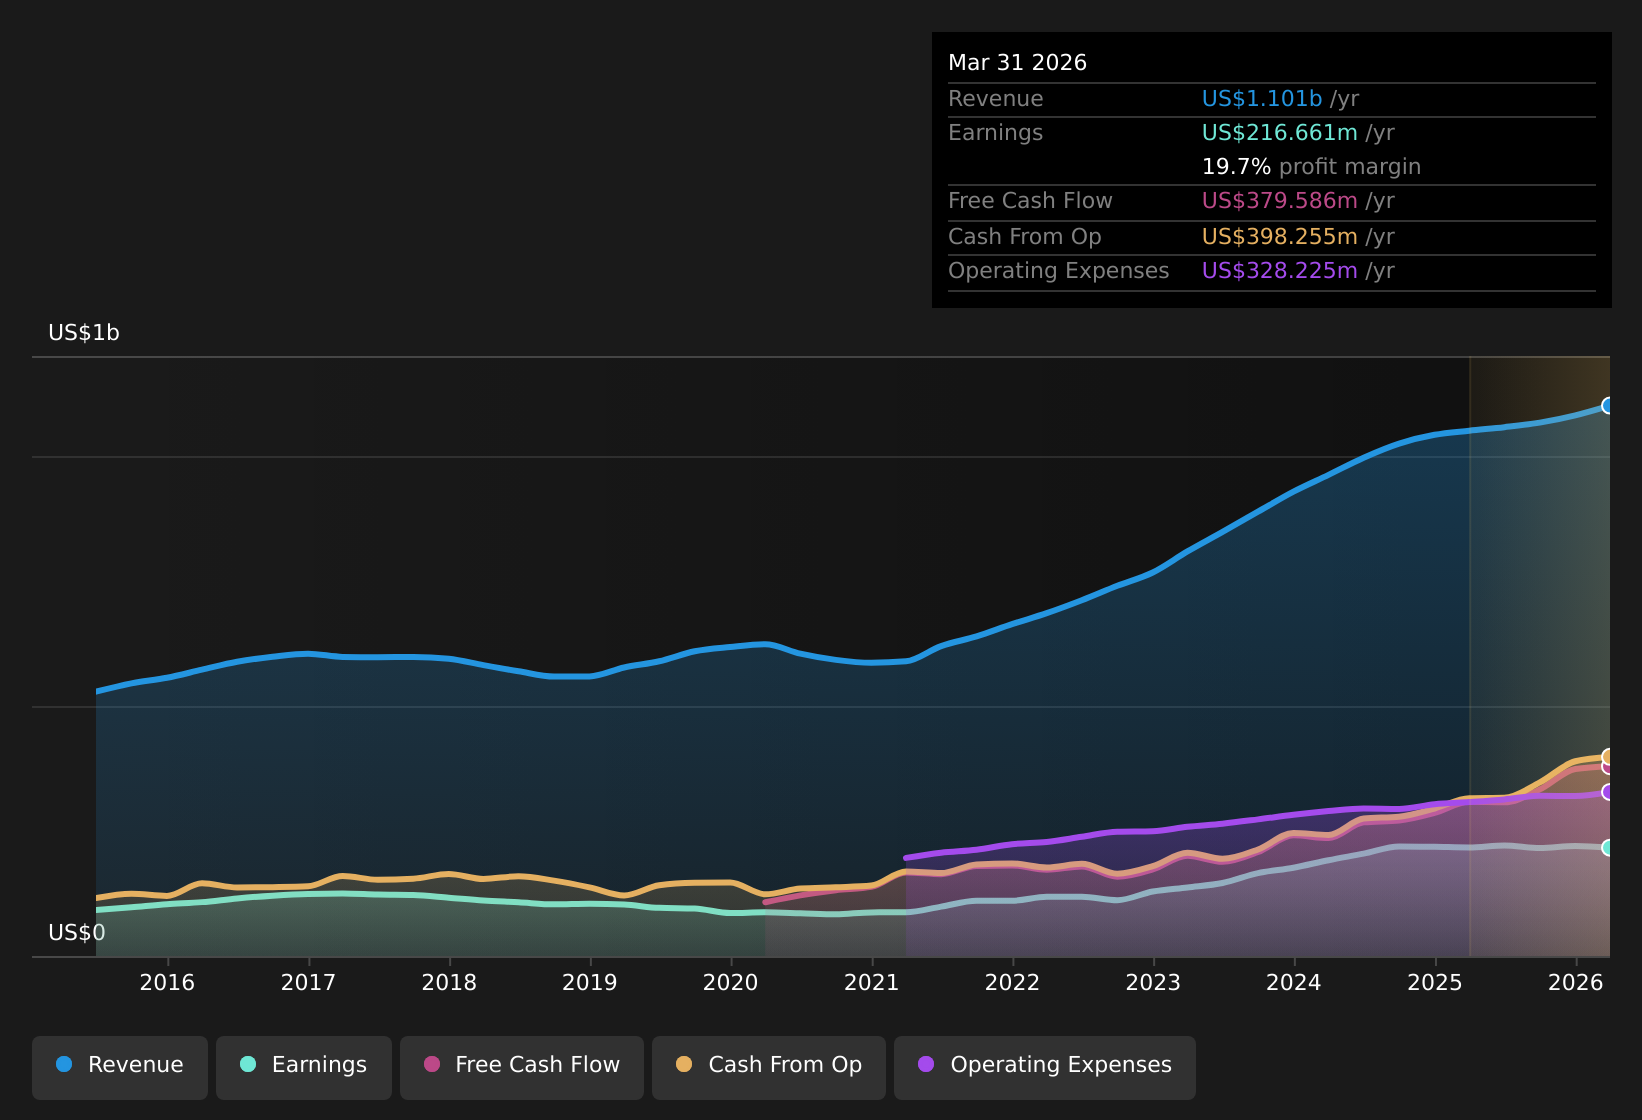 NasdaqGS:MANH Earnings & Revenue History as at Apr 2026 Profit margins cool from 20.7% to 19.7% Over the last 12 months, Manhattan Associates converted US$1.1b in revenue into US$216.7 million of net income, which works out to a 19.7% net margin compared with 20.7% a year earlier. Supporters of the bullish view point to investment in cloud and AI as a path to higher margins over time. However, the current 19.7% margin and Q1 2026 net income of US$49.3 million indicate that profitability is steady rather than clearly expanding right now.
The bullish narrative expects margins to move higher, but trailing figures and recent quarterly net income between US$48.0 million and US$58.6 million over the last six quarters suggest investors are still waiting for that margin lift to show up in reported numbers. With basic EPS over the last year at US$3.60 versus quarterly EPS ranging from US$0.79 to US$0.97 across recent periods, the story so far is one of consistent profitability that has not yet matched the margin gains bulls talk about.
Bulls argue that today’s cloud momentum could turn this small margin dip into the starting point for future expansion, which is why they focus so heavily on the longer term rather than a single quarter. 🐂 Manhattan Associates Bull Case
Revenue at US$1.1b trails five year EPS trend Trailing 12 month revenue sits at about US$1.1b, while basic EPS over that same period is US$3.60 and five year earnings growth averaged 18.7% per year, even though the most recent year showed weaker earnings than that longer trend. Critics in the bearish camp argue that macro and sales cycle risks can weigh on growth, and the recent pattern of quarterly net income between US$48.0 million and US$58.6 million and quarterly revenue between US$255.8 million and US$282.2 million gives them data to argue that earnings momentum has cooled compared with that 18.7% five year pace.
With net profit margin easing from 20.7% to 19.7% while TTM revenue moved from US$1.04b to about US$1.10b, bears see a risk that higher costs or longer implementations keep growth from matching the stronger historical run rate. Forecast earnings growth of about 13.25% per year, alongside revenue growth of 7.7% per year, is still positive but sits below the five year earnings trend, which aligns with the more cautious narrative about a slower next phase.
Skeptics looking at these growth rates versus history see enough friction to question how easily Manhattan Associates can repeat its past earnings trajectory. 🐻 Manhattan Associates Bear Case
Premium 39x P/E and DCF fair value gap The shares trade on a trailing P/E of about 39x at a price of US$142.88, compared with a peer average of 25.4x and US software industry average of 30.6x, while a DCF fair value of about US$233.77 suggests a large gap between this model and the market price. What stands out for both bullish and bearish investors is the tension between that premium P/E and the DCF fair value. The 39x multiple reflects how the market is pricing in quality and consistency, while the DCF fair value and an analyst target of US$188.36 indicate more upside than the current US$142.88 price reflects.
On one side, the higher than peer P/E sits against a year where net profit margin slipped from 20.7% to 19.7%, which bears cite as a reason to question paying a premium. On the other, bulls point to forecast earnings growth of around 13.25% per year and the DCF fair value of US$233.77 as support for the view that the current price still leaves room between market expectations and modeled value. Next Steps
To see how these results tie into long-term growth, risks, and valuation, check out the full range of community narratives for Manhattan Associates on Simply Wall St. Add the company to your watchlist or portfolio so you’ll be alerted when the story evolves.
If this mix of bullish and cautious signals leaves you unsure, that is a useful signal in itself. Move quickly to check the full picture and weigh the 2 key rewards
See What Else Is Out There
Manhattan Associates is delivering steady profits, but softer margins, moderated earnings momentum and a premium 39x P/E create tension between the story and the price.
If you are questioning that premium and want ideas where price and fundamentals look more aligned right now, compare it with 61 high quality undervalued stocks to quickly spot alternatives that may better fit your return expectations.
This article by Simply Wall St is general in nature. We provide commentary based on historical data
and analyst forecasts only using an unbiased methodology and our articles are not intended to be financial advice. It does not constitute a recommendation to buy or sell any stock, and does not take account of your objectives, or your
financial situation. We aim to bring you long-term focused analysis driven by fundamental data.
Note that our analysis may not factor in the latest price-sensitive company announcements or qualitative material.
Simply Wall St has no position in any stocks mentioned.
New: Manage All Your Stock Portfolios in One Place
We’ve created the ultimate portfolio companion for stock investors, and it’s free.
• Connect an unlimited number of Portfolios and see your total in one currency
• Be alerted to new Warning Signs or Risks via email or mobile
• Track the Fair Value of your stocks
Have feedback on this article? Concerned about the content? Get in touch with us directly. Alternatively, email editorial-team@simplywallst.com