

If you are wondering whether Manhattan Associates stock is now attractively priced or still demanding a premium, the recent share performance gives you a useful starting clue. The stock closed at US$161.12, with the price up 16.2% over the past week and 15.0% over the past month, even though the return over the last year declined 12.7% and the year to date return declined 3.7%. Those short term gains sit against a longer backdrop where the 3 year return declined 12.9% while the 5 year return stands at 18.4%. This context can influence how investors think about risk and reward, and moves like this often prompt questions about whether the recent strength is driven by changing expectations or simply a reset after prior weakness. Right now Manhattan Associates holds a valuation score of 2/6. The rest of this article will walk through what that score means across different valuation methods and point to a broader way to judge value that brings the full investment story together.
Manhattan Associates scores just 2/6 on our valuation checks. See what other red flags we found in the full valuation breakdown.
Approach 1: Manhattan Associates Discounted Cash Flow (DCF) Analysis
A Discounted Cash Flow model projects a company’s future cash flows and then discounts those projected amounts back to today, aiming to estimate what the business might be worth in present value terms.
For Manhattan Associates, the latest twelve month Free Cash Flow is about $386.8 million. Analyst estimates and subsequent extrapolations point to projected Free Cash Flow of $723.4 million by 2030, based on a 2 Stage Free Cash Flow to Equity model that blends analyst forecasts for the earlier years with Simply Wall St’s own estimates further out.
Discounting all those projected cash flows back to today results in an estimated intrinsic value of $237.68 per share. Compared with the recent share price of $161.12, this implies the stock is trading at roughly a 32.2% discount to that DCF estimate, indicating that the shares currently appear undervalued on this model alone.
Result: UNDERVALUED
Our Discounted Cash Flow (DCF) analysis suggests Manhattan Associates is undervalued by 32.2%. Track this in your watchlist or portfolio, or discover 47 more high quality undervalued stocks.
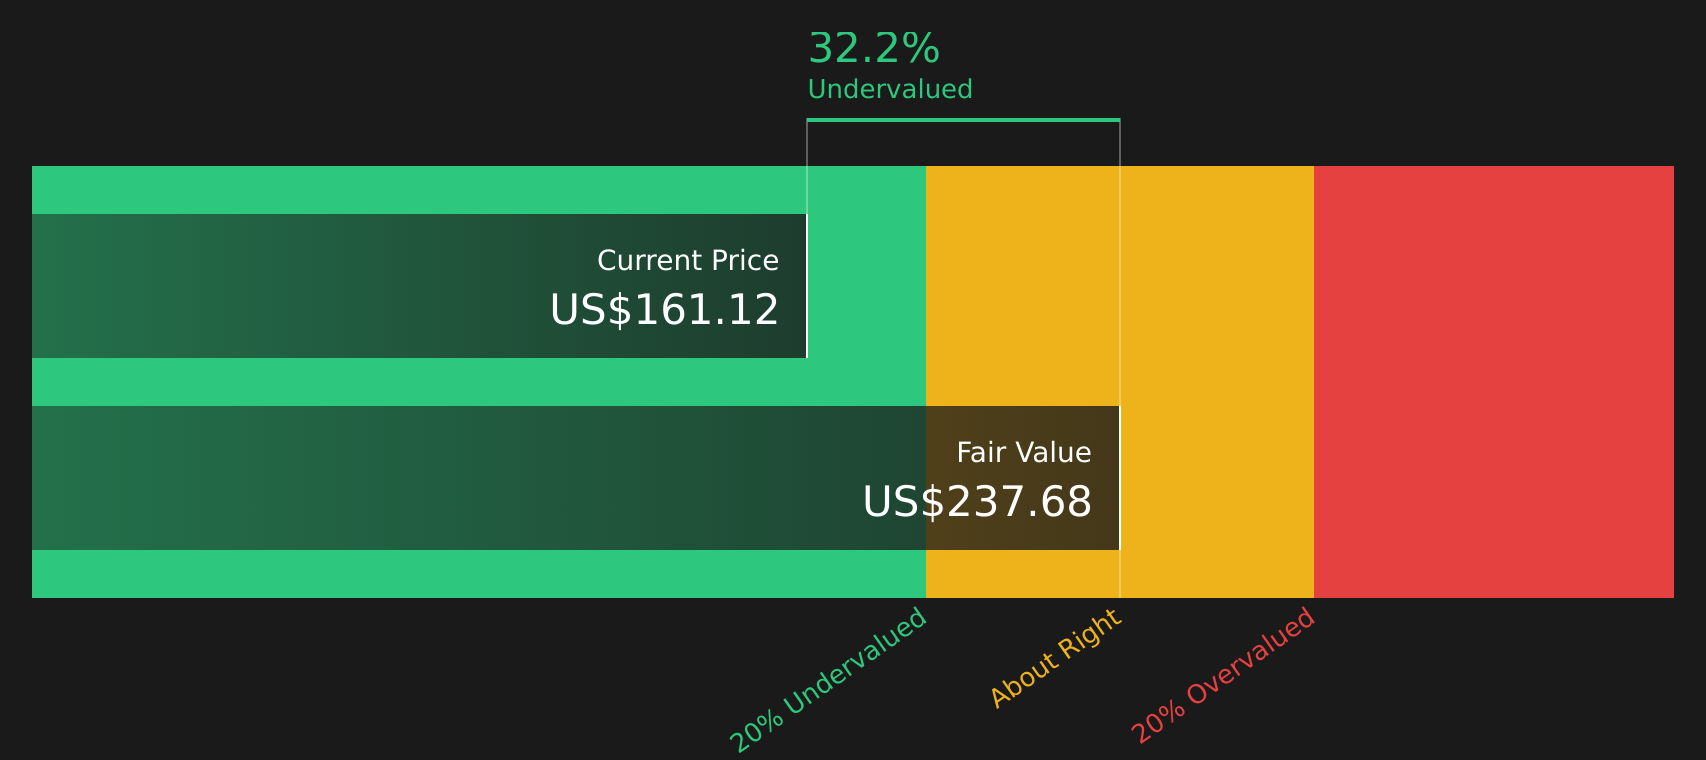 MANH Discounted Cash Flow as at Jun 2026
Approach 2: Manhattan Associates Price vs Earnings
The P/E ratio is a common way to look at valuation for profitable companies because it links what you pay, the share price, to what the company earns, its net profit. It gives you a quick sense of how many dollars investors are willing to pay today for each dollar of current earnings.
What counts as a “normal” P/E depends on how the market views a company’s growth potential and risk. Higher expected growth or lower perceived risk can justify a higher multiple, while lower growth or higher risk tend to support a lower one.
Manhattan Associates currently trades on a P/E of 44.0x, compared with the Software industry average of about 29.3x and a peer average of 34.4x. Simply Wall St’s Fair Ratio, which is its proprietary estimate of what the P/E “should” be given factors such as earnings growth, profit margins, industry, market cap and risk profile, is 26.9x.
The Fair Ratio is more tailored than a simple industry or peer comparison because it attempts to adjust for company specific characteristics rather than treating all Software stocks the same. On this basis, Manhattan Associates trades above its Fair Ratio, which points to the stock looking expensive on the P/E measure.
Result: OVERVALUED
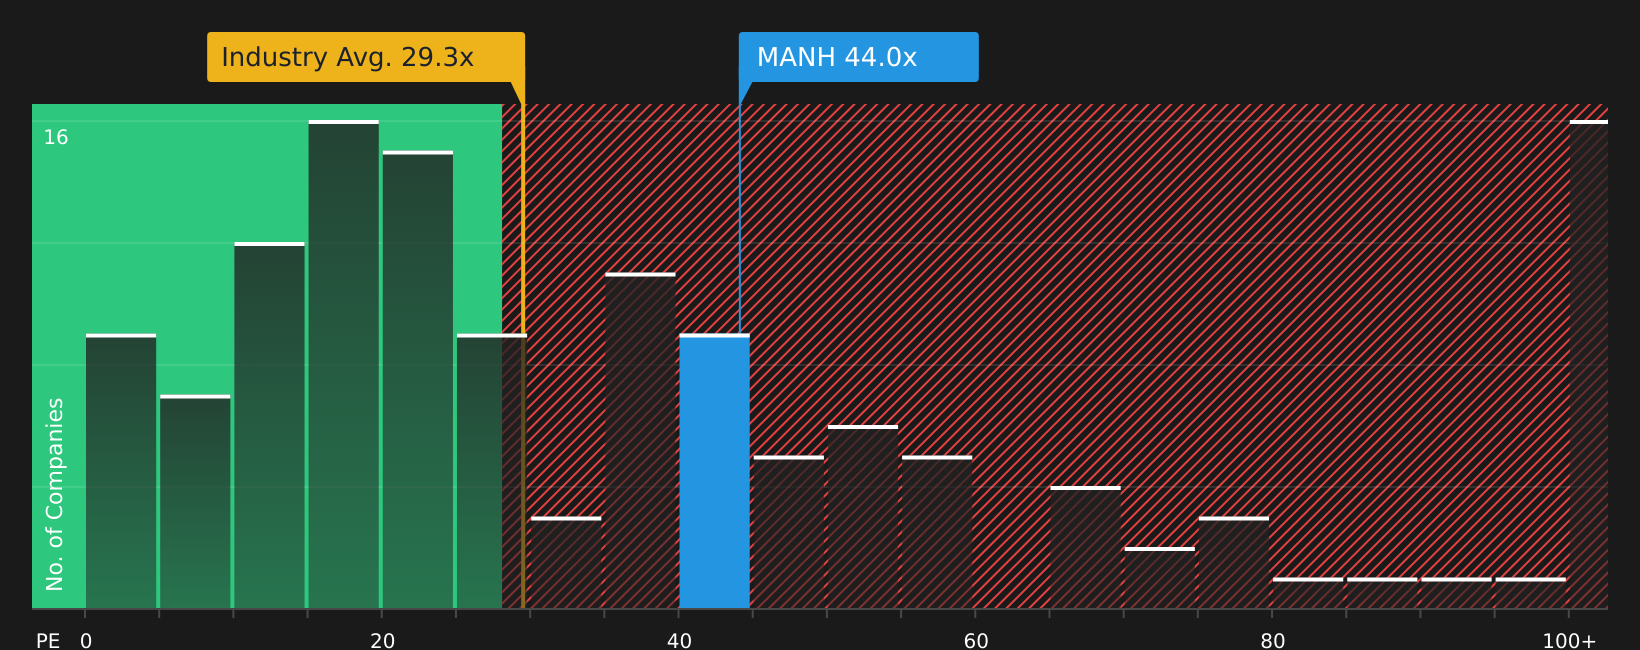 NasdaqGS:MANH P/E Ratio as at Jun 2026
P/E ratios tell one story, but what if the real opportunity lies elsewhere? Start investing in legacies, not executives. Discover our 20 top founder-led companies.
Upgrade Your Decision Making: Choose your Manhattan Associates Narrative
Earlier it was mentioned that there is an even better way to understand valuation. Narratives bring your view of Manhattan Associates together as a story behind the numbers by linking your assumptions on future revenue, earnings and margins to a financial forecast. This is then turned into a Fair Value that you can easily compare with the current share price on Simply Wall St’s Community page. Narratives are used by millions of investors, refresh automatically when new news or earnings are added, and can differ widely. For example, one investor might align with the lower Fair Value narrative around US$160.00, while another leans toward the higher end around US$240.00, helping each of them decide whether the stock looks closer to a buy, a hold or a sell in their own framework.
Do you think there’s more to the story for Manhattan Associates? Head over to our Community to see what others are saying!
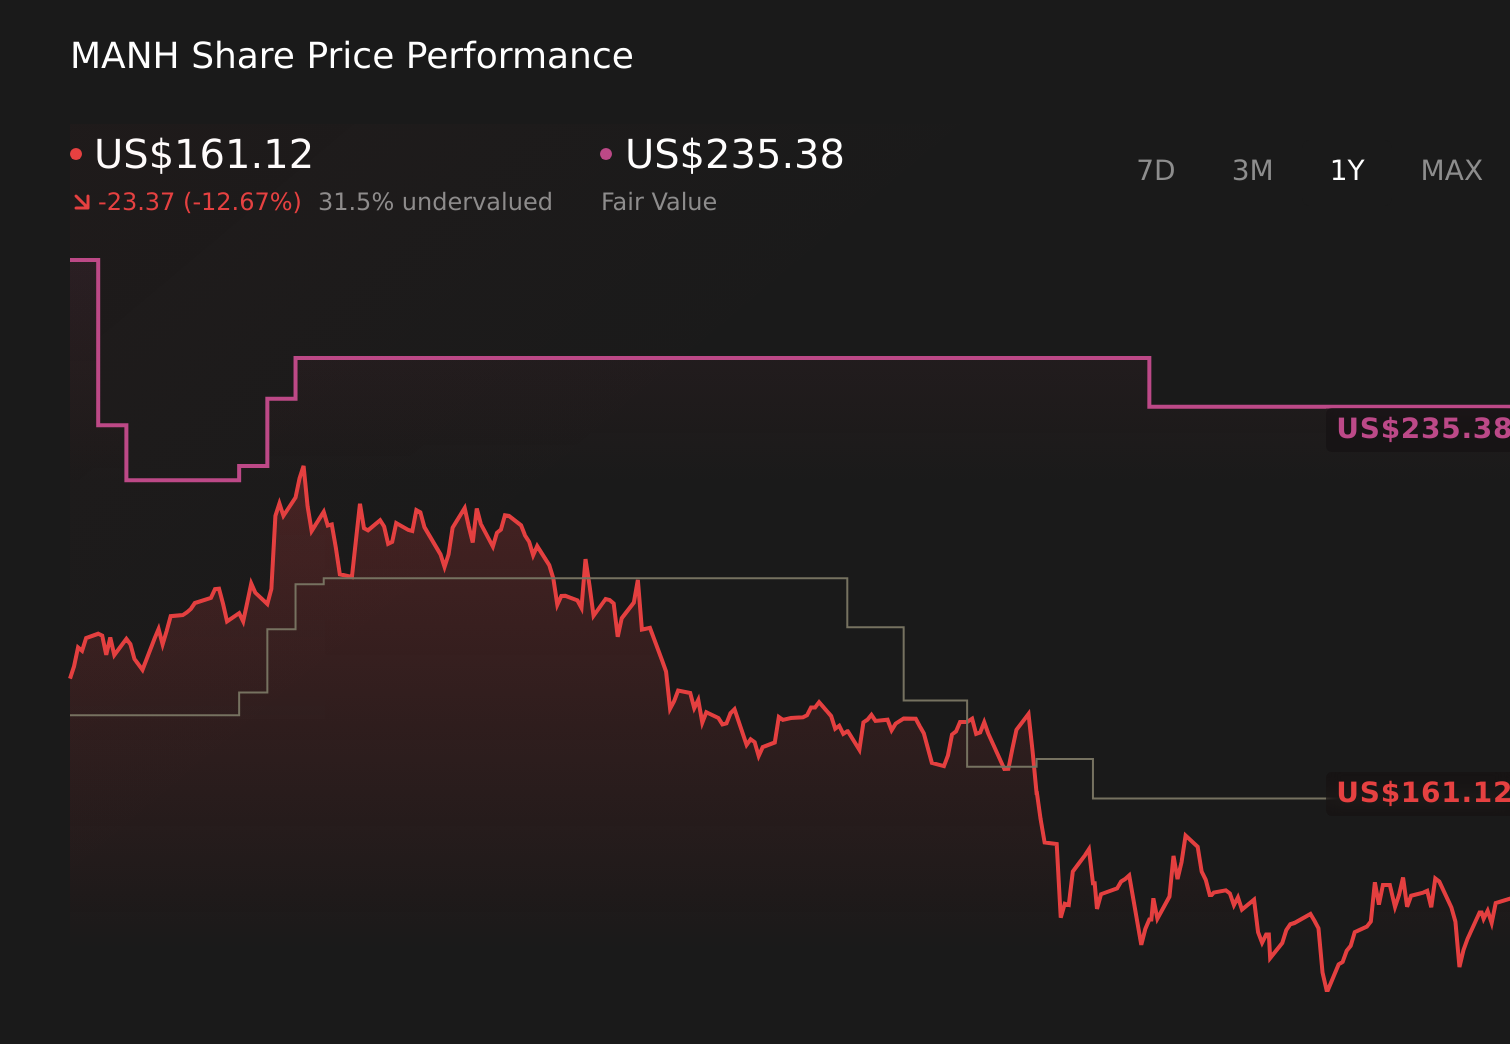 NasdaqGS:MANH 1-Year Stock Price Chart
This article by Simply Wall St is general in nature. We provide commentary based on historical data
and analyst forecasts only using an unbiased methodology and our articles are not intended to be financial advice. It does not constitute a recommendation to buy or sell any stock, and does not take account of your objectives, or your
financial situation. We aim to bring you long-term focused analysis driven by fundamental data.
Note that our analysis may not factor in the latest price-sensitive company announcements or qualitative material.
Simply Wall St has no position in any stocks mentioned.
New: Manage All Your Stock Portfolios in One Place
We’ve created the ultimate portfolio companion for stock investors, and it’s free.
• Connect an unlimited number of Portfolios and see your total in one currency
• Be alerted to new Warning Signs or Risks via email or mobile
• Track the Fair Value of your stocks
Have feedback on this article? Concerned about the content? Get in touch with us directly. Alternatively, email editorial-team@simplywallst.com