

Index removal puts Manhattan Associates in focus for investors
Manhattan Associates (MANH) was recently removed from the Russell 1000 Dynamic Index, an event that can prompt rebalancing by index trackers and influence short term trading patterns in the stock.
See our latest analysis for Manhattan Associates.
Beyond the index removal, Manhattan Associates has been in the spotlight with an upcoming second quarter 2026 results release and a separate law firm investigation into potential fiduciary issues. The stock’s 90 day share price return of 29.57% contrasts with a 1 year total shareholder return decline of 21.60%, which suggests momentum has recently picked up after a weaker longer term stretch.
If you are assessing how other technology focused opportunities are trading into similar news and earnings catalysts, it can be useful to scan 52 AI infrastructure stocks
The recent 90 day jump and Russell index exit leave Manhattan Associates at a crossroads: either accept today’s price after the rebound, or hold fire and wait. How does that choice stack up against what the current valuation implies?
Most Popular Narrative: 8% Overvalued
Compared with Manhattan Associates’ last close at $156.63, the most followed narrative fair value of $145 suggests the stock is pricing in a richer outlook than that model assumes.
Uncertain macroeconomic conditions and the volatile geopolitical environment could negatively impact Manhattan Associates’ services revenue, potentially slowing overall income growth and impacting net margins due to customer budgetary constraints shifting services work to future periods. The broader market’s unpredictable tariff environment may lead to volatility in inventory costs, influencing earnings as companies reconsider their purchasing commitments, potentially impacting Manhattan Associates’ sales pipeline and cloud bookings.
There is a very specific growth path behind that $145 figure. It blends steady top line expansion, firmer margins, and a premium earnings multiple. Curious which assumption really does the heavy lifting here? The full narrative lays out the exact revenue, profit and valuation mix that has to line up for this fair value to make sense.
Result: Fair Value of $145 (OVERVALUED)
Have a read of the narrative in full and understand what’s behind the forecasts.
However, Manhattan Associates could still surprise if cloud and services revenue remain solid and recent AI recognition translates into steadier demand and earnings support.
Find out about the key risks to this Manhattan Associates narrative.
Another View: SWS DCF model points to upside
The bearish fair value narrative pegs Manhattan Associates at $145, but the SWS DCF model tells a different story, with an estimated future cash flow value of $249.65 per share. That implies the current $156.63 price sits well below this estimate. Which lens do you trust more?
Look into how the SWS DCF model arrives at its fair value.
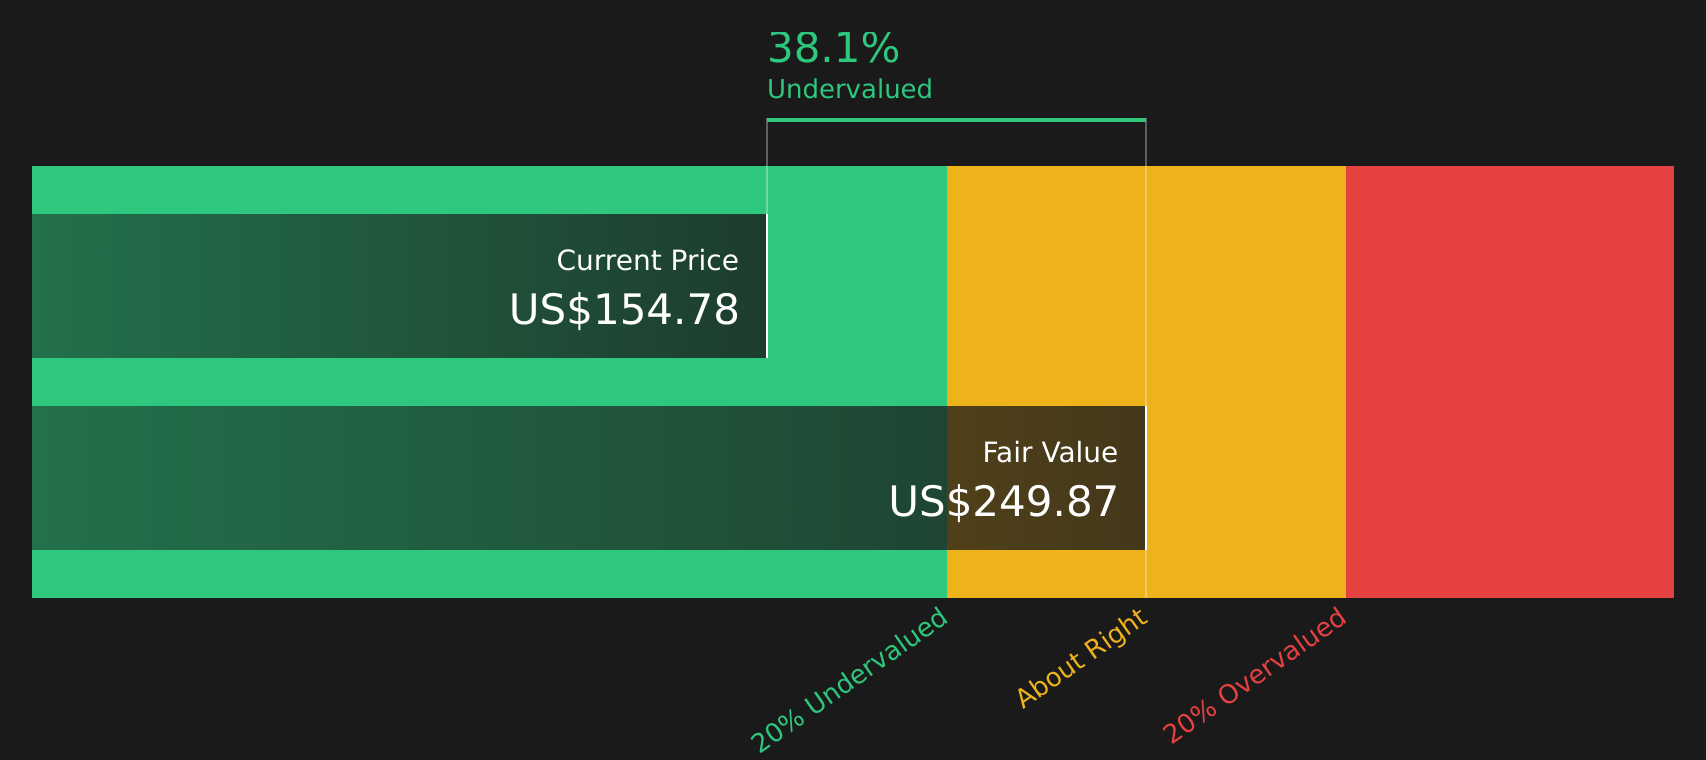 MANH Discounted Cash Flow as at Jul 2026
Simply Wall St performs a discounted cash flow (DCF) on every stock in the world every day (check out Manhattan Associates for example). We show the entire calculation in full. You can track the result in your watchlist or portfolio and be alerted when this changes, or use our stock screener to discover 44 high quality undervalued stocks. If you save a screener we even alert you when new companies match – so you never miss a potential opportunity.
Next Steps
With mixed signals around Manhattan Associates, the real question is what matters most to you right now. Move quickly, check the latest data, and weigh both the 2 key rewards and 1 important warning sign.
Looking for more investment ideas beyond Manhattan Associates?
Do not stop your research with Manhattan Associates. Broaden your watchlist with other stocks that match your return goals and risk comfort using targeted screeners.
This article by Simply Wall St is general in nature. We provide commentary based on historical data
and analyst forecasts only using an unbiased methodology and our articles are not intended to be financial advice. It does not constitute a recommendation to buy or sell any stock, and does not take account of your objectives, or your
financial situation. We aim to bring you long-term focused analysis driven by fundamental data.
Note that our analysis may not factor in the latest price-sensitive company announcements or qualitative material.
Simply Wall St has no position in any stocks mentioned.
New: Manage All Your Stock Portfolios in One Place
We’ve created the ultimate portfolio companion for stock investors, and it’s free.
• Connect an unlimited number of Portfolios and see your total in one currency
• Be alerted to new Warning Signs or Risks via email or mobile
• Track the Fair Value of your stocks
Have feedback on this article? Concerned about the content? Get in touch with us directly. Alternatively, email editorial-team@simplywallst.com