
Time to read [5 minutes]
Manhattan
Rising mortgage rates are placing upward pressure on rental market prices.
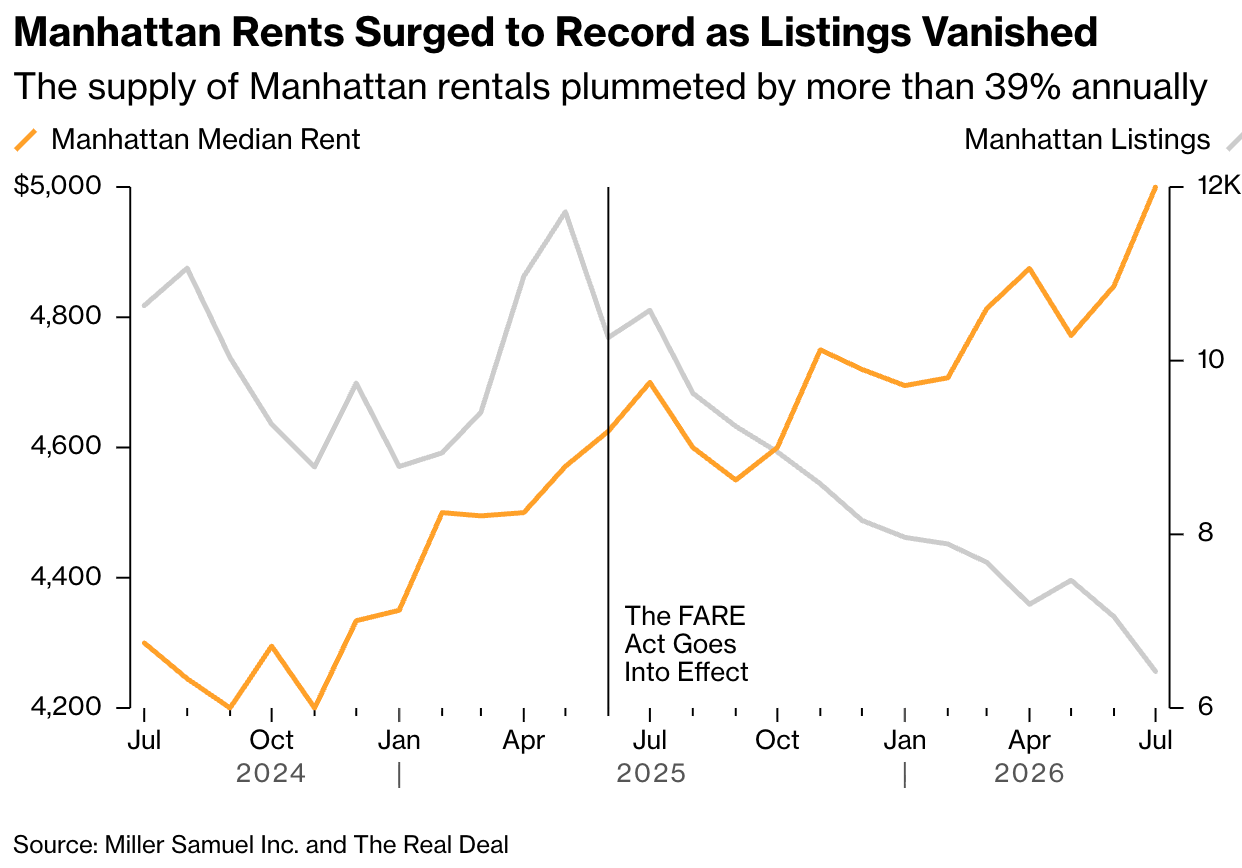
Average, average per square foot, and median rental prices all rose to new records in July
Listing inventory fell sharply year over year, restraining the number of rental transactions
Luxury rental market prices surged year over year, substantially higher than the overall market, reaching new highs
Luxury rental listing inventory fell by more than half
Brooklyn
Higher interest rates are shrinking the new development pipeline.
Average and median rental prices all moved annually to new highs
Listing inventory fell sharply, restraining the number of rental transactions
Luxury average and median rent surged to new records
Luxury inventory plunged year over year by more than half
It’s good to be back in the rental world.
Warning: I have too many charts here, probably past the legal limit, so the entire post may be too big for some email systems. Be sure to click the post title above so you can read the charts in their full glory on the website!
I previously reported on the NYC rental market for nearly two decades, and my last report was back in January of 2026. I’ve been anxious to get back into the market since it is important to have it alongside a sales market analysis. My partnership with The Real Deal has made this report possible, and I look forward to creating a lot more rental content in the future. Starting now, we will issue a monthly rental report for the Manhattan and Brooklyn markets in the second week of each month. In the near future, a post like this on the report results will evolve into the addition of a stand alone pdf report.
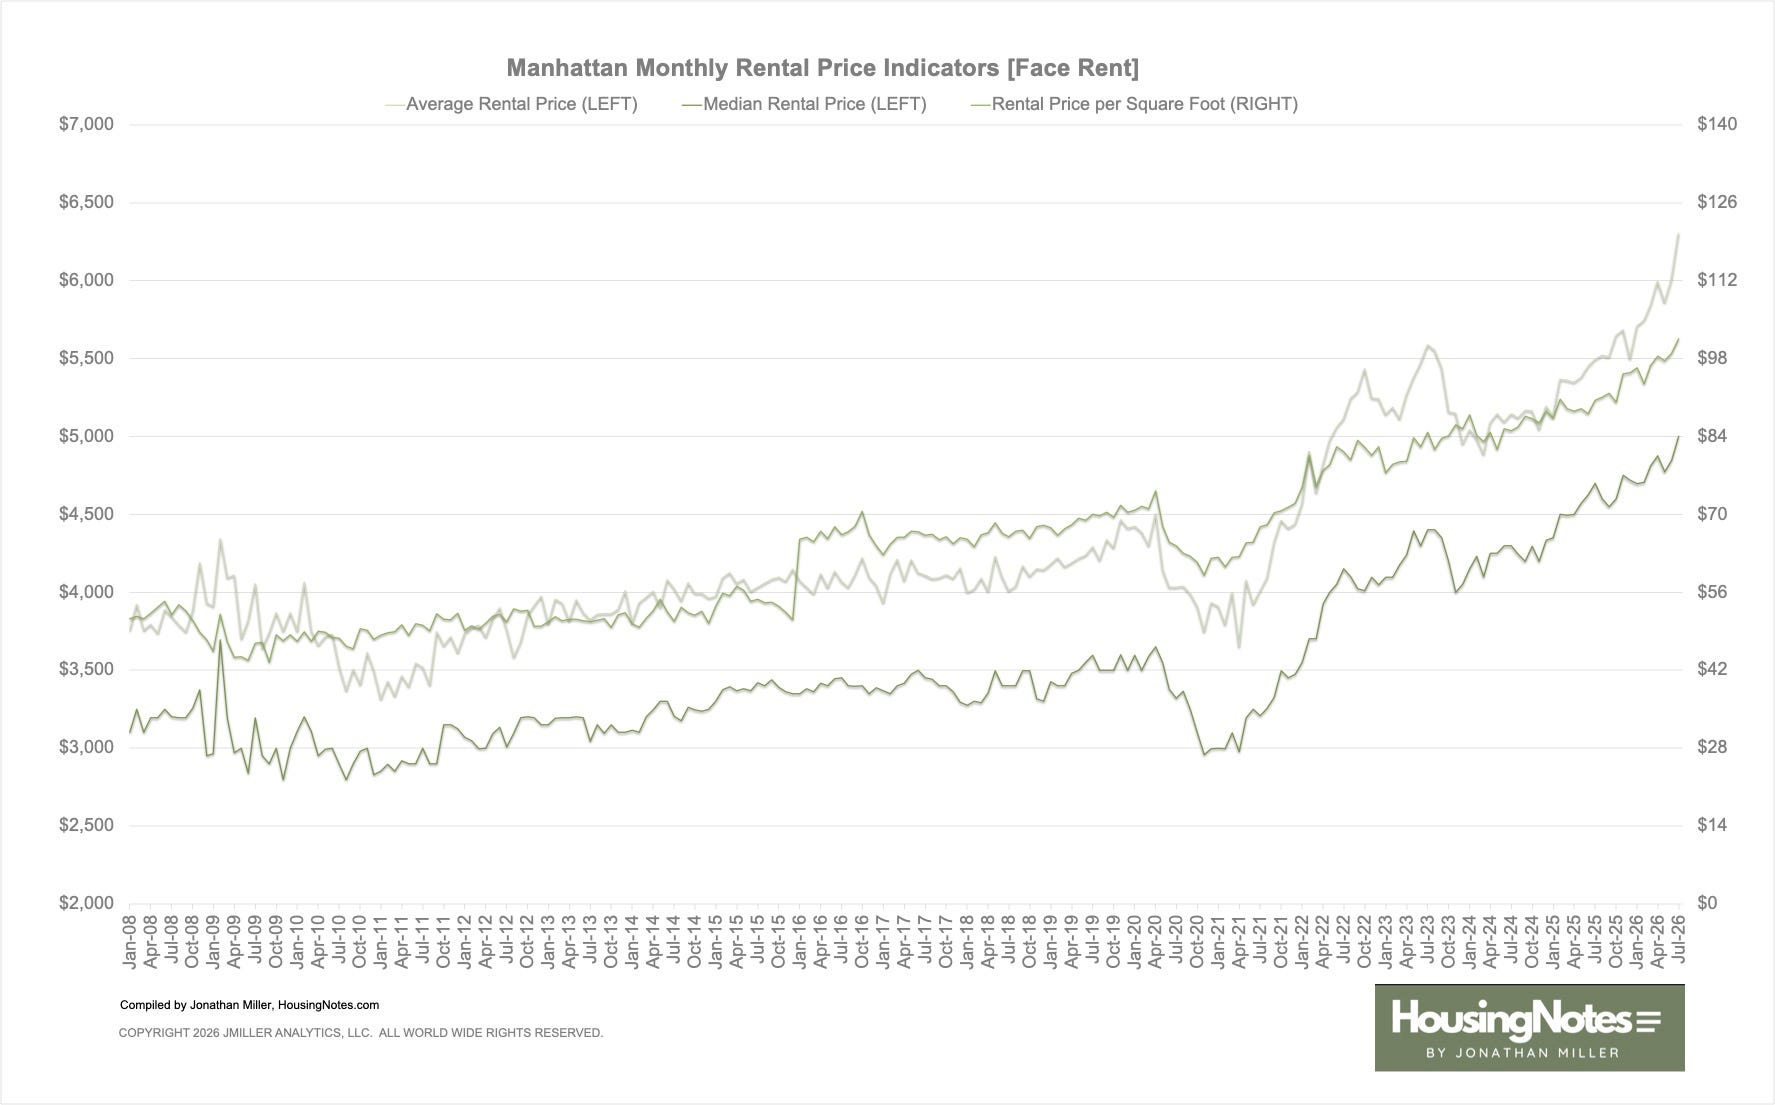
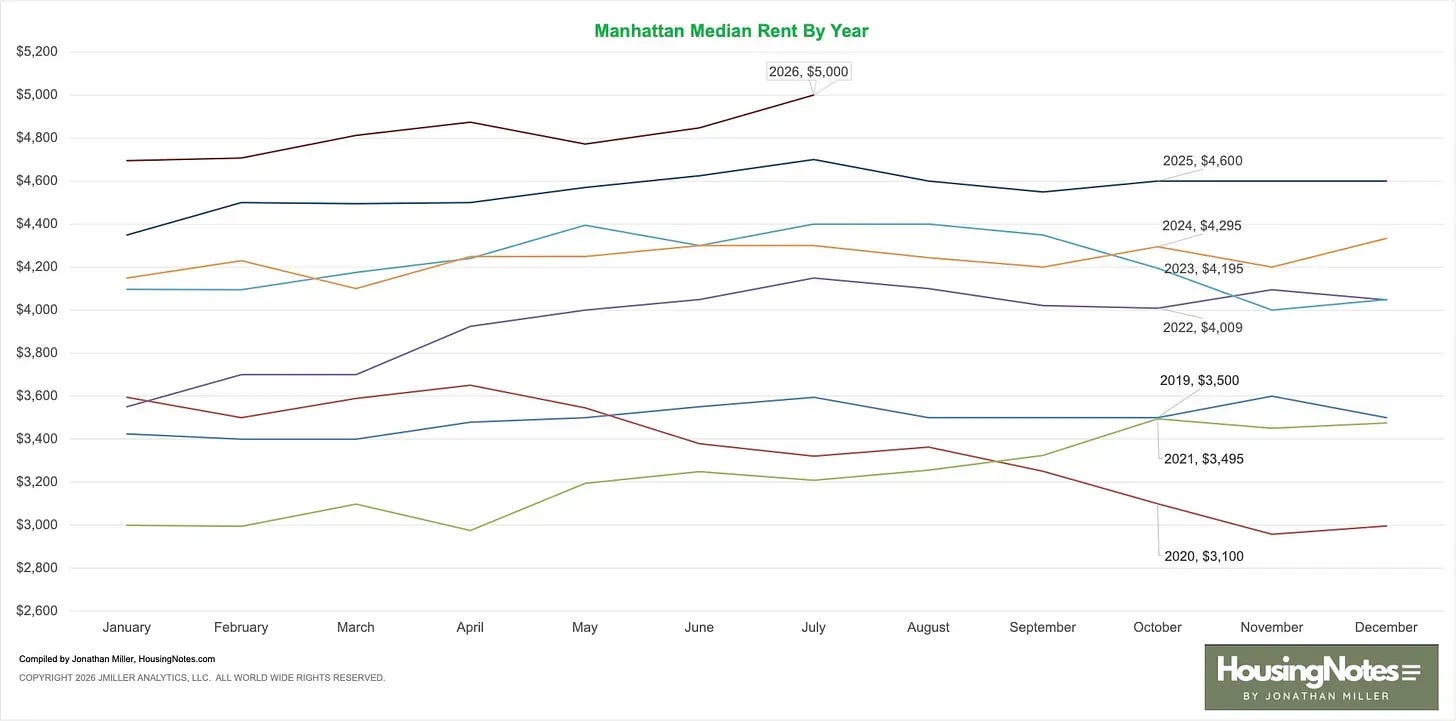
Median rental price cracks $5,000 for the first time.
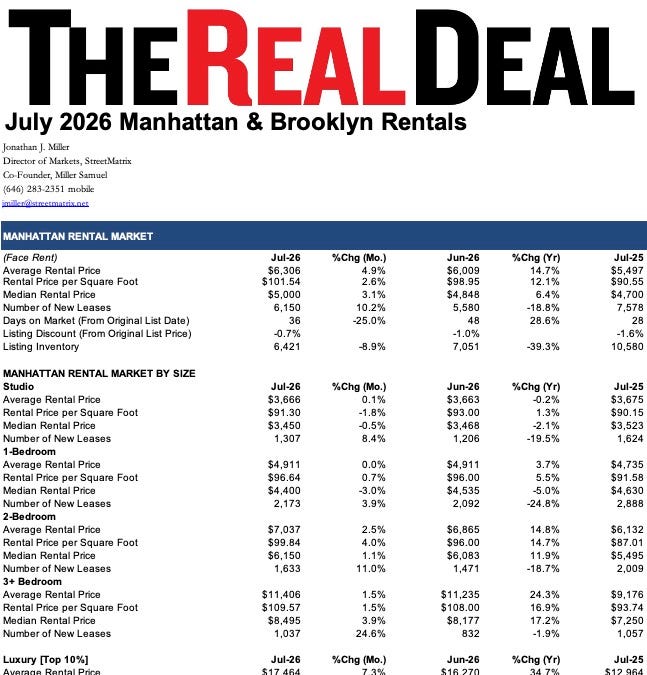
In July, all three price trend indicators posted annual gains that were 2-4 times the rate of inflation. The median sales price was $5,000, the first time it reached this threshold as the highest median price on record, rising by 6.4% from the same period last year.
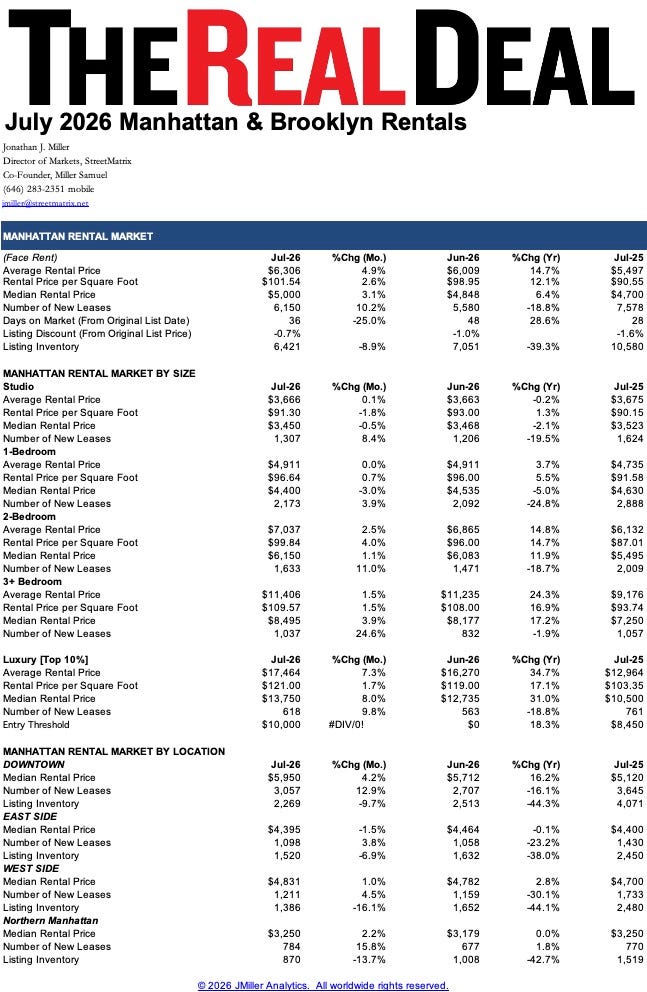
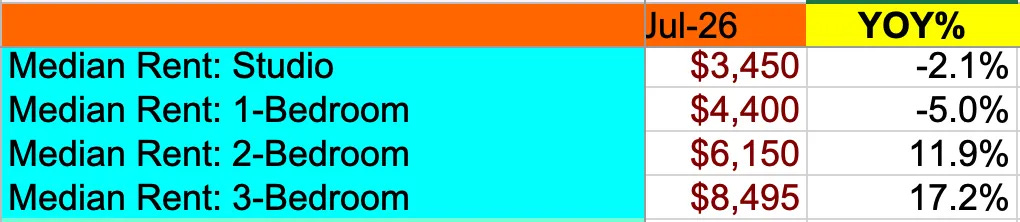
The shift in the mix toward larger apartments was a key driver of price growth, as illustrated in the tables below. In the breakdown of the market by bedrooms, the rent and market share growth is largely centered on the upper half of the market.
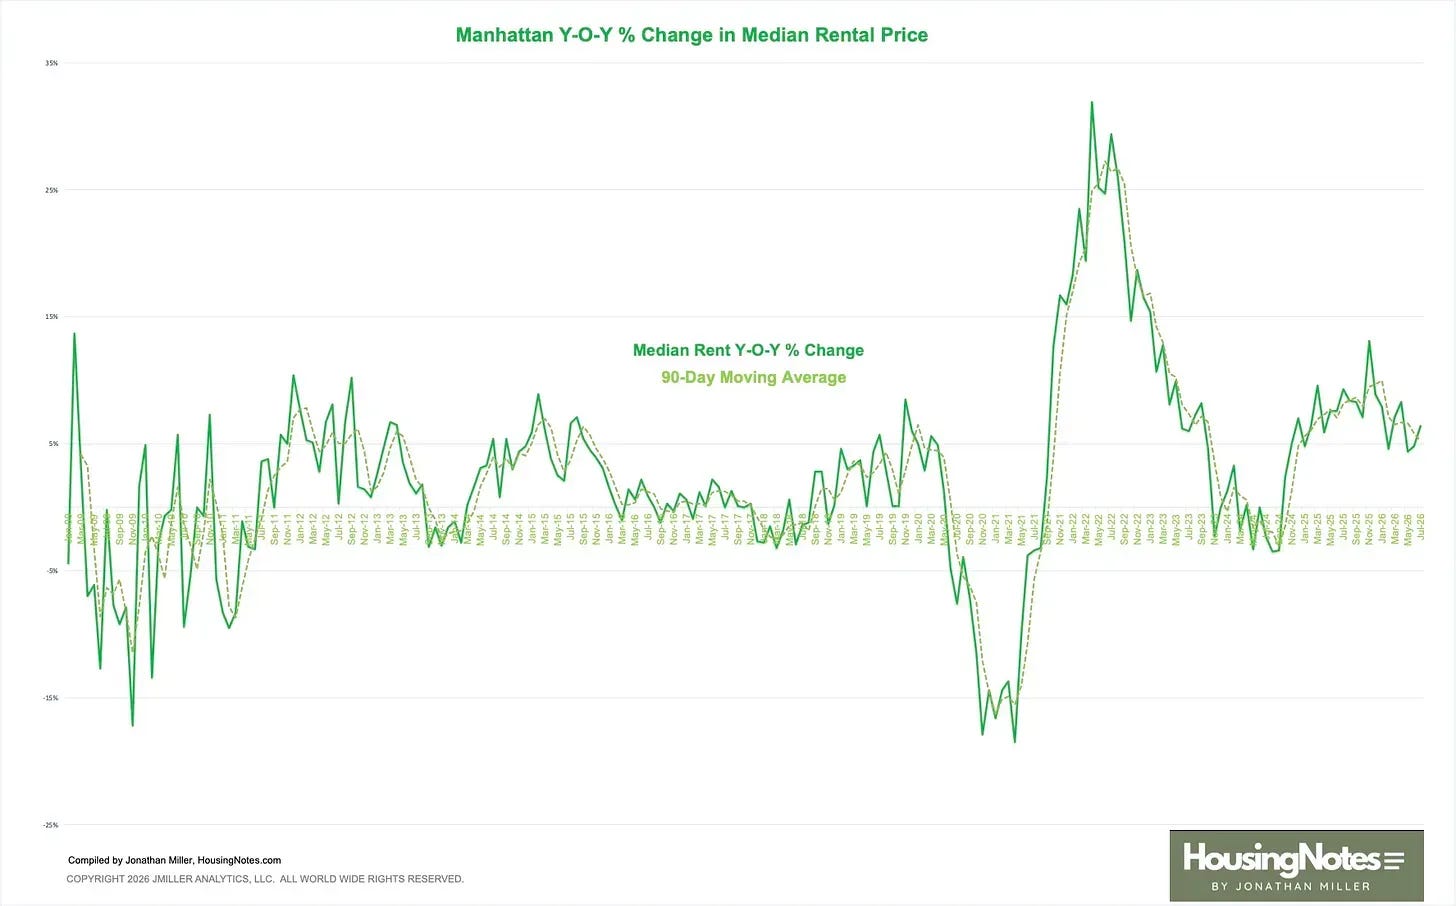
The rate of price growth over the past year was the second-highest in nearly two decades, second only to the exit period from the pandemic.
Listing inventory plunged 39.3% year over year to 6,421, marking the thirteenth consecutive decline and the lowest level in 2 years. In contrast, the July decade average for inventory was 8,357, and the annual growth was 0.7%. The drop in listing inventory could have been caused by the introduction of the pied-a-terre tax, or the acceleration of the use of private listings. Supply was significantly down across the market with the exception of 3+ bedrooms, which experienced only a modest annual drop.

Rents surged, while the outlook for new development rental product amid rising interest rates is diminishing.
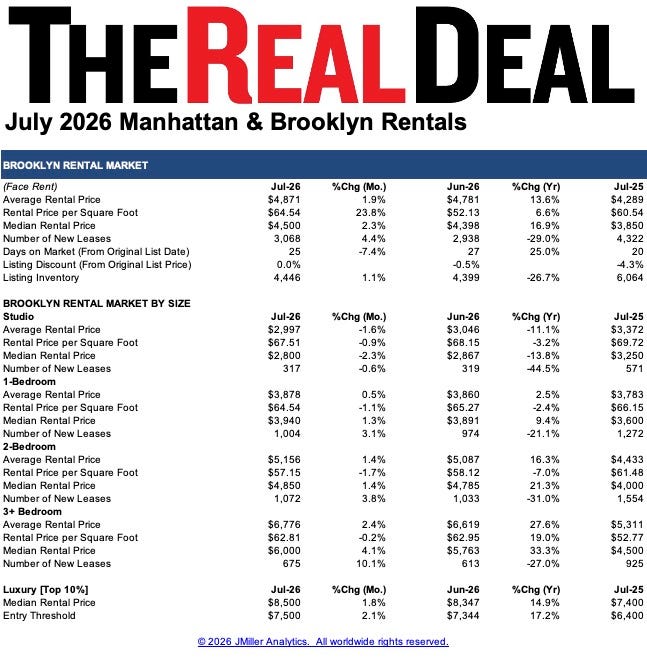
In July, all three price trend indicators posted annual gains of 2-5 times the rate of inflation. The median sales price was $4,500, rising by 6.6% annually to a record high.
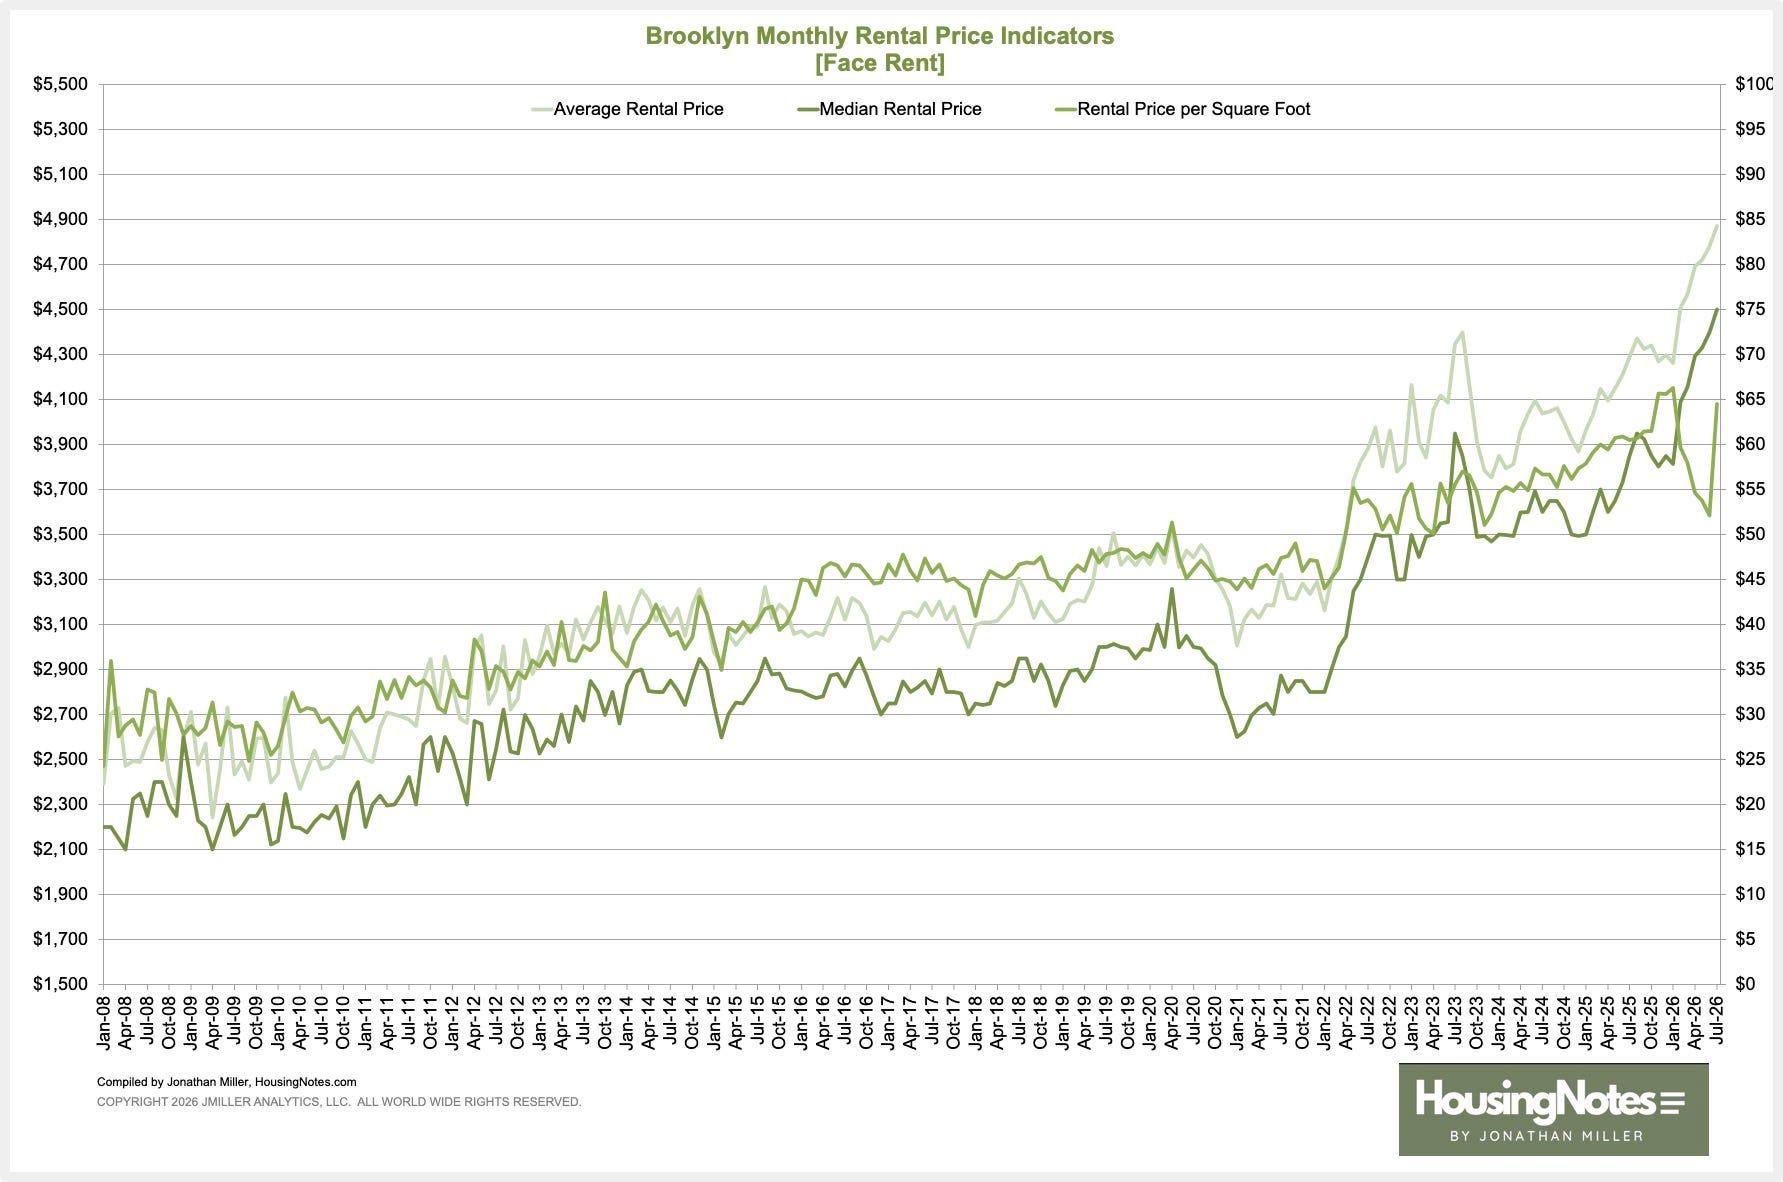
The rate of price growth over the past year is approaching the levels seen after the pandemic.
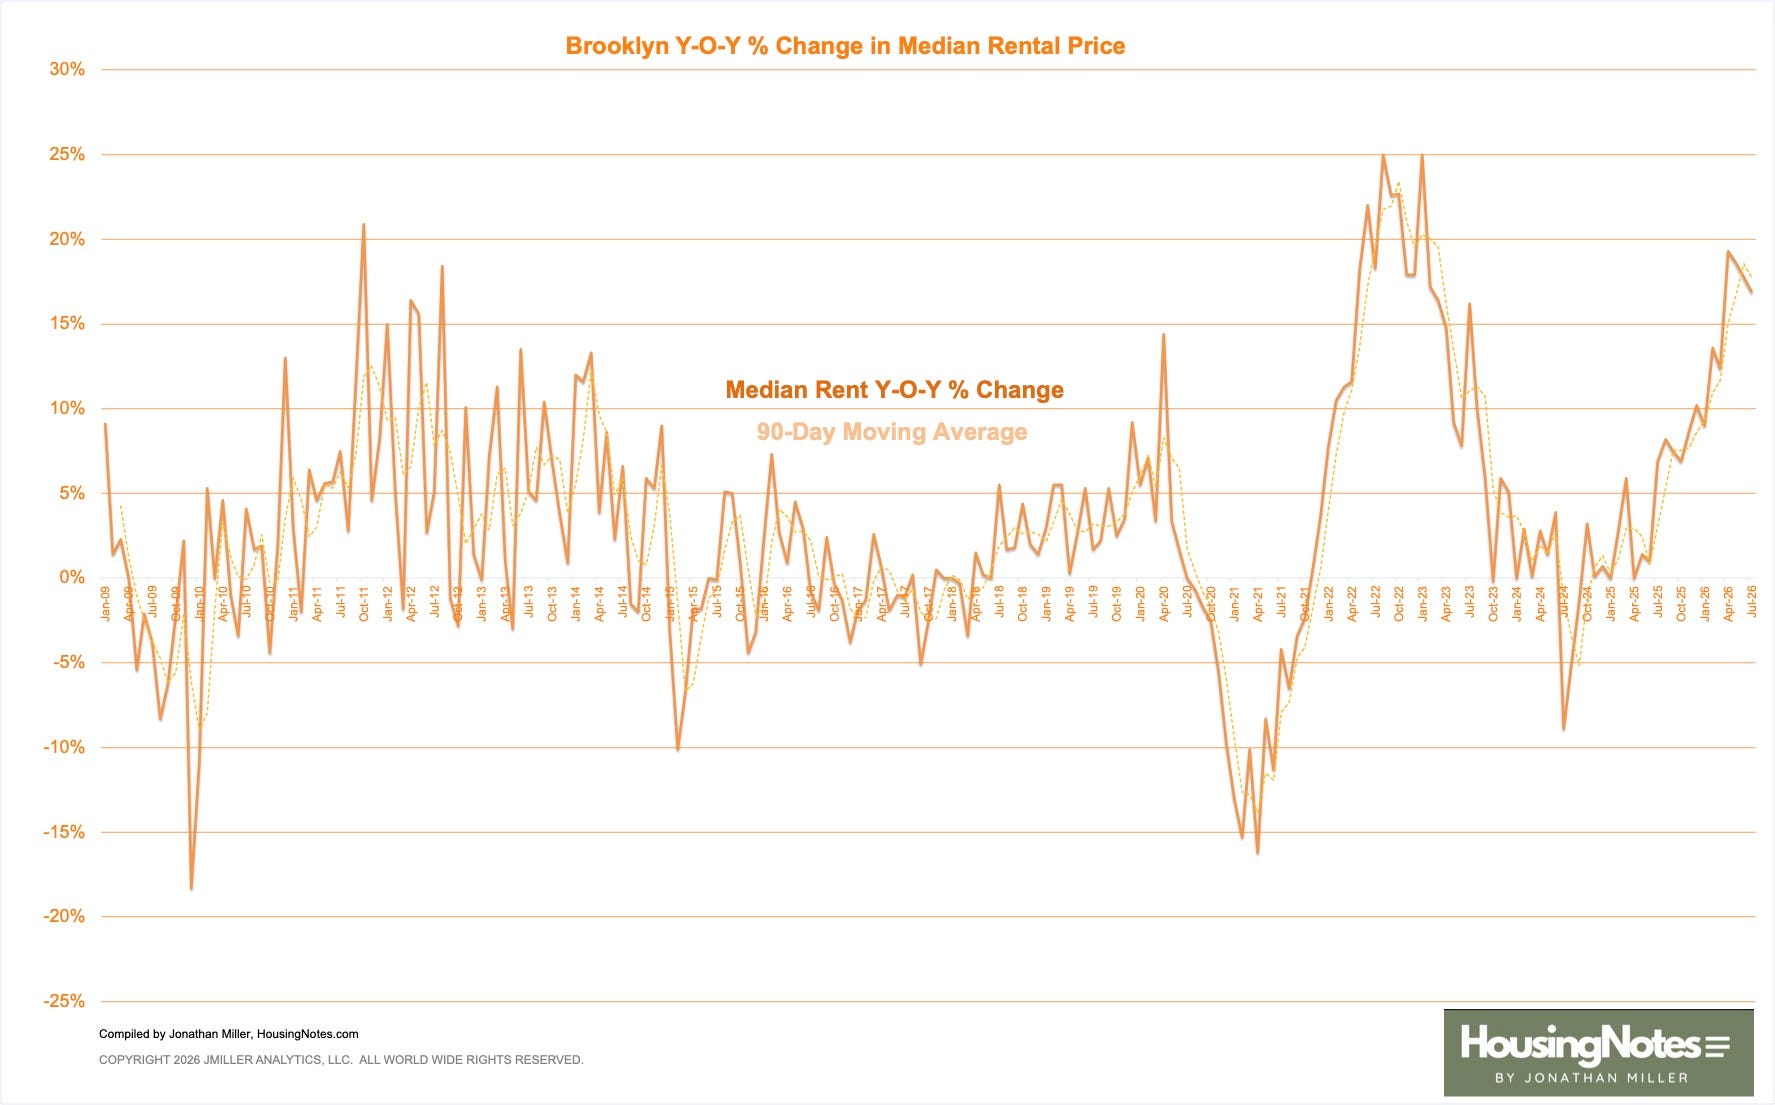
Leasing activity has been restrained by limited inventory. The number of new leases usually peaks next month, in August, while inventory reaches its summer summit in July.
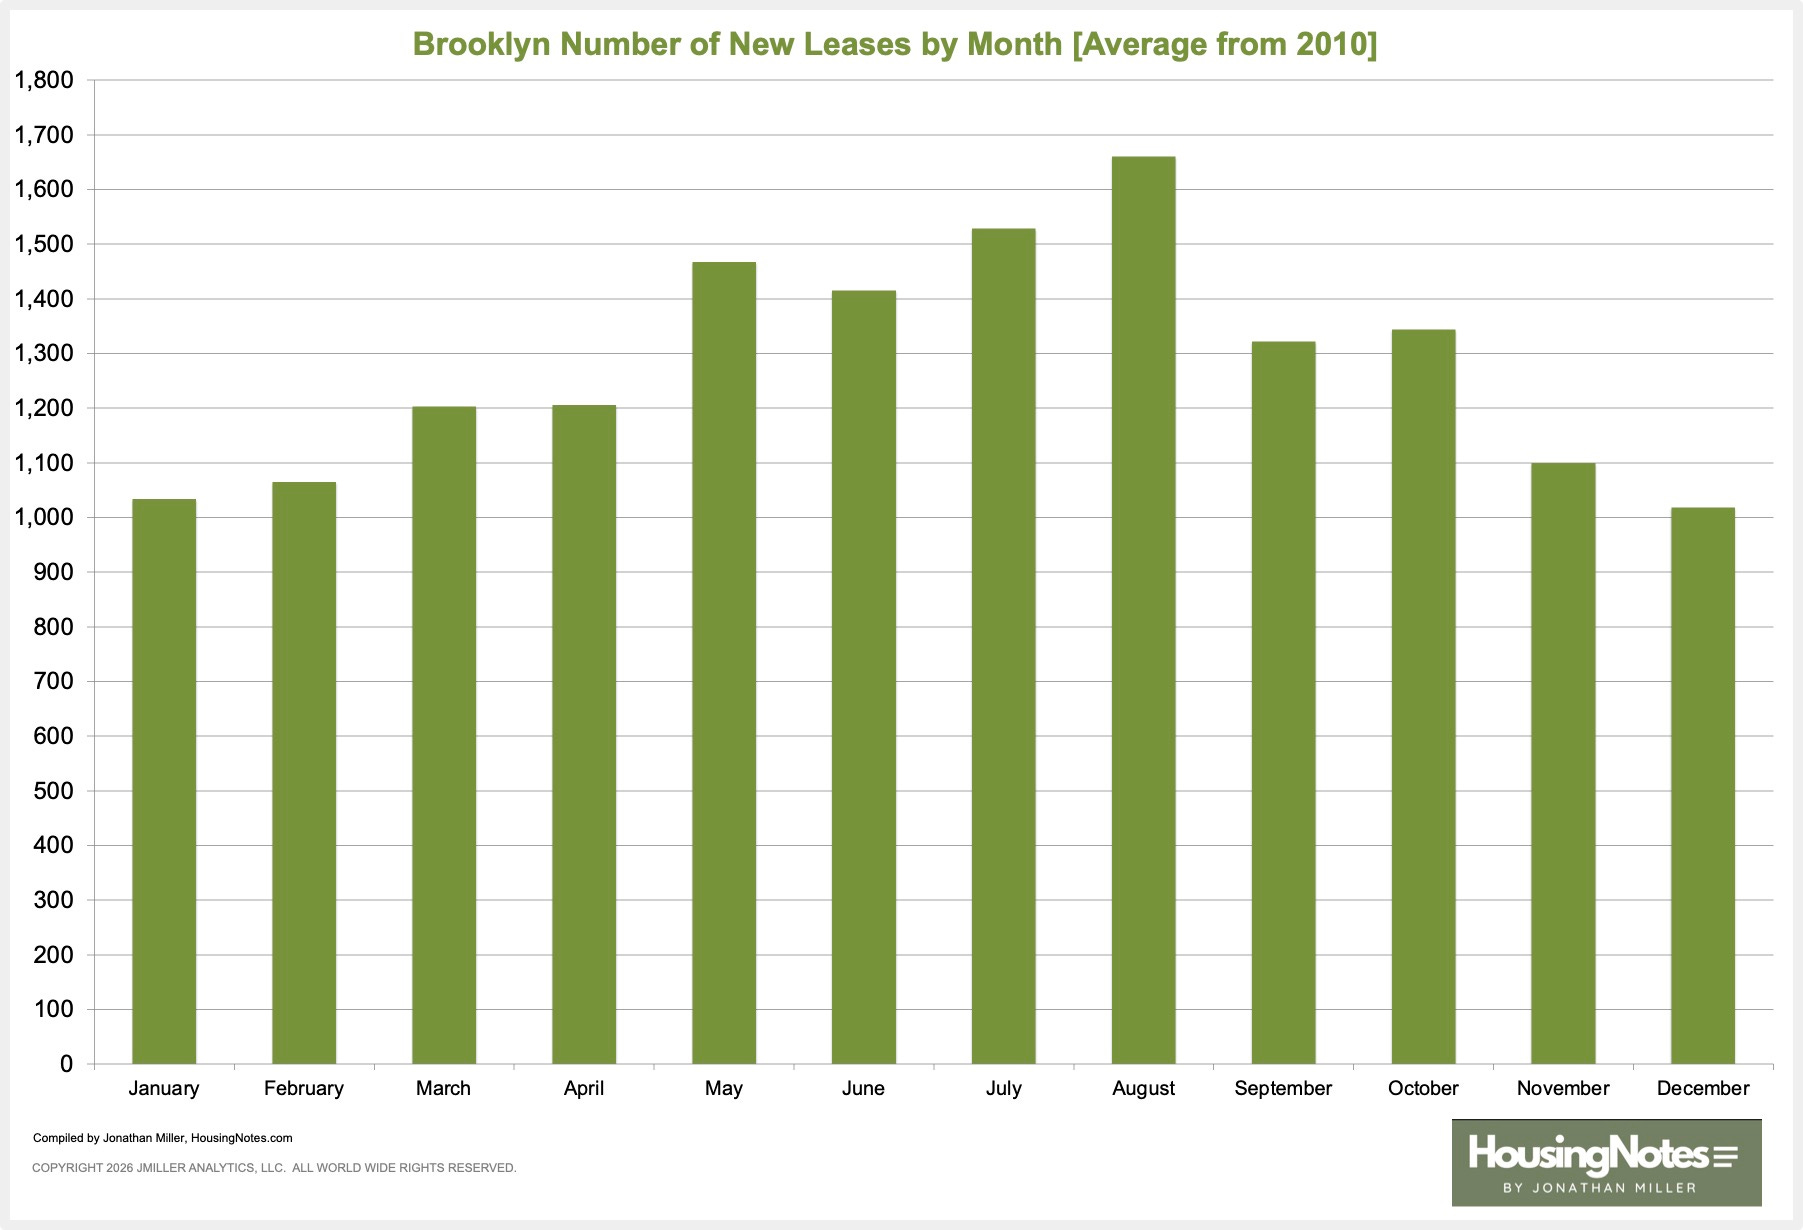
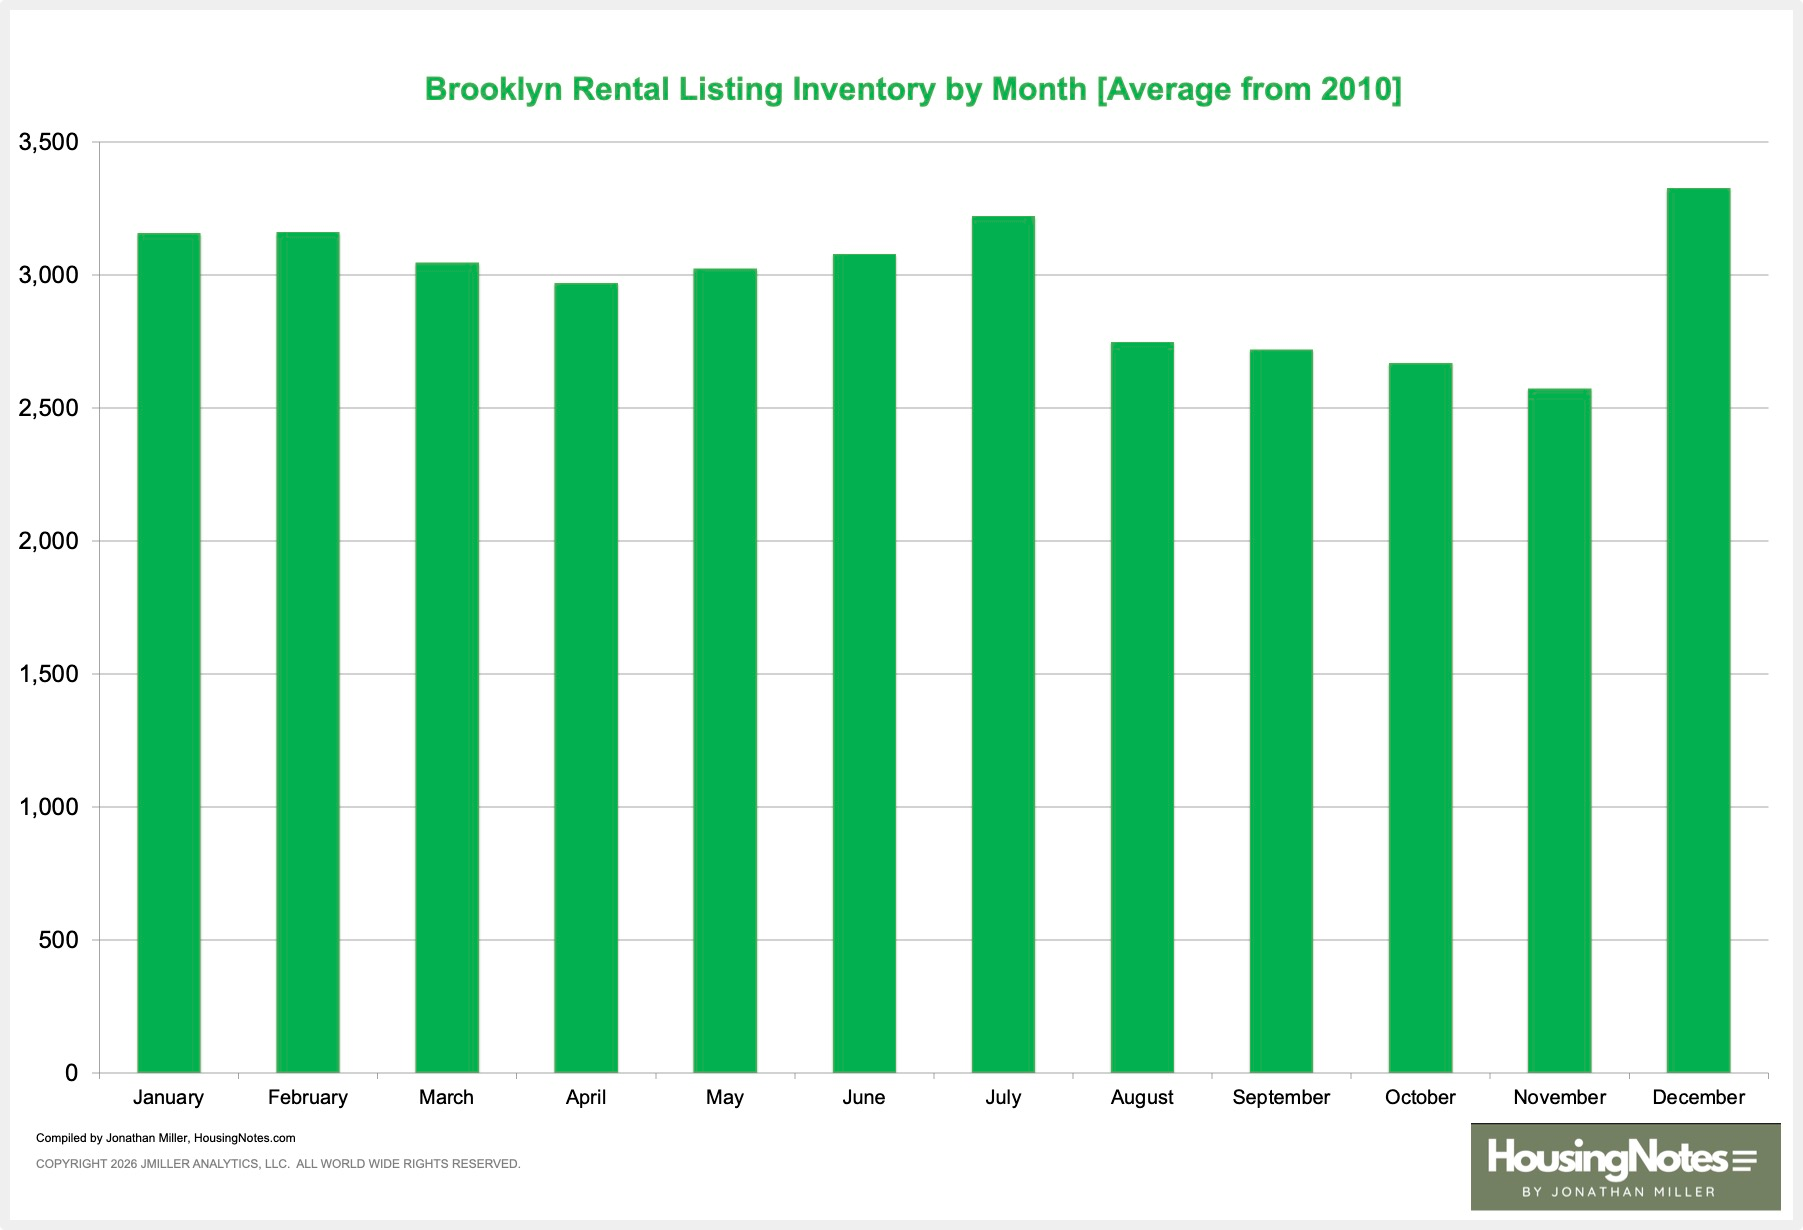
The drop in supply is unusually acute for this time of year, so a factor might be the implementation of the pied-à-terre tax for $5+ million second homes. More pied-à-terre buyers are choosing to rent instead of buy, and some existing owners are selling their second home and renting when they’re in the city, both adding demand to an already starved rental pool. The rapid increase in the reliance on private listings, which hides supply from the public, overstates how low supply actually is. And we can’t forget the FARE Act, which basically makes the person using the service pay for the service. Some landlords appear to be pulling listings from public platforms and doing deals off-market or through direct-application processes to avoid broker-fee friction altogether. This would shrink visible inventory without necessarily reducing the number of occupied or available units, complicating any inventory count based on public listing sites alone.
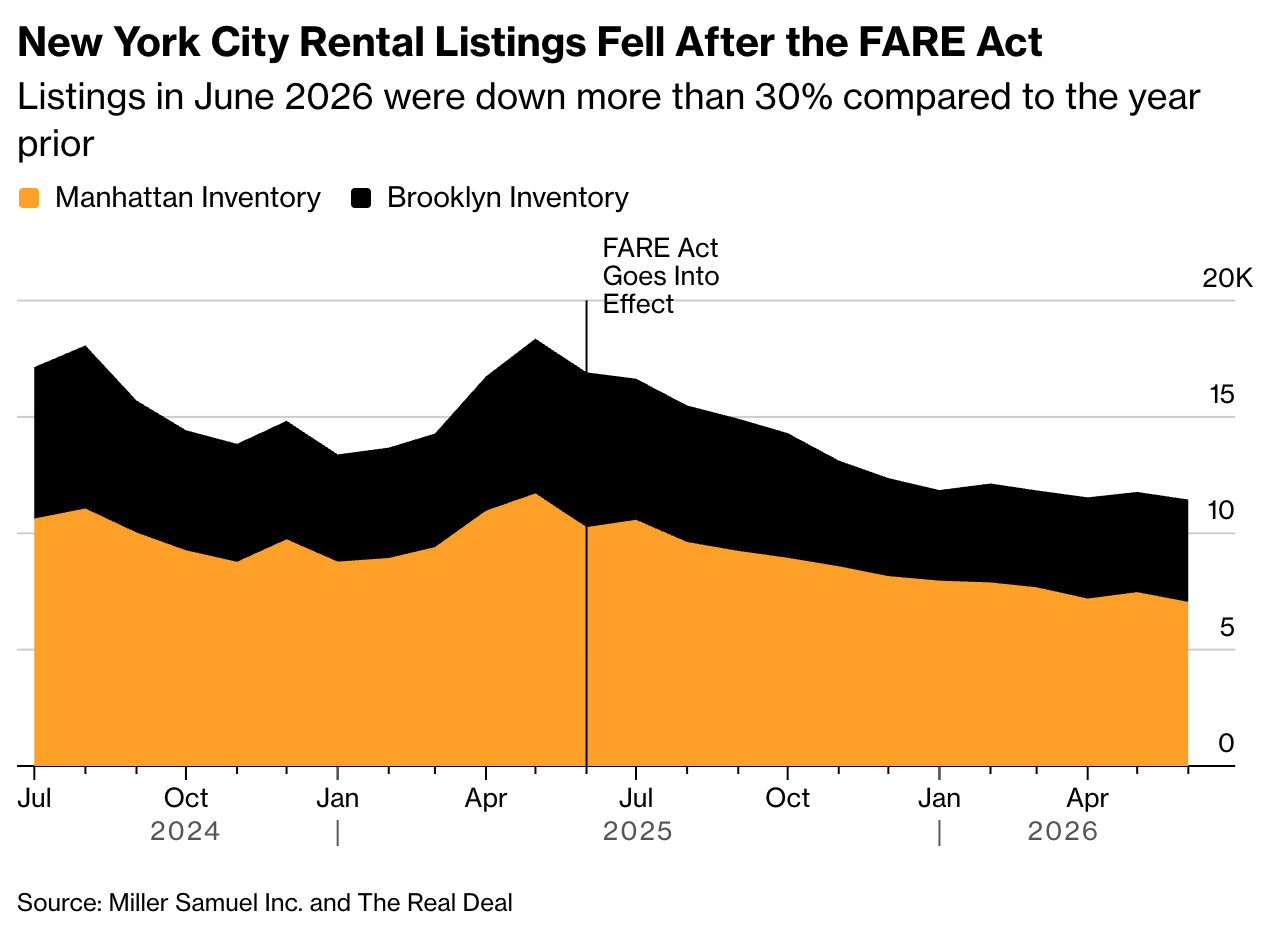
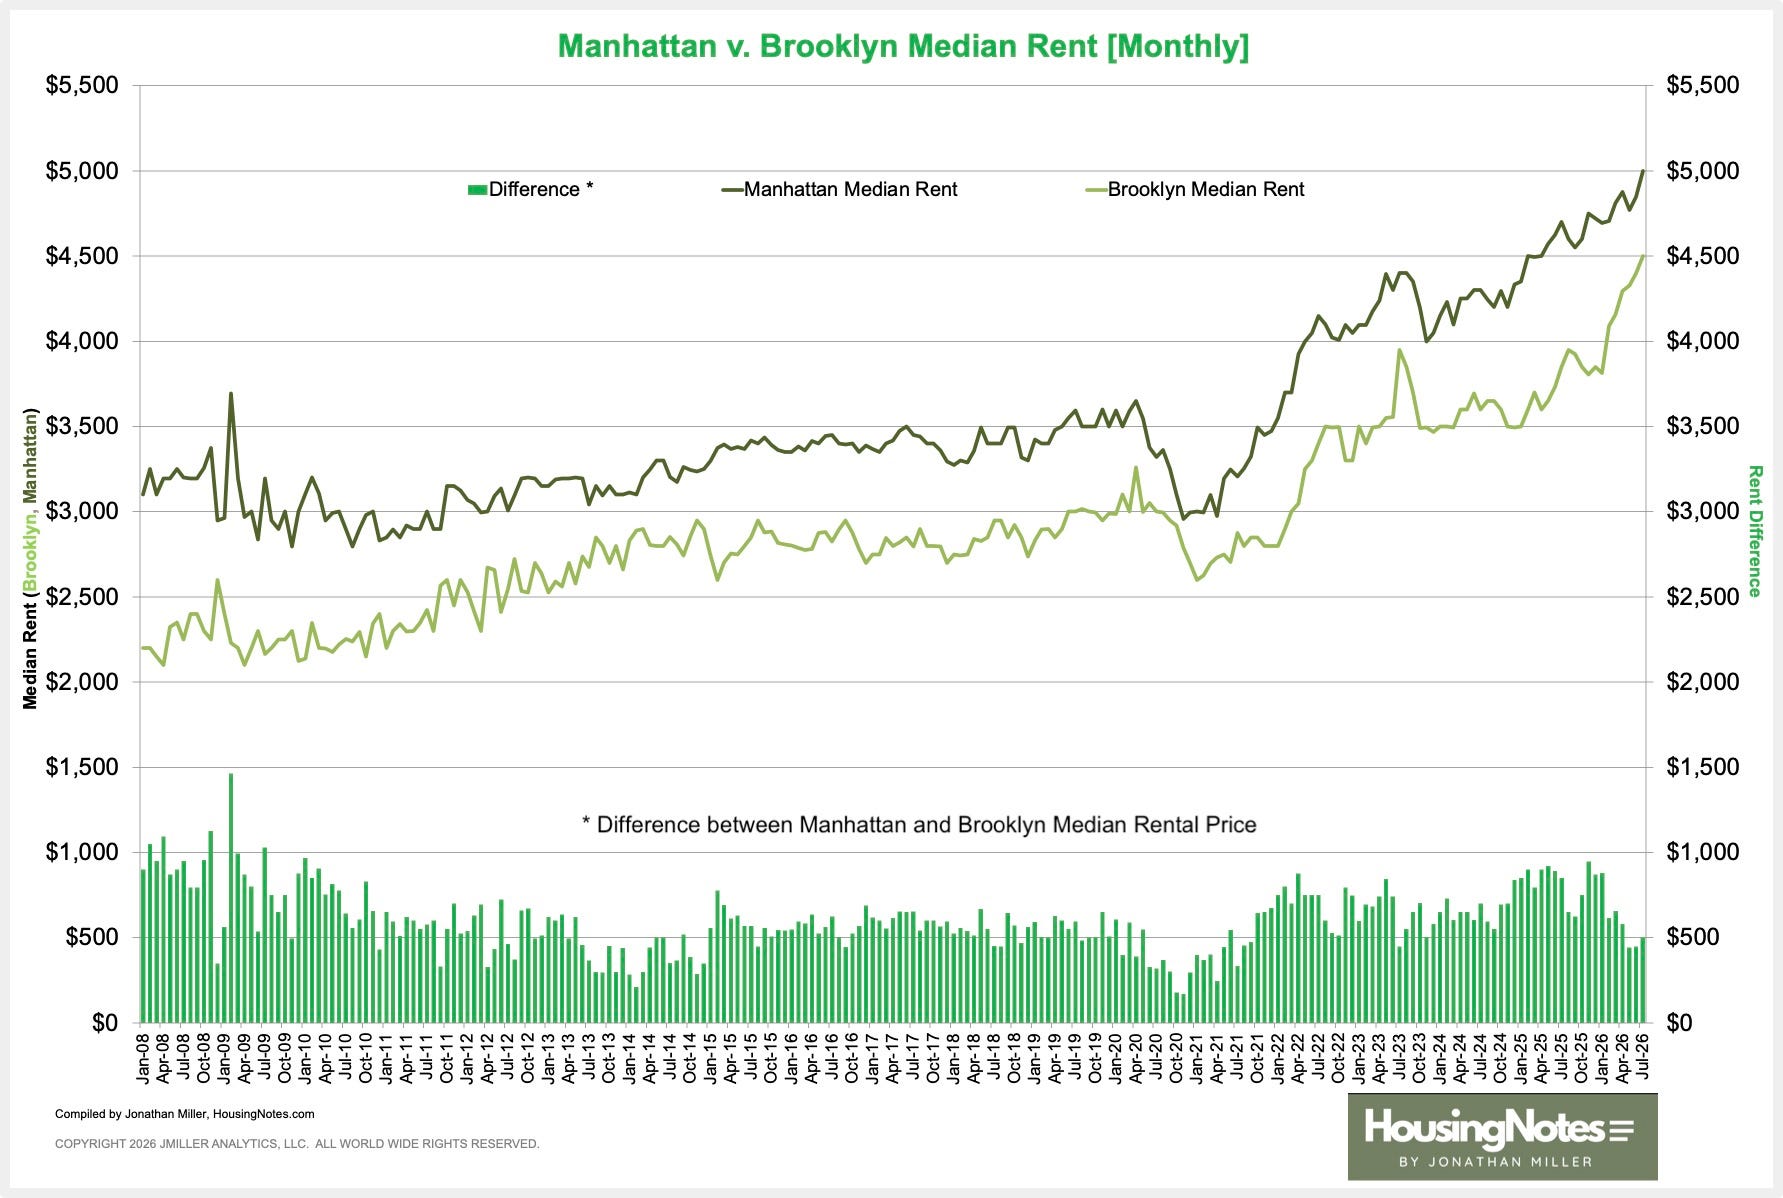
The spread between the $4,500 median rent in Brooklyn and the $5,000 median rent in Manhattan is narrowing. The compression is largely because Brooklyn is rising faster, even though both regions are seeing rapid price gains. The sharp pattern of prices “moving up and to the right” is a function of rising mortgage rates, forcing would-be migration into the sales market to stall and tie up rental supply.
The Actual Final Thought – The market is not a one-hit wonder.

My Housing Notes column also appears several times a week over at The Real Deal!
