

On September 04, 2026, Manhattan Associates Inc MANH shares fell 3.8% to a current price of $213.77. This decline comes amidst a 52-week range that has seen a high of $227.03 and a low of $119.06, illustrating the stock’s volatility over the past year.
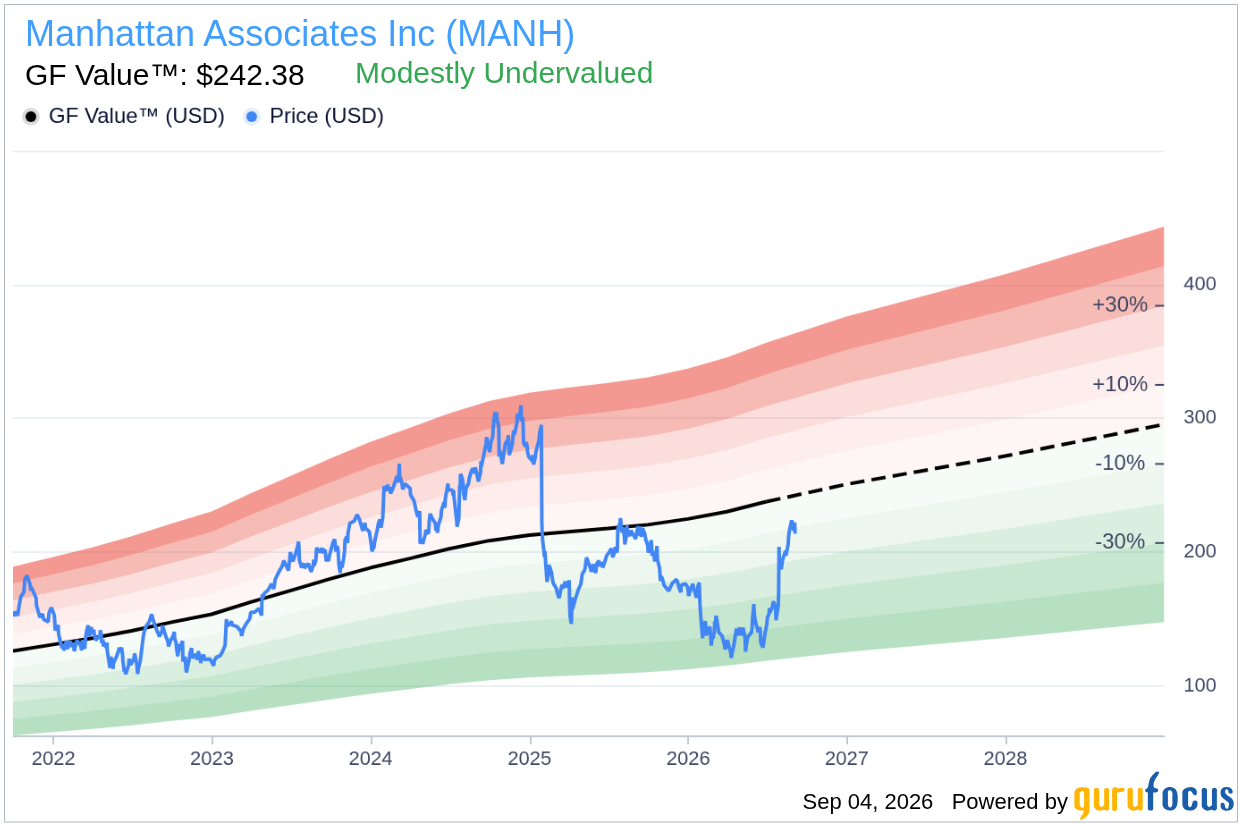
GF Value™ verdict: MANH is currently priced at $213.77, which is 11.8% below the GF Value™ estimate of $242.38, indicating it is undervalued.GF Score™ of 94/100 suggests a strong overall company assessment, reflecting its solid fundamentals.Insider activity shows that insiders sold $3.3 million worth of shares over the past 12 months with no buying, raising concerns about management’s confidence in the stock.Is MANH Overvalued or Undervalued?
The GF Value™ estimate for Manhattan Associates Inc currently indicates that the stock is undervalued, with a fair value set at $242.38. Compared to its current price of $213.77, this represents a margin of safety of 11.8%. This modest undervaluation suggests that there may be an opportunity for growth, provided that the company’s fundamentals remain strong and that market conditions do not deteriorate further.
GF Value™ is a proprietary intrinsic value estimate created by GuruFocus, which takes into account historical trading multiples, past business growth, and future performance expectations. The GF Valuation label categorizes MANH as modestly undervalued, indicating that while the stock is currently trading below its fair value, caution is warranted due to broader market conditions and insider selling activity.
How Does MANH’s Valuation Compare to Its History?MetricCurrentHistoricalP/E (TTM)61.2×72.1x (5-Year Median)Forward P/E34.8x-
Currently, MANH’s P/E (TTM) of 61.2x is significantly lower than its 5-year median P/E of 72.1x, indicating that the stock is trading at a more favorable multiple compared to its historical valuation metrics. This P/E analysis aligns with the GF Value™ verdict of undervaluation, reinforcing the notion that the stock may present a buying opportunity for investors who are willing to consider the company’s growth potential and market position.
What Does MANH’s GF Score™ Tell Us?
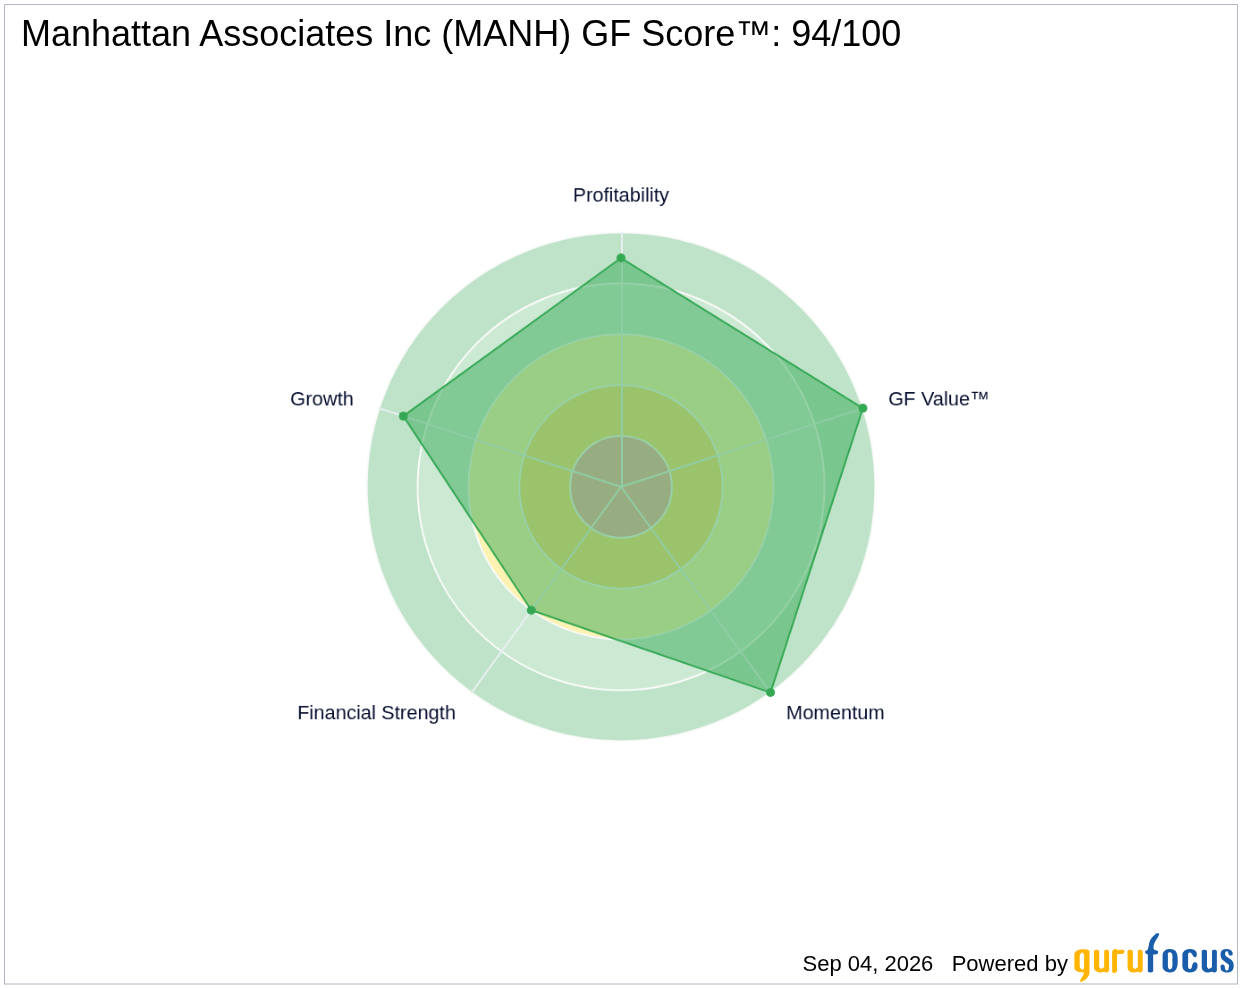
The GF Score™ is an overall measure of a company’s financial strength, profitability, growth potential, valuation, and momentum. A high score indicates a strong company with solid financials and growth prospects. For Manhattan Associates Inc, the GF Score™ stands at an impressive 94/100, showcasing its robust fundamentals. The strongest sub-ranks are in Valuation (10/10) and Momentum (10/10), while its weakest area is the Financial Strength rank (6/10).
MetricRatingGF Score™94/100Financial Strength6/10Profitability9/10Growth9/10Valuation10/10Momentum10/10
The high GF Score™ reflects a company that is well-positioned in terms of profitability and growth, underscoring its competitive advantages in the software industry. However, the Financial Strength score indicates some potential concerns that should be monitored closely, especially given the recent insider selling activity.
What Are Gurus and Insiders Doing with MANH?
Currently, six gurus hold shares of Manhattan Associates Inc, with four increasing their positions and two trimming their holdings in recent quarters. This suggests a generally optimistic sentiment among the guru investors, who may see potential in the company’s future performance.
On the other hand, insider activity paints a different picture, as insiders have sold $3.3 million worth of shares over the past year without any buying. This could imply that those closest to the company might not have confidence in its near-term prospects, which could be a red flag for potential investors.
What This Means for Investors
Based on the current analysis, Manhattan Associates Inc appears to be undervalued according to GF Value™, presenting an opportunity for potential growth. However, the recent insider selling and the mixed signals from guru ownership indicate that investors should approach with caution. Thorough diligence is advisable to understand the underlying business dynamics before making any investment decisions.
For more insights on Manhattan Associates Inc MANH, visit the stock page for comprehensive data and analysis.
Frequently Asked Questions
What is MANH’s GF Score™?
MANH has a GF Score™ of 94/100, indicating it is assessed strongly based on its financial metrics and growth potential.
Is MANH overvalued or undervalued?
MANH is currently undervalued, as indicated by its price being 11.8% below the GF Value™ estimate of $242.38.
What is MANH’s P/E ratio?
MANH’s P/E ratio is 61.2x (TTM), which is below its 5-year median of 72.1x, suggesting it is trading at a lower valuation compared to its historical performance.
This stock alert was generated using automated technology and GuruFocus financial data to provide readers with timely and accurate market reporting. This content was reviewed by GuruFocus editorial team prior to publication. Please send any questions or comments about this story to [email protected].