

A Closer Look at the Upcoming Payout and the Sustainability of LOAN’s High-Yield Dividend
Manhattan Bridge Capital Inc LOAN recently announced a total dividend of $0.11 per share, with the ex-dividend date set for 2026-10-08. This distribution consists of a $0.11 per share cash dividend payable on 2026-10-15. For income-focused investors, the ex-dividend date is a critical detail: shareholders must own the stock before this date to qualify for the payment. As investors look forward to this upcoming payment, the spotlight also shines on the company’s dividend history, yield, and growth rates. Using data from GuruFocus, let’s look into Manhattan Bridge Capital Inc’s dividend performance and assess its sustainability.
What Does Manhattan Bridge Capital Inc Do?
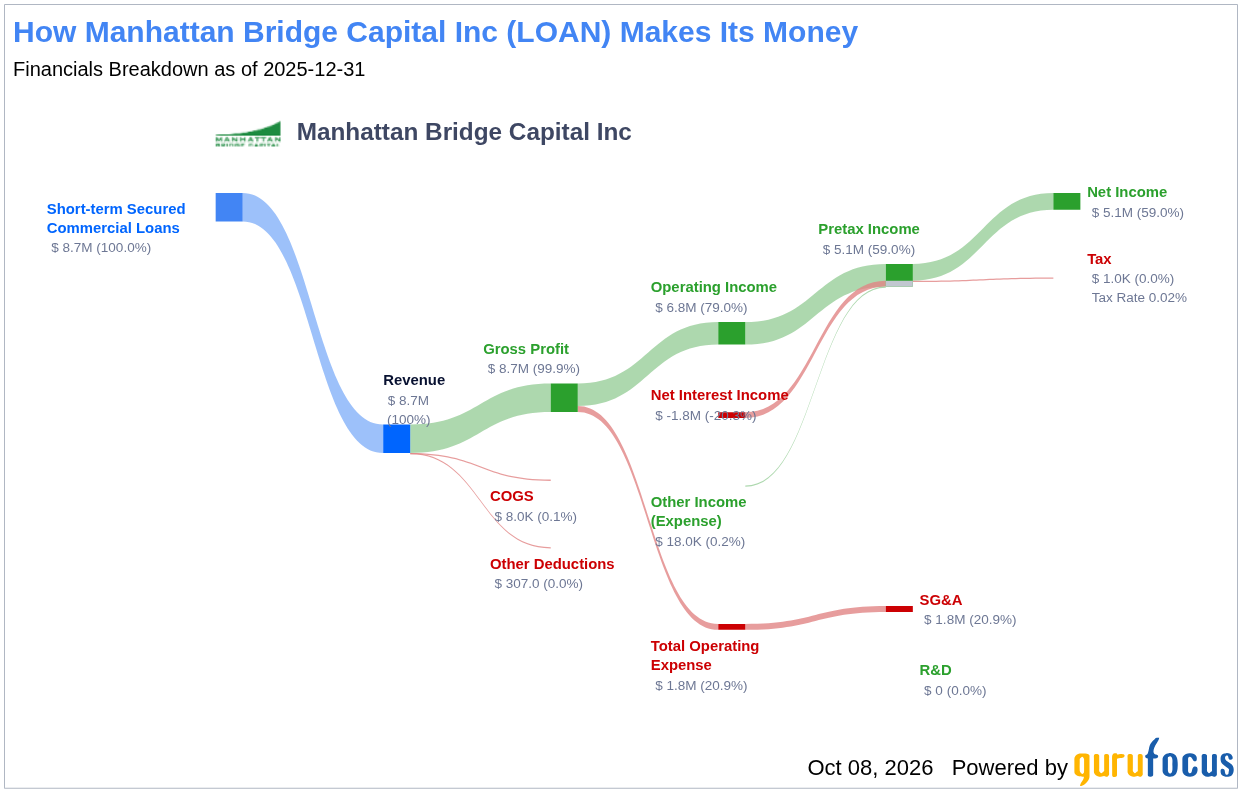
Manhattan Bridge Capital Inc is a real estate finance company structured as a real estate investment trust (REIT) for tax purposes. It specializes in originating, servicing, and managing a portfolio of first mortgage loans, primarily offering short-term, secured, non-banking loans to real estate investors. These loans fund the acquisition, renovation, rehabilitation, or development of residential and commercial properties, and may be renewed or extended before or after their initial terms expire. The company’s borrowers are typically real estate investors and developers operating in the New York metropolitan area, including New Jersey and Connecticut, as well as in Florida. Revenue is generated primarily through interest income earned on its loan portfolio, along with origination and other loan-related fees. As a REIT, the company generally distributes a substantial portion of its taxable income to shareholders in the form of dividends.
A Glimpse at Manhattan Bridge Capital Inc’s Dividend History
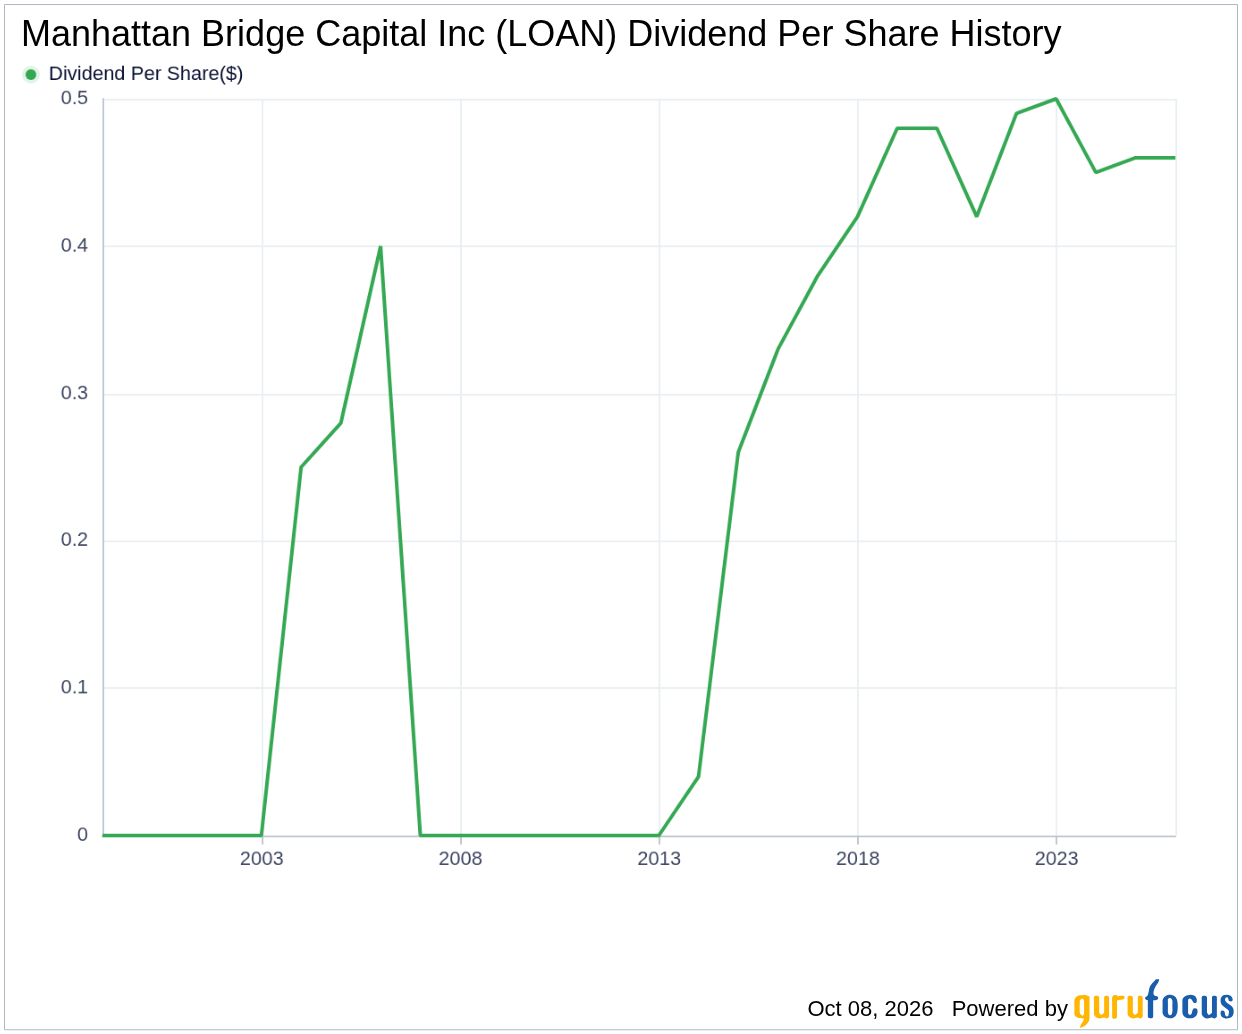
Manhattan Bridge Capital Inc has maintained a consistent dividend payment record since 2013. Dividends are currently distributed on a quarterly basis, a cadence that provides shareholders with a steady stream of income throughout the year. This long-standing commitment to returning capital is notable for a company of its size, and it reflects the predictable cash flows generated by its short-term mortgage lending model. Below is a chart showing annual Dividends Per Share for tracking historical trends.
Breaking Down Manhattan Bridge Capital Inc’s Dividend Yield and Growth
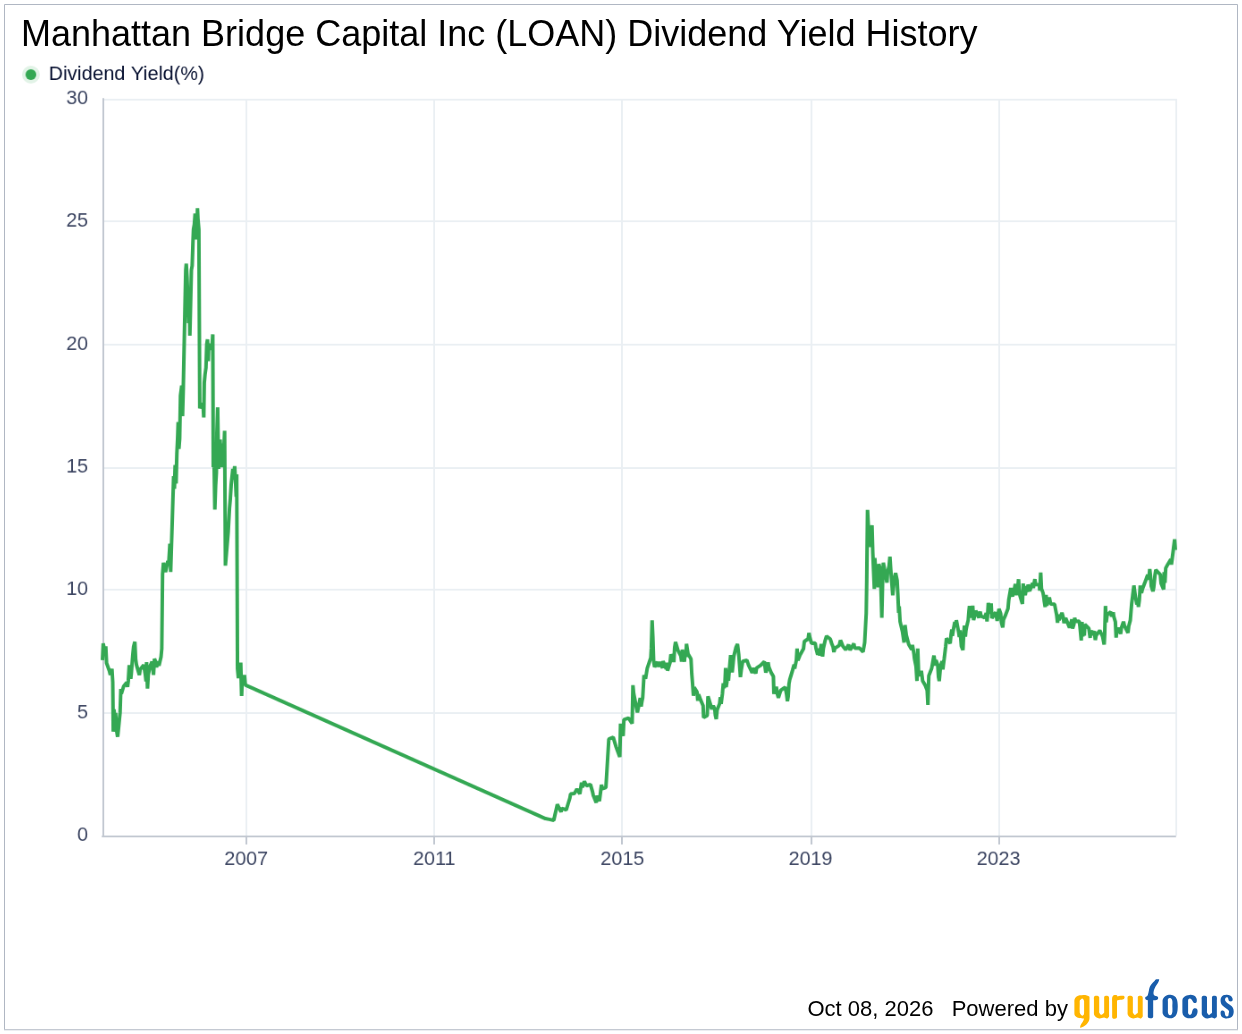
As of today, Manhattan Bridge Capital Inc currently has a 12-month trailing dividend yield of 12.36% and a 12-month forward dividend yield of 12.05%. This suggests an expectation of decreased dividend payments over the next 12 months. For context, the trailing yield reflects dividends actually paid over the past year, while the forward yield estimates future payments based on the latest declared dividend. A double-digit yield is exceptionally high and immediately raises a key question for value investors: is this income stream durable, or does the market expect a cut?
Over the past three years, Manhattan Bridge Capital Inc’s annual dividend growth rate was -2.70%. Extended to a five-year horizon, this rate increased to 0.60% per year. And over the past decade, Manhattan Bridge Capital Inc’s annual dividends per share growth rate stands at 2.70%. The mixed picture across timeframes suggests that while the dividend has grown modestly over the long run, recent years have seen pressure on the payout, a trend worth monitoring closely.
Based on Manhattan Bridge Capital Inc’s dividend yield and five-year growth rate, the 5-year yield on cost of Manhattan Bridge Capital Inc stock as of today is approximately 12.74%. Yield on cost measures the annual dividend return relative to an investor’s original purchase price, assuming reinvestment and growth over time. A yield on cost above the current yield implies that long-term holders have seen their income stream grow relative to their initial investment, even if the near-term growth rate has been uneven.
The Sustainability Question: Payout Ratio and Profitability
To assess the sustainability of the dividend, one needs to evaluate the company’s payout ratio. The dividend payout ratio provides insights into the portion of earnings the company distributes as dividends. A lower ratio suggests that the company retains a significant part of its earnings, thereby ensuring the availability of funds for future growth and unexpected downturns. As of 2026-06-30, Manhattan Bridge Capital Inc’s dividend payout ratio is 1.08. And this may suggest that the company’s dividend may not be sustainable, since it is paying out more than it earns.
Manhattan Bridge Capital Inc’s profitability rank offers an understanding of the company’s earnings prowess relative to its peers. GuruFocus ranks Manhattan Bridge Capital Inc’s profitability 8 out of 10 as of 2026-06-30, suggesting good profitability prospects. The company has reported positive net income for each year over the past decade, further solidifying its high profitability. This long track record of profitability stands in contrast to the elevated payout ratio, an important tension for investors to weigh.
Growth Metrics: The Future Outlook
To ensure the sustainability of dividends, a company must have robust growth metrics. Manhattan Bridge Capital Inc’s growth rank of 8 out of 10 suggests that the company’s growth trajectory is good relative to its competitors. A strong growth rank indicates that the company has demonstrated above-average expansion in key financial metrics, which can help support dividend payments over time even when the payout ratio runs high.
Revenue is the lifeblood of any company, and Manhattan Bridge Capital Inc’s revenue per share, combined with the 3-year revenue growth rate, indicates a strong revenue model. Manhattan Bridge Capital Inc’s revenue has increased by approximately 0.50% per year on average, a rate that underperforms approximately 65.82% of global competitors. This modest top-line expansion suggests the company is not growing its loan portfolio rapidly, which limits its ability to outgrow a stretched payout ratio.
The company’s 3-year EPS growth rate showcases its capability to grow its earnings, a critical component for sustaining dividends in the long run. During the past three years, Manhattan Bridge Capital Inc’s earnings increased by approximately -0.50% per year on average, a rate that underperforms approximately 55.31% of global competitors. Flat-to-declining earnings, combined with a payout ratio above 1.0, is a combination that warrants caution.
Lastly, the company’s 5-year EBITDA growth rate of 1.70%, which underperforms approximately 52.81% of global competitors, points to only marginal operating-level expansion. EBITDA, or earnings before interest, taxes, depreciation, and amortization, is often used as a rough proxy for operating cash flow. Taken together, these growth metrics paint a picture of a stable but slow-growing lender rather than a rapidly compounding business.
Next Steps for Dividend Investors
Manhattan Bridge Capital Inc offers income investors a compelling headline yield of roughly 12%, backed by a decade of consistent quarterly payments and positive net income every year. However, the payout ratio of 1.08 and the negative three-year dividend growth rate raise legitimate sustainability concerns, even as the company’s profitability and growth ranks remain solid at 8 out of 10. Value investors should weigh the attractive current income against the risk of a future dividend adjustment, and monitor upcoming quarterly declarations and earnings reports for signs of stabilization. Will Manhattan Bridge Capital Inc’s lending model generate enough earnings growth to bring its payout back in line, or will the high yield prove too good to last?
GuruFocus Premium users can screen for high-dividend yield stocks using the High Dividend Yield Screener.
Also check out: (Free Trial)
This stock alert was generated using automated technology and GuruFocus financial data to provide readers with timely and accurate market reporting. This content was reviewed by GuruFocus editorial team prior to publication. Please send any questions or comments about this story to [email protected].