
Time to read [8 minutes]
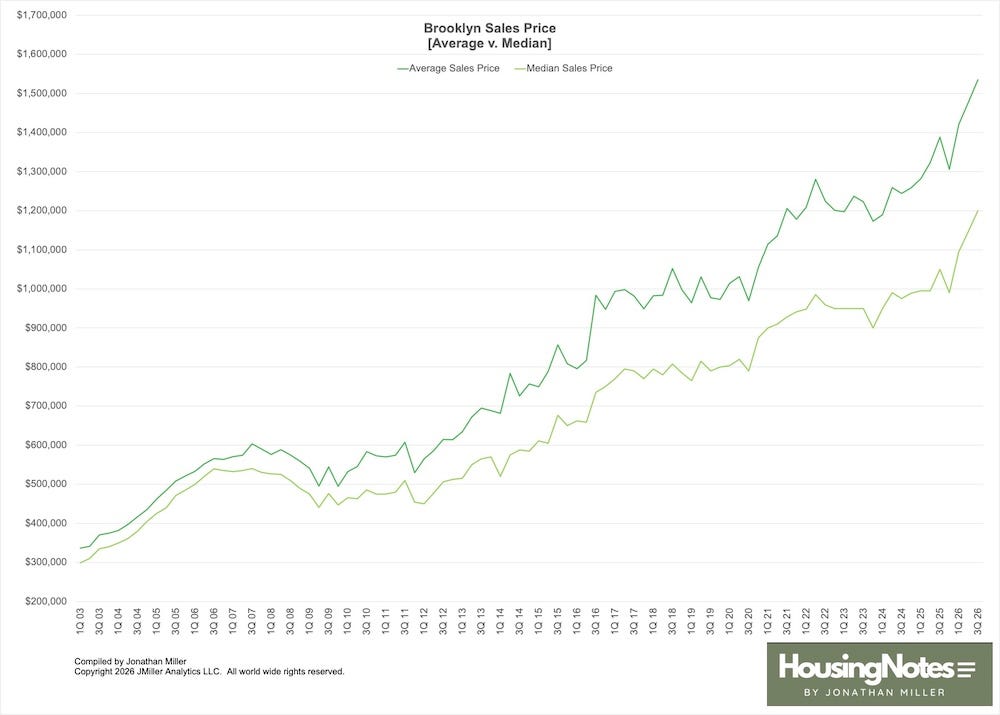
Median and average sales prices reached their highest levels in history
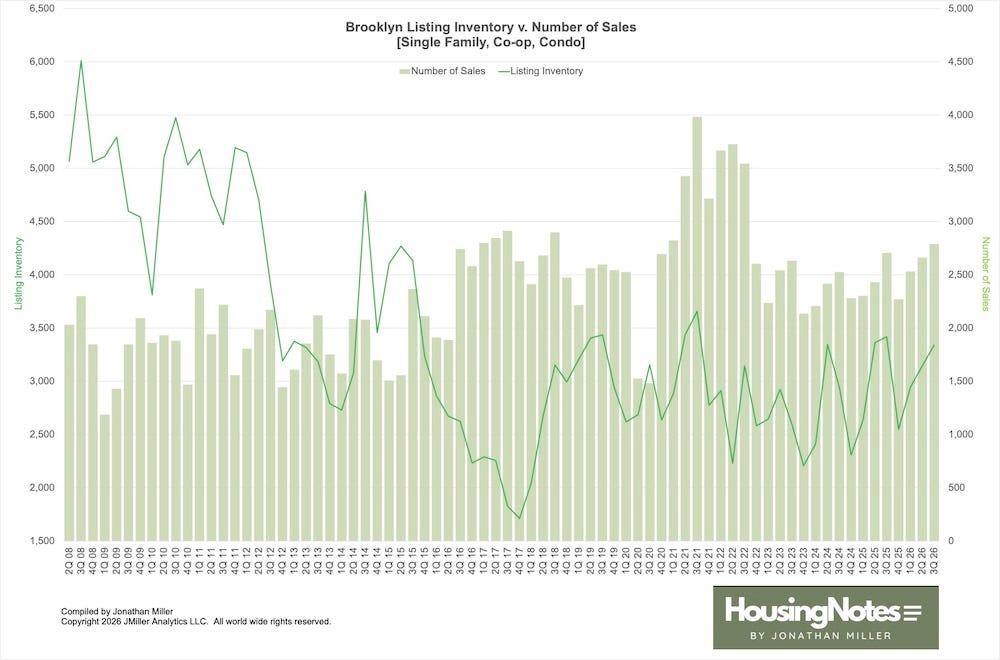
Sales saw a slight annual gain against a modest decline in inventory
Listing discount went negative, meaning the average sales price was higher than the average list price
Significant annual gains in sales were seen from $2-$7 million
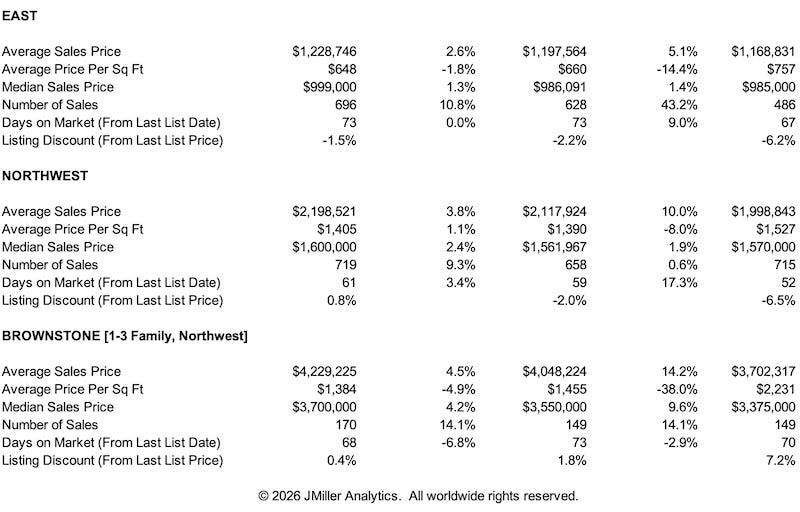
East Brooklyn saw the largest price gains as borough luxury grew much faster than all property types
The median sales prices for condos, 1-3 families, non-luxury, and the luxury market all reached new highs, as did all regions we track across the borough
After 16 years of reporting on the Brooklyn housing market through a national brokerage firm, I’ve partnered with the Real Deal to continue the series with quarterly releases. Many HousingNotes.com readers reached out and asked me to consider continuing the coverage. Of course, I had to consider that one in four Americans has an ancestor born in Brooklyn. The Brooklyn Sales Report content will expand as I get situated with new resources. But for now, here it is:
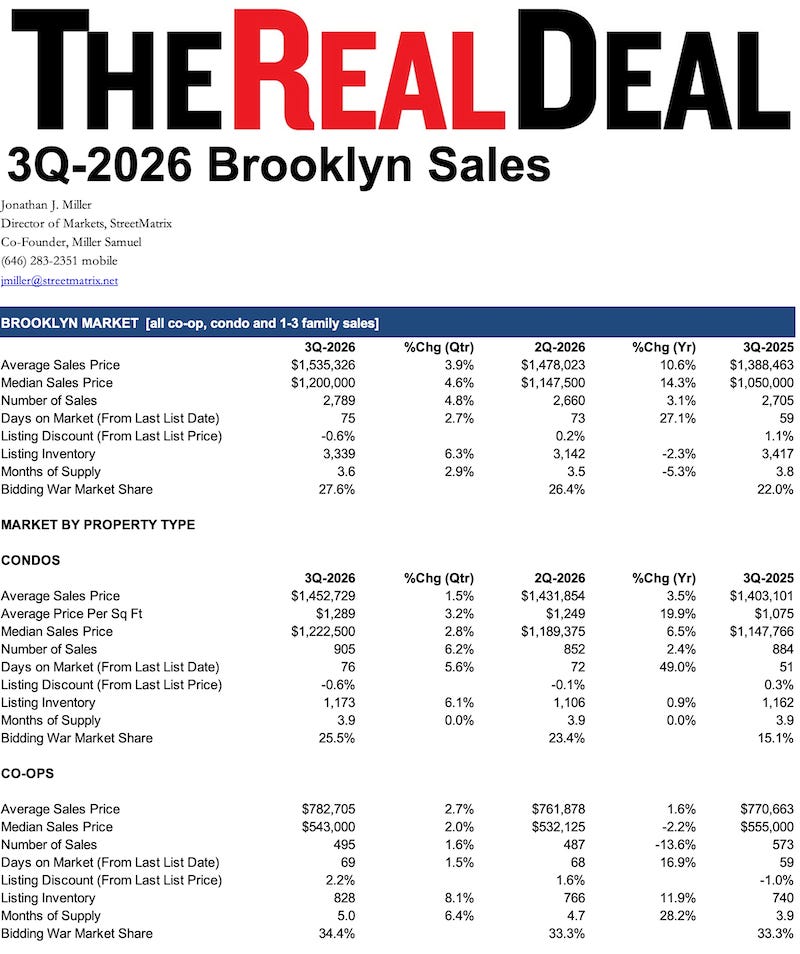
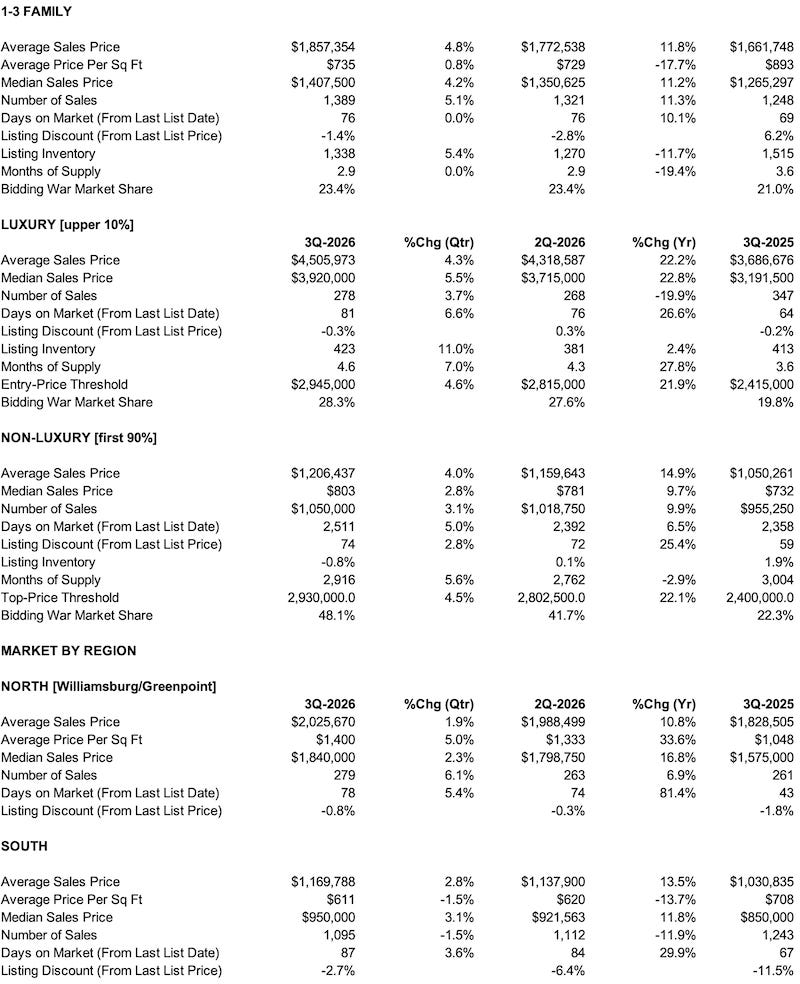
While prices keep rising, listing inventory has been sliding while sales have been expanding. The median sales price in Brooklyn was $1,200,000 this quarter, up 14.3% year over year and quickly closing in on Manhattan, which set a record at $1,250,000. The average sales price rose 10.6% over the same period to a new high of $1,535,326.
Median sales prices have reached record levels across the condo, 1-3 family, and luxury markets, with co-ops as the outlier. Median sales prices have also hit new highs across the regions we cover in the borough, including North, Northwest, Brownstone, and South Brooklyn, with East Brooklyn as the outlier. In both breakdowns, lower-priced properties are more vulnerable to the surge in mortgage rates.
While inventory isn’t collapsing to push prices up so rapidly, supply slipped 2.3% year over year to 3,339. In fact, third-quarter results were 8.9% higher than the decade average of 3,065. This is because listing inventory has been chronically low since about 2013. Supply isn’t newly tight. Supply has been unusually tight for years.
Evidence of inadequate supply shows up in the market share of bidding wars, my proxy for sales that close above the last asking price. The third-quarter decade average was 22.9%, below this quarter’s 27.6% average.
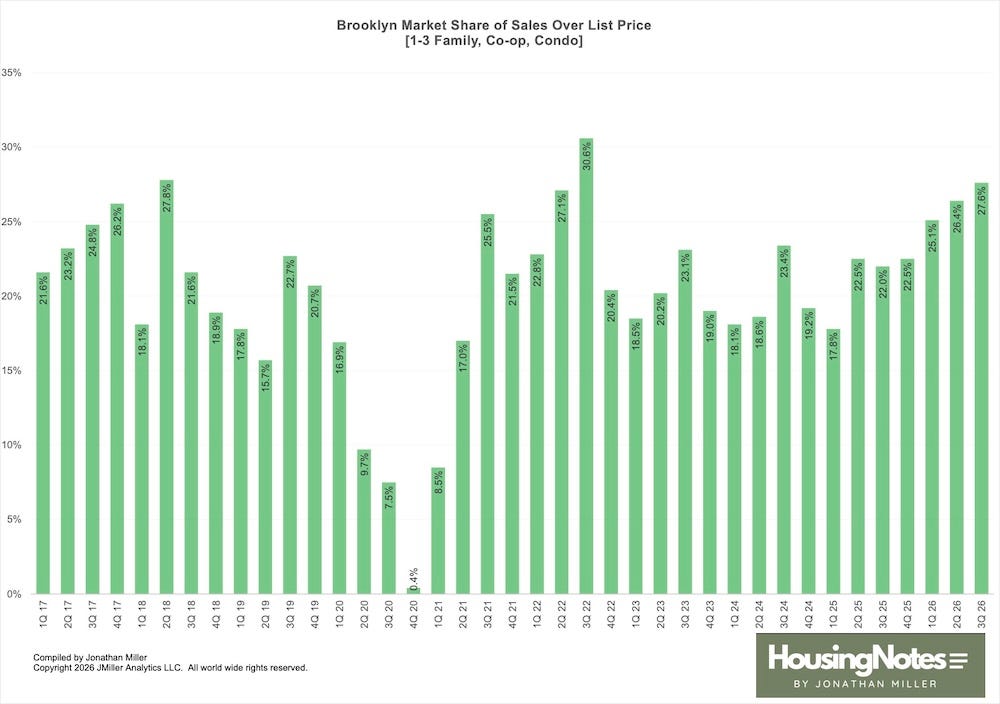
Brooklyn’s market continues to bifurcate as borrowing costs rise: cash-rich and luxury buyers absorb higher mortgage rates or pay cash, driving record-setting activity in the $2M–$7M segment, while entry-level, financing-dependent buyers face a clear affordability ceiling, leaving co-ops and East Brooklyn as notable outliers. At the same time, this price escalation is driven not by a sudden inventory collapse, as active supply sits roughly 9% above its 10-year seasonal baseline, but by a structural deficit that has persisted since 2013 and has continuously funneled buyer demand into bidding wars.
The Actual Final Thought – An important lesson on applying the right information to get your answer. Ha.

My Housing Notes column also appears several times a week over at The Real Deal!
