

Much of New York City does not stand on solid rock. Under parts of Lower Manhattan, Brooklyn and Queens lie sand, silt, soft clay left by ancient lakes, and artificial fill dumped to create new land along the shore. On top of that ground stand 1,084,954 buildings.
In 2023, a team led by geophysicist Tom Parsons of the US Geological Survey set out to calculate what that weight does to the ground. The buildings and their contents came to about 1.68 trillion pounds, roughly 762 billion kilograms, and that left out roads, sidewalks, bridges and railways.
Fed into a computer model of the ground beneath the five boroughs, that load produced a striking result. On the softest soils, the buildings could compress the ground by as much as 600 millimeters, about 24 inches.
Soft Soil Sets the Danger
The study, published in Earth’s Future by Parsons and colleagues at the University of Rhode Island, mapped where the city’s weight sits and what lies beneath it. The answer depended heavily on the ground.
The calculated settlement from buildings ranged from zero to 600 millimeters, depending on the properties of the rock and soil and the type of foundation, according to the USGS summary of the paper. Where foundations are anchored in bedrock, as with much of Midtown Manhattan’s skyscrapers, modeled settlement is close to zero.
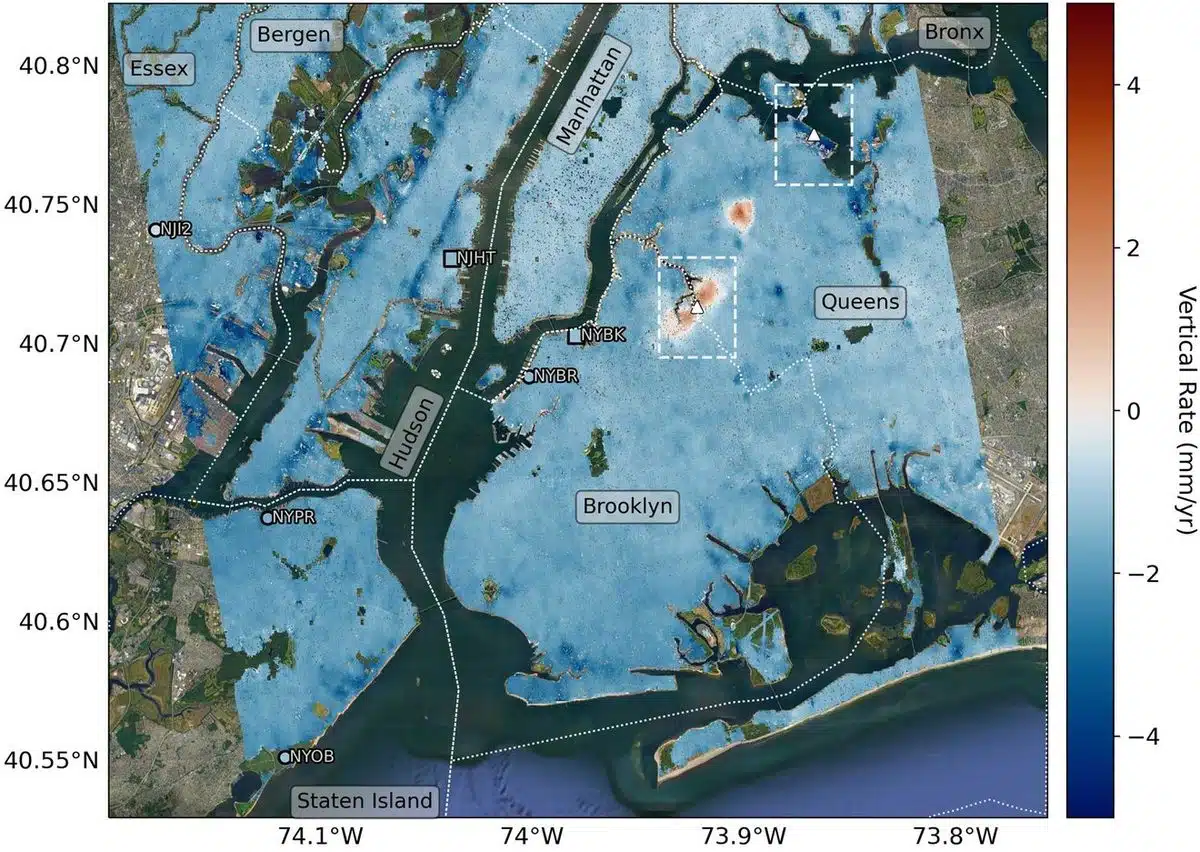 Mapping vertical land motion across the New York City area, researchers found the land sinking (indicated in blue) by about 0.06 inches (1.6 millimeters) per year on average. They also detected modest uplift (shown in red) in Queens and Brooklyn. White dotted lines indicate county/borough borders. Credit: NASA/JPL-Caltech/Rutgers University
Clay-rich soils and artificial fill behave very differently. In those areas, the model gave values from 75 to 600 millimeters, with a median of 294 millimeters, about the length of a ruler.
These are calculated totals for the load the buildings exert, under a range of assumptions about the ground. They are not a yearly rate, and they are not a forecast of how far the city will drop.
Satellites Point to the Ice Age
To check the model against reality, the team compared it with satellite radar and GPS measurements of the ground’s height. The city is sinking by 1 to 2 millimeters (0.04 to 0.08 inches) a year on average, a process called subsidence. But the authors write that this rate matches the slow regional sinking left over from the last ice age, though some areas are sinking significantly faster.
That ice-age effect was mapped in finer detail later in 2023 by researchers at NASA’s Jet Propulsion Laboratory and Rutgers University, in the journal Science Advances. About 24,000 years ago, an ice sheet covered most of New England, and ice more than a mile thick sat over what is now Albany. The weight pressed down the land beneath it and pushed up the land around its edge, including New York City.
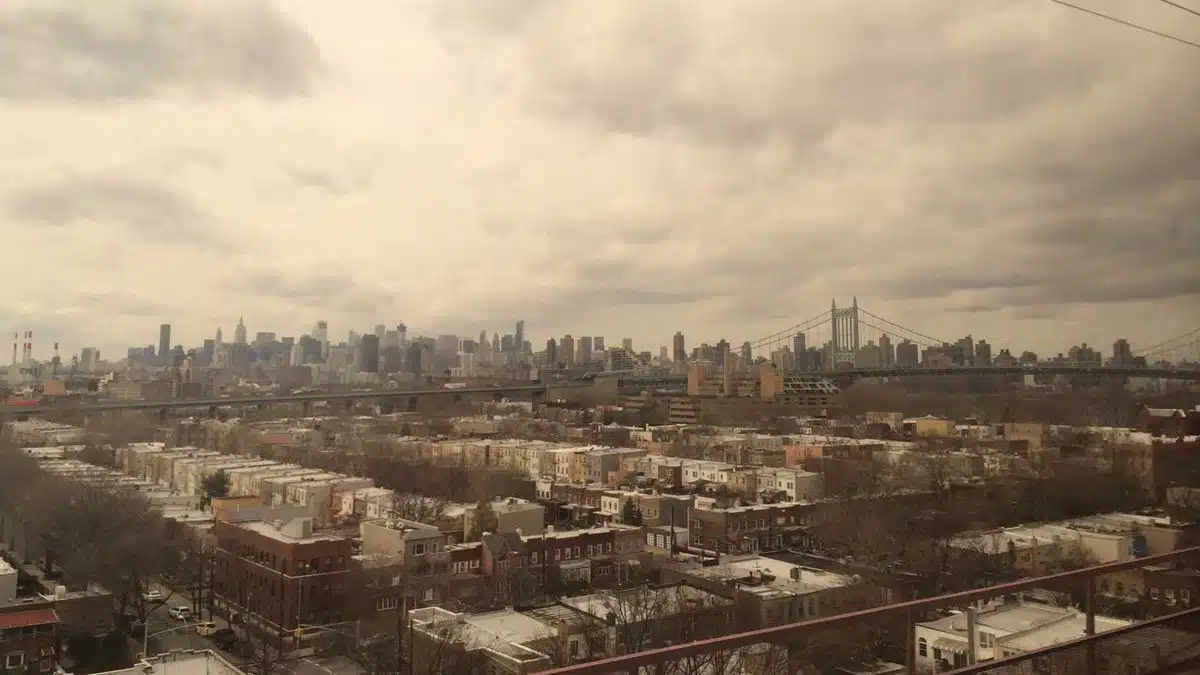 The land beneath the New York City area, including the borough of Queens, pictured here, is moving by fractions of inches each year. The motions are a legacy of the ice age and also due to human land usage. Credit: NASA/JPL-Caltech
Since the ice melted, Earth’s mantle has been slowly readjusting, and the raised land is settling back down. Using radar from the European Space Agency’s Sentinel-1 satellites between 2016 and 2023, the NASA-led team found the metropolitan area sinking by about 1.6 millimeters a year on average, which NASA compared to how much a toenail grows in a month.
Filled Land Is Sinking Fastest
Where the ground is made, the satellites tell the same story as the model. Lead author Brett Buzzanga, a postdoctoral researcher at JPL, said the detailed map revealed features “that haven’t been noticed before,” and most of the fastest-sinking spots sit on fill.
Runway 13/31 at LaGuardia Airport in Queens, built on a landfill, is sinking about 3.7 millimeters a year. The southern part of Governors Island, built from rock and dirt dug out for early 20th-century subway tunnels, is also subsiding quickly, as are filled land at Coney Island, Arverne by the Sea and Rikers Island.
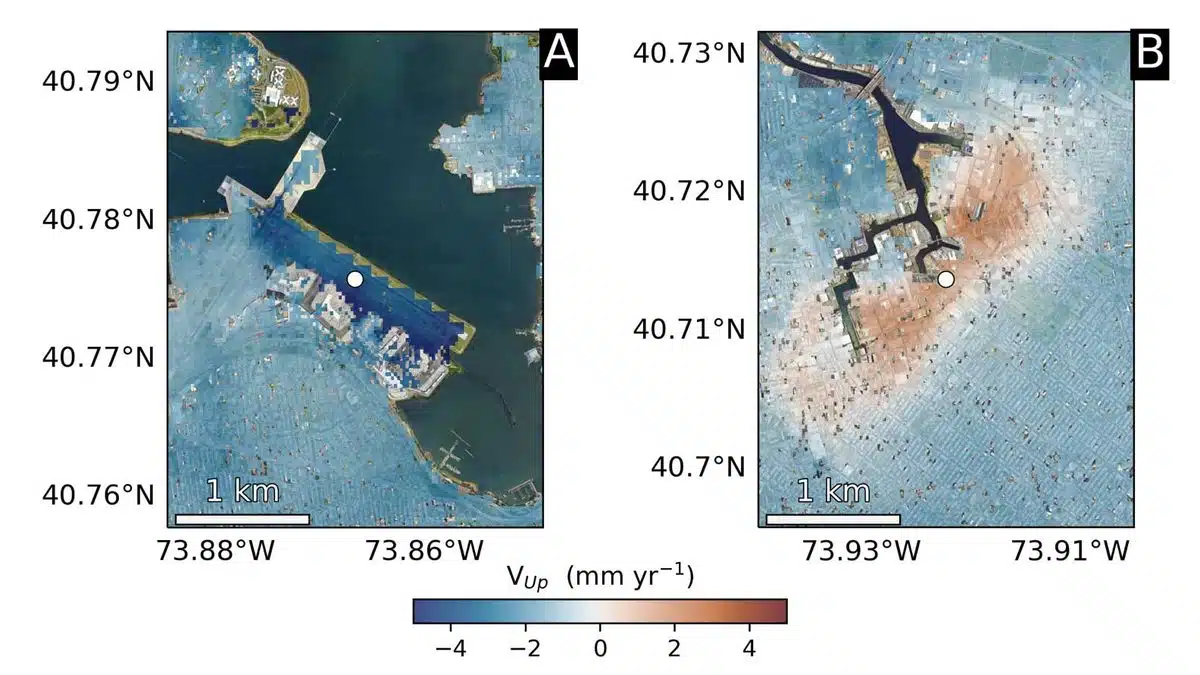 The team pinpointed hot spots: left, runway 13/31 at LaGuardia Airport in Queens, is subsiding at a rate of about 0.15 inches (3.7 millimeters) per year; right, part of Newtown Creek, a Superfund site in East Williamsburg, Brooklyn, is rising unevenly. Credit: NASA/JPL-Caltech/Rutgers University
A few places are going the other way. Part of East Williamsburg in Brooklyn is rising about 1.6 millimeters a year, and Woodside in Queens rose about 6.9 millimeters a year between 2016 and 2019 before stabilizing. Co-author Robert Kopp of Rutgers said groundwater pumping and injection wells used to treat polluted water may have played a role, but that the cause needs more study.
Parsons and his colleagues argued that each new high-rise on soft ground near water could contribute to future flood risk, and that mitigation may need to be built into how coastal cities grow. Superstorm Sandy in 2012 and the remnants of Hurricane Ida in 2021 both showed how fast the city can flood.
One New York landmark was designed partly to limit that load. Arthur Ashe Stadium, home of the US Open tennis tournament, is sinking about 4.6 millimeters a year, faster than anywhere else in NASA’s list of hot spots. When the stadium was renovated, it got a lightweight roof to reduce its weight and how much it sinks.