
December 1, 2025
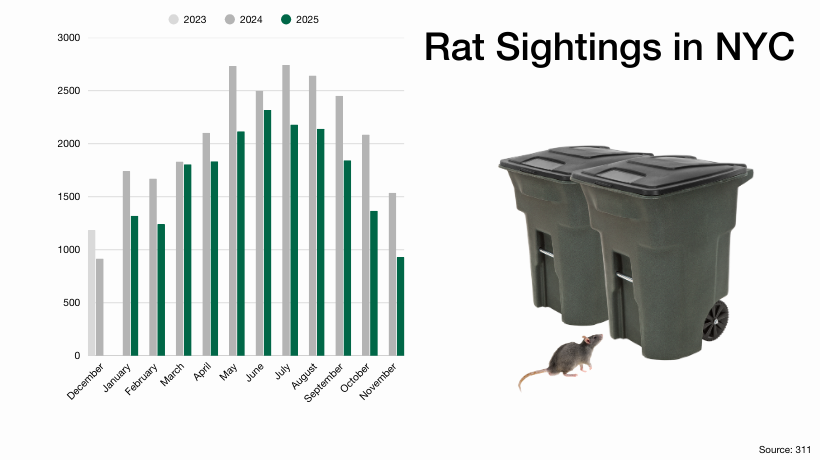
311 reports of rat sightings have fallen every month since residential containerization requirements went into effect last November
The New York City Department of Sanitation (DSNY) announced today that rats are on the run: In a shocking development, rat sightings reported to 311 have declined for 12 straight months when compared to the same month one year earlier, representing an overall decline of more than 20 percent.
The flight of the rats coincides with the requirement last November that all buildings with 1 to 9 residential units put their trash in sealed bins, removing a significant source of rat food from our streets. This persistent, ongoing decline in rat sightings proves that a cleaner city IS possible.
In addition, all New York City businesses have been required to put their trash in sealed bins for roughly two years. And all food waste – from all businesses and all residences – is required to be in sealed bins. Taken together, these rules mean that more than 70 percent of New York City trash is required to be in containers, a true Trash Revolution.
DSNY is also coming for the remaining 30 percent of trash: Last June, Manhattan Community Board 9 – covering all of West Harlem – became the first neighborhood to fully containerize its trash, with the installation of on-street Empire Bins for trash from high-density residential buildings. Next year, Empire Bins will be in Brooklyn Community Board 2, making it the second district in the city to fully containerize its trash.
From December 2023 to November 2024, New York City residents reported 25,230 rat sightings. For the same period one year later, that number plummeted to 20,025, a 20.6 percent decline. A month-by month breakdown follows:
November
2025: 931
2024: 1,537
Change: -606
Percentage Change: -39.4
October
2025: 1,367
2024: 2,086
Change: -719
Percentage Change: -34.5
September
2025: 1,845
2024: 2,452
Change: -607
Percentage Change: -24.8
August
2025: 2,141
2024: 2,644
Change: -503
Percentage Change: -19.0
July
2025: 2,182
2024: 2,743
Change: -561
Percentage Change: -20.5
June
2025: 2,319
2024: 2,500
Change: -181
Percentage Change: -7.2
May
2025: 2,118
2024: 2,733
Change: -615
Percentage Change: -22.5
April
2025: 1,835
2024: 2,103
Change: -268
Percentage Change: -12.7
March
2025: 1,807
2024: 1,833
Change: -26
Percentage Change: -1.4
February
2025: 1,242
2024: 1,672
Change: -430
Percentage Change: -25.7
January
2025: 1,320
2024: 1,742
Change: -422
Percentage Change: -24.2
December
2024: 918
2023: 1,185
Change: -267
Percentage Change: -22.5