

Manhattan Associates (MANH) has rolled out commercially available AI Agents across all Manhattan Active solutions, integrating them directly into real time operations. For investors, the focus now is how this AI initiative aligns with the company’s current fundamentals.
See our latest analysis for Manhattan Associates.
Despite the fanfare around AI Agents and new omni channel tools, the share price tells a mixed story, with a 4.96% year to date share price return but a 36.26% decline in total shareholder return over the past year. However, the 3 year and 5 year total shareholder returns of 45.44% and 48.52% point to a more resilient longer term record.
If this kind of AI led supply chain software story interests you, it could be worth broadening your search with other high growth tech and AI names using our high growth tech and AI stocks.
With revenue of US$1.07b, net income of US$216.01m and the shares trading at US$175.57, along with indications of a potential discount to some valuation estimates, is there still a buying opportunity here or is future growth already priced in?
Price-to-Earnings of 49x: Is it justified?
With Manhattan Associates closing at US$175.57 and trading on a P/E of 49x, the shares look expensive when you line them up against peers.
The P/E ratio compares what you pay today with the company’s current earnings per share. For a software name like Manhattan Associates, a higher P/E often reflects investor expectations around future profit growth, business quality and the strength of its software and services model.
Here, the market is placing a higher price on each dollar of earnings compared both to similar companies and to an estimated fair level. Manhattan Associates is described as expensive versus the peer average P/E of 29.2x, expensive versus the wider US software industry average of 31.8x, and also expensive against an estimated fair P/E of 31.3x that our fair ratio work suggests the market could eventually move toward.
Explore the SWS fair ratio for Manhattan Associates
Result: Price-to-Earnings of 49x (OVERVALUED)
However, the premium P/E and the recent 1-year total shareholder return decline of 36.26% leave little room for disappointment if AI adoption or enterprise IT budgets soften.
Find out about the key risks to this Manhattan Associates narrative.
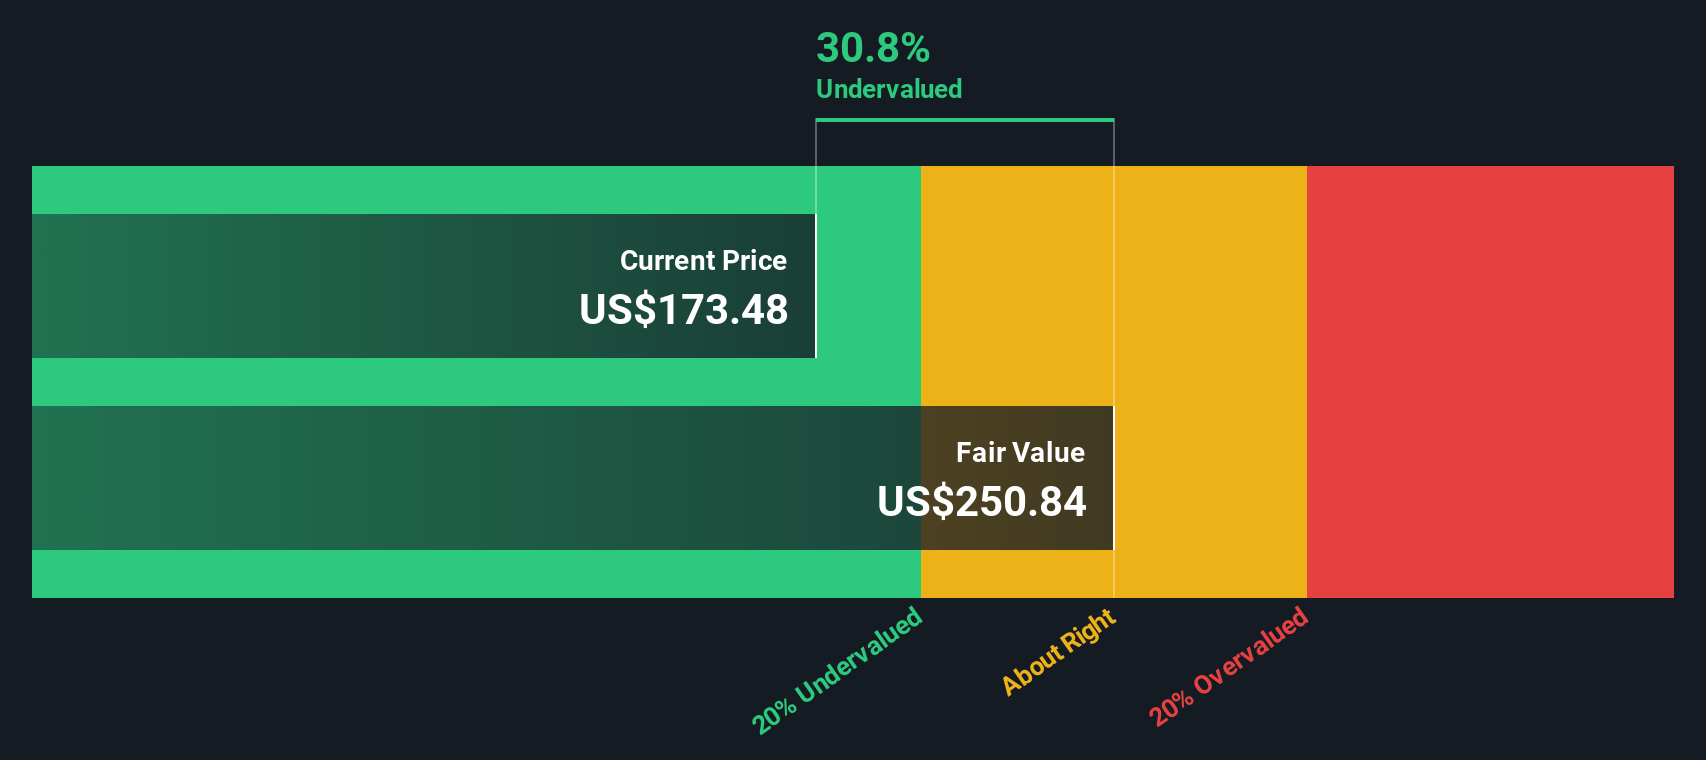
Another View: DCF Points to Undervaluation
While the 49x P/E suggests Manhattan Associates is expensive, our DCF model tells a different story. At US$175.57, the shares are described as trading about 30.1% below an estimated fair value of US$251.25. That raises a simple question: is the market being too cautious?
Look into how the SWS DCF model arrives at its fair value.
 MANH Discounted Cash Flow as at Jan 2026
Simply Wall St performs a discounted cash flow (DCF) on every stock in the world every day (check out Manhattan Associates for example). We show the entire calculation in full. You can track the result in your watchlist or portfolio and be alerted when this changes, or use our stock screener to discover 868 undervalued stocks based on their cash flows. If you save a screener we even alert you when new companies match – so you never miss a potential opportunity.
Build Your Own Manhattan Associates Narrative
If you see the numbers differently, or prefer to pressure test the assumptions yourself, you can build and refine your own view in minutes with Do it your way.
A good starting point is our analysis highlighting 3 key rewards investors are optimistic about regarding Manhattan Associates.
Looking for more investment ideas?
If Manhattan Associates has your attention, do not stop here. Broaden your watchlist with a few targeted screens that could surface opportunities you might otherwise miss.
This article by Simply Wall St is general in nature. We provide commentary based on historical data
and analyst forecasts only using an unbiased methodology and our articles are not intended to be financial advice. It does not constitute a recommendation to buy or sell any stock, and does not take account of your objectives, or your
financial situation. We aim to bring you long-term focused analysis driven by fundamental data.
Note that our analysis may not factor in the latest price-sensitive company announcements or qualitative material.
Simply Wall St has no position in any stocks mentioned.
New: Manage All Your Stock Portfolios in One Place
We’ve created the ultimate portfolio companion for stock investors, and it’s free.
• Connect an unlimited number of Portfolios and see your total in one currency
• Be alerted to new Warning Signs or Risks via email or mobile
• Track the Fair Value of your stocks
Have feedback on this article? Concerned about the content? Get in touch with us directly. Alternatively, email editorial-team@simplywallst.com