

Rainforest Distribution Corp.’s decision to implement Manhattan Associates (MANH) Active Supply Chain Planning puts fresh attention on the company’s AI driven, cloud native platform and its role in real time supply chain visibility.
See our latest analysis for Manhattan Associates.
Despite client wins like Rainforest Distribution, Manhattan Associates’ recent momentum has cooled, with a 30 day share price return showing a 4.8% decline and a 90 day share price return showing a 22% decline, while the 5 year total shareholder return of 15.5% still points to a more constructive longer term picture.
If you are comparing Manhattan’s AI driven supply chain story with other technology names, this is a good moment to scan 35 AI infrastructure stocks for fresh ideas beyond a single stock focus.
With the shares down over the past year but trading at a discount to some analyst and intrinsic estimates, you have to ask yourself: Is Manhattan Associates quietly undervalued, or is the market already pricing in future growth?
Most Popular Narrative: 14.2% Undervalued
With Manhattan Associates last closing at $137.32 against a widely followed fair value of $160, the current gap puts the spotlight firmly on the assumptions behind that estimate.
The assumed bearish price target for Manhattan Associates is $176.29, which represents one standard deviation below the consensus price target of $205.11. This valuation is based on what can be assumed as the expectations of Manhattan Associates’s future earnings growth, profit margins and other risk factors from analysts on the more bearish end of the spectrum.
Want to see what justifies a fair value above today’s price even in a bearish setup? The narrative is based on measured revenue growth, steady margins, and a future earnings multiple that assumes investors continue to assign a relatively high valuation. Curious how those factors combine to support $160 as a central anchor rather than an optimistic outlier?
Result: Fair Value of $160 (UNDERVALUED)
Have a read of the narrative in full and understand what’s behind the forecasts.
However, there is still a real risk that slower cloud migrations and longer implementation timelines, alongside macro and geopolitical pressures on customer budgets, could challenge this undervaluation story.
Find out about the key risks to this Manhattan Associates narrative.
Another View: Rich Multiples Against a “Cheap” Fair Value
The model fair value of $160 and a 40.2% discount to intrinsic value might suggest room for upside, but the market is telling a different story. At a P/E of 37.4x versus a fair ratio of 26.7x, and above both the US Software industry average of 29.4x and peer average of 27x, Manhattan Associates is priced more like a quality premium than a clear bargain. Is that premium simply the cost of a strong franchise, or a sign that expectations leave less room for error?
Before leaning on one method over the other, it can help to see how this richer multiple stacks up against the full valuation breakdown, including the fair ratio and peer comparisons, in one place: See what the numbers say about this price — find out in our valuation breakdown.
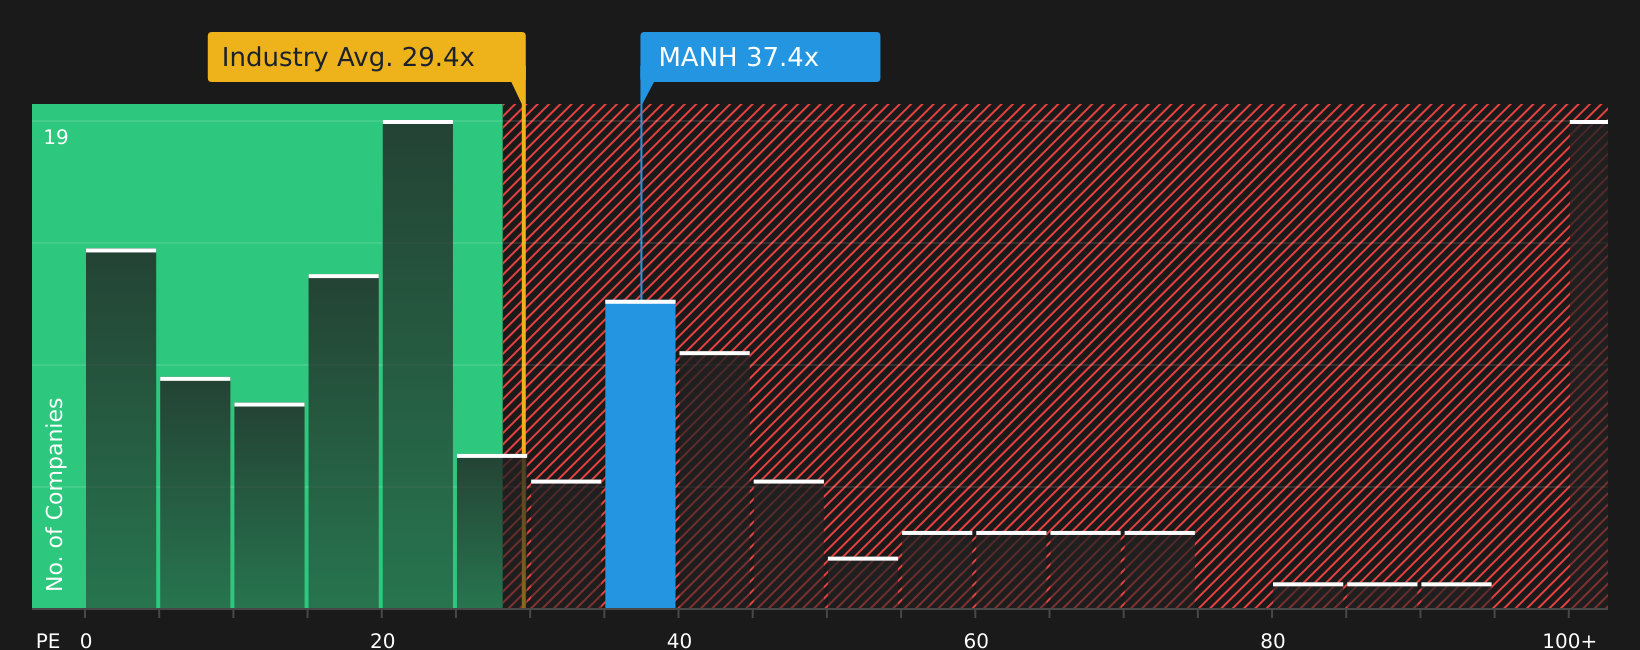 NasdaqGS:MANH P/E Ratio as at Mar 2026Next Steps
If the mixed signals so far leave you unsure, take a closer look at the underlying drivers and decide quickly where you stand on Manhattan Associates, starting with the company’s 3 key rewards.
Ready for more investment ideas?
If Manhattan Associates has your attention, do not stop here. Broader opportunities often emerge when you compare it with other stocks that share similar quality traits.
This article by Simply Wall St is general in nature. We provide commentary based on historical data
and analyst forecasts only using an unbiased methodology and our articles are not intended to be financial advice. It does not constitute a recommendation to buy or sell any stock, and does not take account of your objectives, or your
financial situation. We aim to bring you long-term focused analysis driven by fundamental data.
Note that our analysis may not factor in the latest price-sensitive company announcements or qualitative material.
Simply Wall St has no position in any stocks mentioned.
New: Manage All Your Stock Portfolios in One Place
We’ve created the ultimate portfolio companion for stock investors, and it’s free.
• Connect an unlimited number of Portfolios and see your total in one currency
• Be alerted to new Warning Signs or Risks via email or mobile
• Track the Fair Value of your stocks
Have feedback on this article? Concerned about the content? Get in touch with us directly. Alternatively, email editorial-team@simplywallst.com