
Key Highlights
New York ranks 2nd safest nationally with a fatal interstate rollover rate of 0.014 per 100 million VMT, making it 7.8 times safer than the Mountain West regional average of 0.108, the widest regional gap in the dataset.
New York logs the same number of total fatal rollover crashes in five years (79) as Montana logs in five years on just 13,138 million VMT annually, roughly 11 percent of New York’s traffic volume, exposing a dramatic efficiency gap between the two states.
New York outperforms the average of every U.S. geographic region: it is 2.3x safer than the Northeast average, 2.5x safer than the Midwest, 3.2x safer than the Sun Belt, 2.8x safer than the Pacific Coast, and 7.8x safer than the Mountain West.
 Every spring, millions of drivers merge onto New York’s interstates for road trips, weekend escapes, and cross-state hauls. They join one of the busiest highway networks in the country, one that absorbs more than 113 billion vehicle miles of traffic every year. What most of them do not realize is that they are also driving on one of the safest.
Five years of federal crash data tell a remarkably consistent story. From 2019 through 2023, New York averaged just 15.8 fatal interstate rollover crashes per year. That translates to a rate of 0.014 per 100 million vehicle miles traveled, placing the state second safest in the entire nation. On its own, the number is impressive. Measured against every U.S. region, it becomes exceptional.
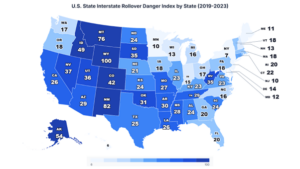
The study by Grigor Law Injury & Car Accident Lawyers draws on National Highway Traffic Safety Administration Fatality Analysis Reporting System records for all fatal crashes on Interstate Highway System routes involving a rollover from 2019 through 2023. Rates use Federal Highway Administration vehicle miles traveled data to rank all 50 states from safest to most dangerous.
Ranked Second in the Nation And It’s Not Even Close
Rank
State
Fatal Rollover Rate per 100M VMT
Total Crashes (2019–2023)
Danger Index (out of 100)
1
Hawaii
0.012
6
6.18
2
New York
0.014
79
7.23
3
New Jersey
0.018
68
9.52
4
Minnesota
0.019
53
9.67
5
Maine
0.021
15
10.83
6
Maryland
0.023
65
12.00
7
Wisconsin
0.025
81
13.07
8
New Hampshire
0.026
17
13.46
9
Delaware
0.027
13
13.99
10
Indiana
0.028
117
14.53
New York’s precise rate of 0.01389 places it second nationally, trailing only Hawaii at 0.01188. Its Danger Index score of 7.23 is nearly half that of New Jersey, the next Northeast state, which scores 9.52. It is also less than a quarter of the national average index score of 26.66. The ten safest states cluster in the Northeast and Upper Midwest. New York stands apart from all of them by sustaining that safety record across a far heavier traffic load.
The Most Dangerous Region in America Can’t Touch New York’s Numbers
State
Annual VMT (millions)
Total Crashes (2019–2023)
Fatal Rate per 100M VMT
Danger Index (out of 100)
Rank
New York
113,756
79
0.014
7.23
2
Arizona
72,251
203
0.056
29.24
38
Utah
33,144
114
0.069
35.79
43
Nevada
27,305
97
0.071
36.97
44
Colorado
53,141
215
0.081
42.10
45
Idaho
18,729
89
0.095
49.45
46
Montana
13,138
96
0.146
76.03
48
New Mexico
26,670
209
0.157
81.54
49
Wyoming
9,990
96
0.192
100.00
50
The Mountain West is the most dangerous region in the dataset, posting an average fatal rollover rate of 0.108 per 100 million VMT. That is 7.8 times higher than New York’s figure. Every state in the region falls in the bottom 13 nationally. Wyoming, the worst performer, scores a perfect 100 on the Danger Index. Montana scores 76.03 and records 96 fatal crashes over five years on just 13,138 million annual VMT, nearly matching New York’s total crash count on less than 12 percent of its traffic. Even Colorado, a state with a substantial and well-traveled interstate network, posts a Danger Index of 42.10.
Looking at the Study, Chrissy Grigoropoulos, Founder of Grigor Law Injury & Car Accident Lawyers, Commented:
“The regional comparison is where New York’s advantage becomes impossible to dismiss. Every region in the country – Northeast, Midwest, Sun Belt, Pacific, Mountain West – has a higher average fatal rollover rate than New York posts on its own. That is not a story about one good year or one favorable corridor. It is a consistent, five-year signal that New York’s interstate system is structurally engineered to suppress rollover risk in a way no other region has matched at scale.”
79 Crashes. Now Look at How Many Miles It Took Other States to Match That.
Several states recorded a five-year fatal rollover total similar to New York’s 79 crashes. The numbers look alike on the surface. The traffic volumes behind them do not.
State
Annual VMT (millions)
Total Crashes (2019–2023)
Fatal Rate per 100M VMT
National Rank
New York
113,756
79
0.014
2 (Safest)
New Jersey
74,303
68
0.018
3
Wisconsin
64,469
81
0.025
7
Washington
58,454
95
0.033
14
Nevada
27,305
97
0.071
44
Montana
13,138
96
0.146
48
Wyoming
9,990
96
0.192
50 (Most Dangerous)
Montana and Wyoming each recorded 96 fatal rollover crashes over five years – just 17 more than New York. Montana achieved that total on only 13,138 million annual VMT. Wyoming did it on just 9,990 million. That is roughly 11 percent and 9 percent of New York’s traffic volume, respectively. Nevada’s 97 crashes come on 27,305 million VMT, less than a quarter of New York’s. Washington State carries about half of New York’s traffic and still records 95 crashes over the same period. New Jersey is the only state that approaches New York’s efficiency, and it still carries 35 percent less traffic. The raw crash counts look similar. The miles driven behind them could not be further apart.
Methodology
This analysis used the National Highway Traffic Safety Administration Fatality Analysis Reporting System to identify all fatal crashes from 2019 through 2023 on Interstate Highway System routes involving a rollover. Interstate vehicle miles traveled for the same period were sourced from FHWA Highway Statistics and averaged across the five-year window. The primary metric – fatal interstate rollover crash rate per 100 million VMT – was calculated as average annual fatal crashes divided by average annual VMT multiplied by 100,000,000. The Rollover Danger Index was derived by scaling each state’s rate relative to Wyoming, the most dangerous state, on a 0–100 scale. Regional averages are unweighted means of state-level rates within each defined region. All 50 states are ranked 1 (safest) to 50 (most dangerous).
Data Sources
About Grigor Law Injury & Car Accident Lawyers
Grigor Law Injury & Car Accident Lawyers is New York’s premier all-injury law firm, focusing on car crashes and serious injury cases. The firm pairs courtroom experience with independent traffic safety research to inform the public and support safer roads.