

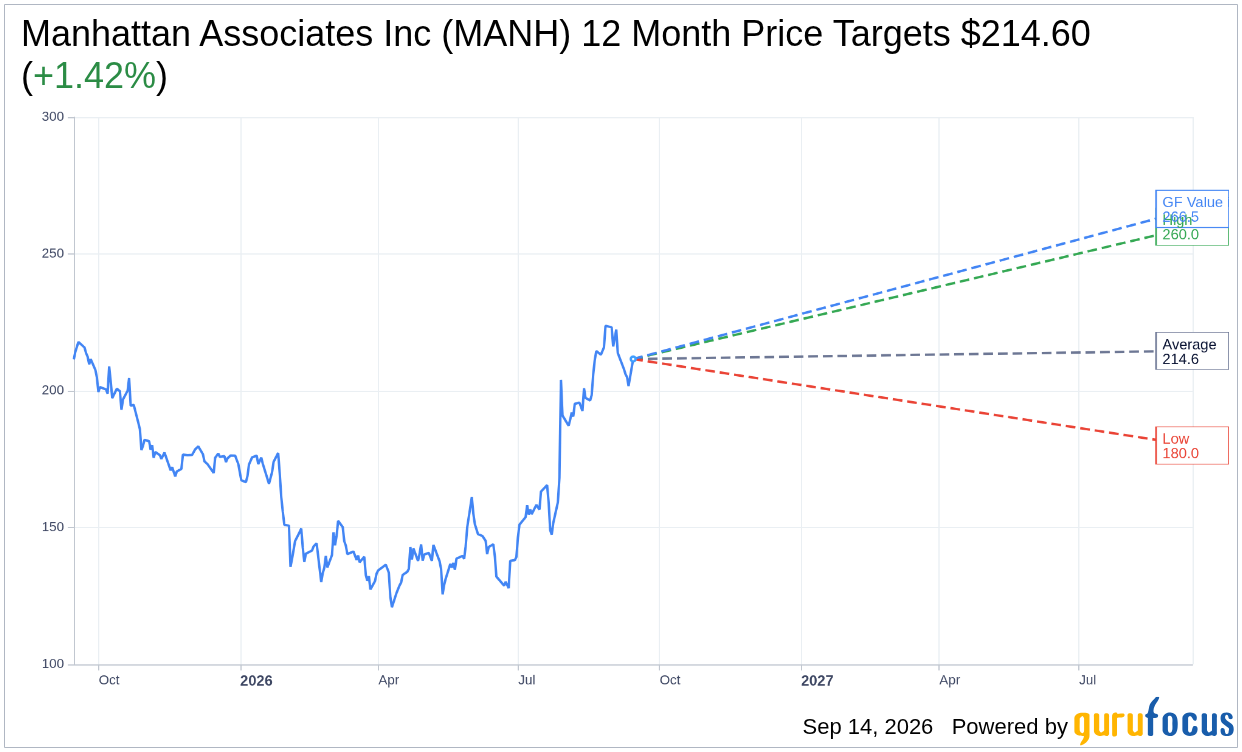
On September 14, 2026, Manhattan Associates Inc MANH shares rose 4.9% to a current price of $211.60, reflecting a notable recovery after being down 1.0% over the past week. The stock has fluctuated between a 52-week high of $227.03 and a low of $119.06.
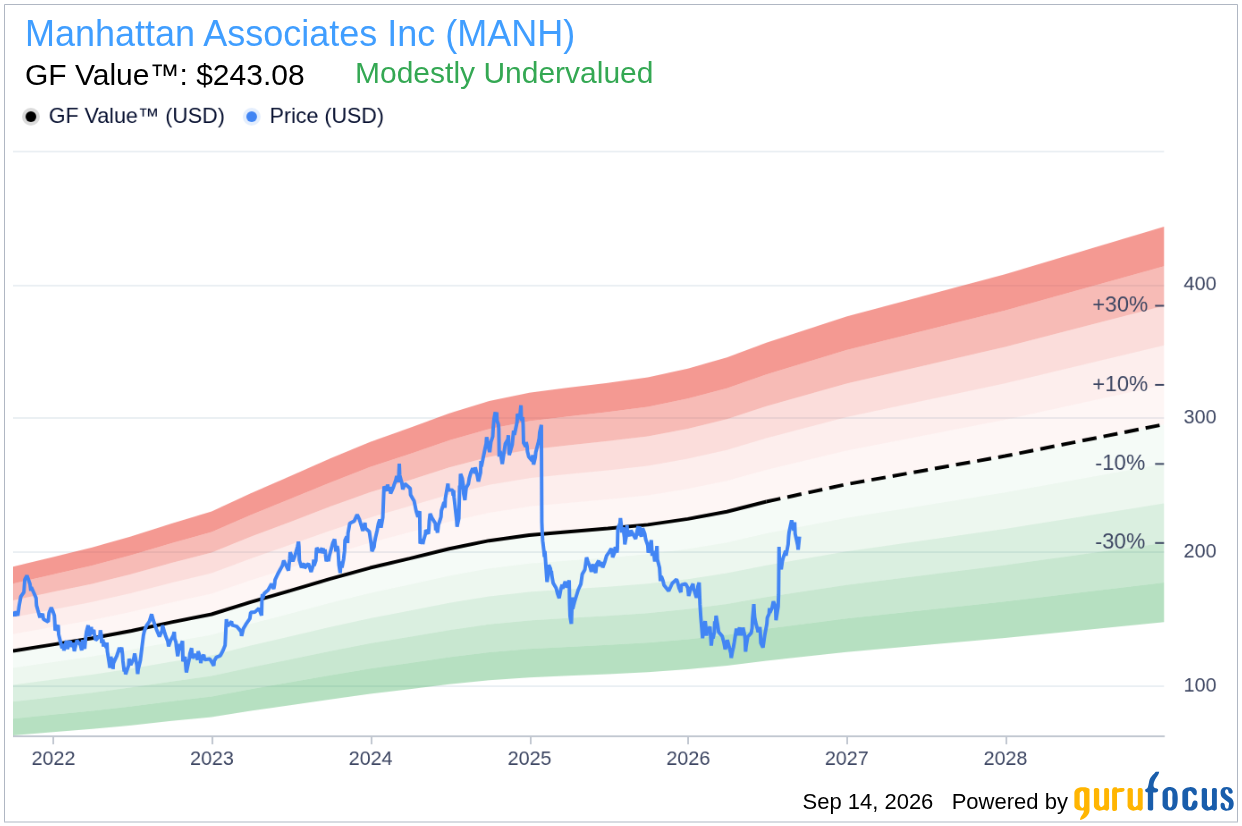
GF Value™ verdict: The stock is currently trading at 12.9% below its GF Value of $243.08.GF Score™ of 93/100 indicates strong overall performance.Insider activity shows a net sale of $3.3 million over the past year, with no insider purchases.Is MANH Overvalued or Undervalued?
According to the GF Value™, Manhattan Associates Inc appears to be undervalued, trading at $211.60 compared to its estimated fair value of $243.08. This presents a margin of safety of 12.9%, indicating a potential opportunity for investors. GF Value™ is GuruFocus’ proprietary assessment that estimates the intrinsic value of a stock based on historical trading multiples, past business performance, and future growth estimates. Being classified as “modestly undervalued,” MANH suggests that there could be favorable conditions for investment, although investors should remain cautious of market volatility.
While the current valuation provides a buffer against downside risk, the reality of the stock’s performance in the past year—showing a decline of 2.1%—highlights the importance of considering recent trends and market sentiment. The gap between the current price and GF Value™ could invite further scrutiny, particularly in light of the financial strength rating of 6/10, which suggests moderate stability.
How Does MANH’s Valuation Compare to Its History?MetricCurrentHistoricalP/E (TTM)60.6×72.1xForward P/E34.4xN/A
Currently, the P/E (TTM) of 60.6x is 16% below its 5-year median of 72.1x, indicating that the stock is trading at a lower valuation relative to its historical averages. This P/E analysis aligns with the GF Value™ assessment, reinforcing the notion that the stock is undervalued, providing a potentially appealing investment thesis.
What Does MANH’s GF Score™ Tell Us?
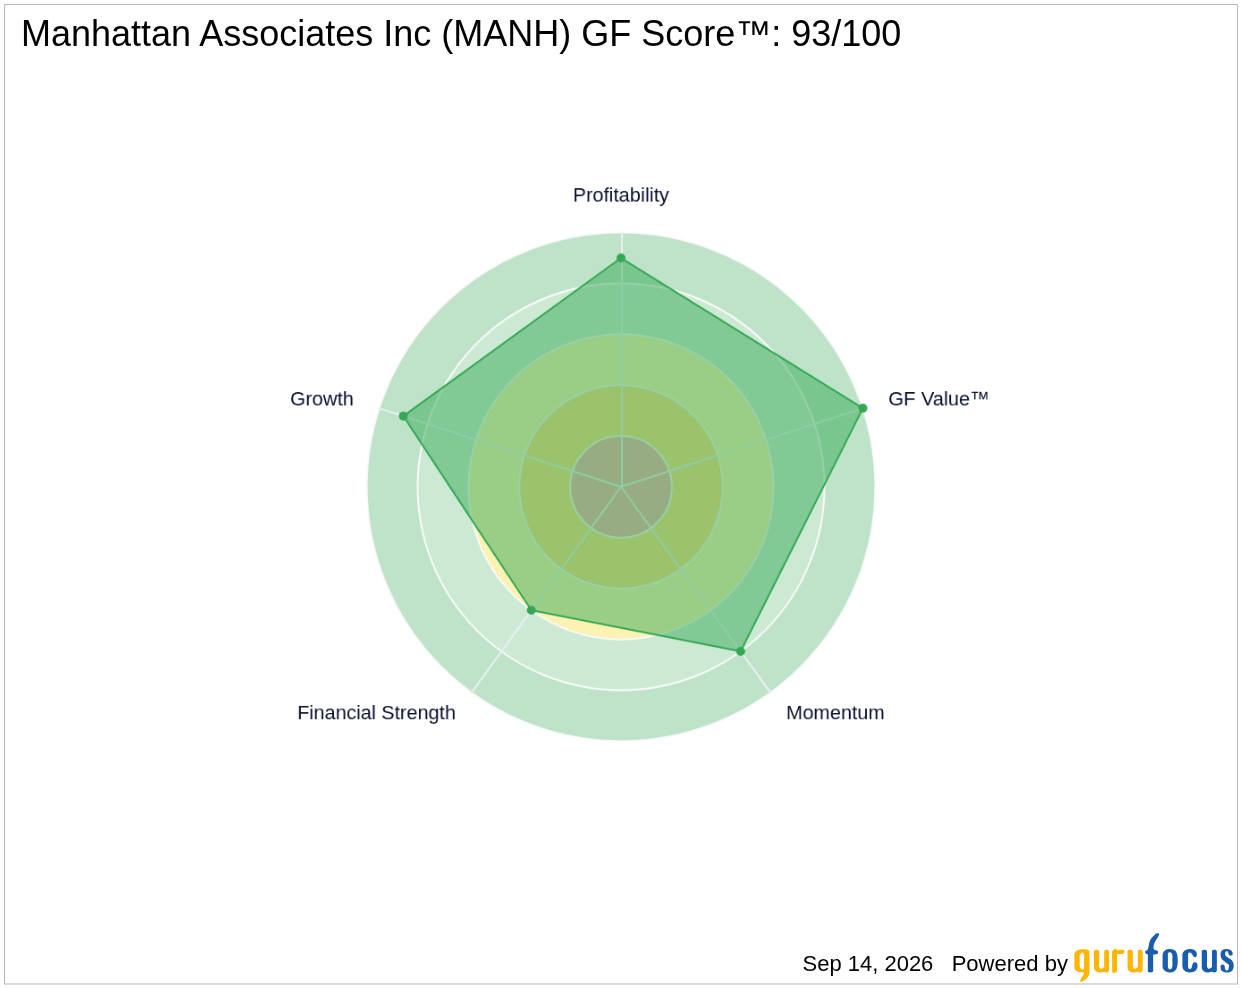
The GF Score™ measures a company’s overall financial health and growth potential, taking into account various metrics such as financial strength, profitability, growth, valuation, and momentum. Manhattan Associates Inc’s GF Score™ of 93/100 reflects a strong position, particularly in valuation and growth ranks, which are rated 10/10 and 9/10, respectively. However, its financial strength rank of 6/10 and a Piotroski F-Score of 4 indicate some areas of concern.
MetricRatingGF Score™93/100Financial Strength6/10Profitability9/10Growth9/10Valuation10/10Momentum8/10
Overall, the strong valuation and growth scores highlight a robust investment case, while the financial strength score suggests that investors should remain vigilant about potential risks. The mixed signals from the GF Score™ indicate a company that is performing well in certain key areas but may face challenges in others.
What Are Gurus and Insiders Doing with MANH?
Currently, 6 gurus hold shares of Manhattan Associates Inc, with 4 increasing their positions and 2 reducing their holdings in recent quarters. This activity suggests that market experts still see potential in the stock, despite some trimming by a few. The lack of insider buying, coupled with $3.3 million in net insider sales over the past 12 months, could be a point of concern for potential investors, indicating that insiders may not be confident in the current valuation or short-term prospects.
The divergent trends between guru activity and insider selling highlight a complex picture. While the guru additions present a favorable signal, the absence of insider buying may suggest caution regarding the stock’s outlook. Investors may want to weigh these signals carefully as they consider their approach to MANH.
What This Means for Investors
Based on the analysis of GF Value™, Manhattan Associates Inc is currently undervalued, presenting a potential opportunity for investors to consider. However, the insights regarding insider activity, along with the mixed signals in financial strength, warrant a careful approach. Investors should conduct thorough due diligence before making any decisions regarding their positions in MANH.
For further details on Manhattan Associates Inc MANH, visit the stock page or explore the GF Value™ page for more insights.
Frequently Asked Questions
What is MANH’s GF Score™?
MANH has a GF Score™ of 93/100, indicating strong overall performance, particularly in valuation and growth metrics.
Is MANH overvalued or undervalued?
MANH is currently undervalued, trading at 12.9% below its GF Value™ of $243.08.
What is MANH’s P/E ratio?
MANH’s P/E (TTM) is 60.6x, which is 16% below its 5-year median of 72.1x, suggesting it is trading at a lower valuation compared to its historical averages.
This stock alert was generated using automated technology and GuruFocus financial data to provide readers with timely and accurate market reporting. This content was reviewed by GuruFocus editorial team prior to publication. Please send any questions or comments about this story to [email protected].