

New York City lends itself to superlatives. The largest local government in the US by a wide margin, the City spends more each year than the next ten largest city governments combined; its $121 billion dwarfs Los Angeles’s $19 billion, Chicago’s $10 billion, and Buffalo’s $1.7 billion. NYC’s Department of Education enrolls more students than LA and Chicago put together, while the size of the NYPD exceeds the combined numbers of the next four largest police departments. As a result, the City’s mayor has far more responsibility than any other local elected official in the country.
The origins of this unique arrangement lie not only in NYC’s giant population—now at 8.5 million—but also in the unusually consolidated state of its taxing authority and public services. Whereas other American cities tend to divide essential services between the city, the county, and the school board, in NYC the city government covers virtually all public services in the five boroughs: public schools, universities, and hospitals, policing, social welfare, children’s services and sanitation. This sprawling range of costly commitments is generally thought to be a liability for the incumbent mayor, who inevitably faces intense pressure to balance the budget. (Indeed, the last time one was elected to a subsequent public office was 1869.) At the same time, though, the mayor can use these vast fiscal resources and this high degree of institutional centralization to pursue ambitious policy agendas—potentially reshaping the City itself.
In January 2026, Zohran Mamdani will release his first budget proposal, the Preliminary Budget, which will strive to implement at least some of the radical policy pledges that animated his election campaign: free buses, universal childcare, a rent freeze for stabilized tenants, and new affordable housing. In February, he will go to Albany to advocate these measures during the state legislature’s budget negotiations. To push them through, he will have to overcome deep-seated anxieties about “overspending” which have long influenced the City’s budget process, and which will be compounded by new risks to federal funding, as Donald Trump threatens to wage financial warfare on the incoming administration. To measure Mamdani’s chances of success, we must take a closer look at the constraints and opportunities of the City’s unique public spending model.
The City’s largest spending obligations: teachers, police, and transfer payments
At first glance, NYC’s recent fiscal history seems like a relatively simple story: both revenues and expenditures have grown continually. On the revenue side, this is largely because of the upward trend in the City’s GDP, thanks in part to population growth. But while City expenditures have kept pace with revenues, they have lagged behind the growth of private incomes and spending—which means that as a share of the local economy, the public sector has actually been shrinking for years.
Where is this public money being allocated? In fiscal year 2025, which ended on June 30, New York City spent $120.8 billion. The three largest departments, responsible for 60 percent of the total, were education, police, and social services. In fourth place, at 6 percent, was debt servicing; hundreds of other departments comprise the remaining 33 percent, or $40 billion. Of the total budget, less than half ($56.9 billion, or 47 percent) is attributable to the direct employment of 302,000 workers, while the rest is spent on other services, including transfer payments, the operation of city property and physical assets, and debt service.
The New York City Department of Education (DOE) provides for all public preschool through 12th grade education in the City, running its public schools and universal prekindergarten program, funding charter schools, and providing support services. In the 2023–24 school year, which provides the most recent data available, the DOE enrolled more than 1 million children: 938,000 in K-12 and 95,000 three- and four-year-olds in prekindergarten. In doing so, the Department employed 133,500 full-time staff—nearly half (47 percent) of the City’s entire direct workforce. In fiscal year 2024, the Department spent $33 billion. After accounting for an additional $10 billion in pension and benefit costs, the City’s education system accounts for 36 percent of the City’s total budget—up from 26 percent in 2014.
Education has driven the City’s spending growth over the last decade. Despite popular frustrations with allegedly unfocused spending growth under Mayor Bill de Blasio, his administration in fact channeled new expenditures into public education. This funding allowed the City to add two grade levels to the public school system: 3-K and pre-kindergarten, which offer universal education to 3- and 4-year-olds, respectively. Even without new taxes, a City government committed to spending its existing revenues is able to do a lot: the steady revenue growth was enough to fund two-thirds of this expansion of the public sector, with the remainder coming from Albany.
New York City expenditures and workforce, fiscal year 2025
AgencySpending (billions)Percent of all spendingWorkersPercent of City workforceEducation$43.936%133,50047%Social Services$18.515%12,6004%Police$11.09%46,40016%Debt service$7.06%——All other$40.333%93,90033%
By contrast, the growth of the City’s two other major spending programs—social services and police—lagged total city spending over the same period. The Department of Social Services (DSS) is the City’s second largest agency by spending and fourth largest by employment. The Department’s two major units—the Human Resources Administration and Department of Homeless Services—administer a broad range of social assistance programs, including cash assistance, rental assistance, and shelters and other homeless services. DSS also manages enrollment in Medicaid and SNAP, though the benefits are not part of the City’s budget. Because DSS’s work primarily involves transfer payments, its spending runs far ahead of its workforce: the Department’s $18.5 budget accounted for 15 percent of City spending, while its 12,600 workers made up just 4 percent of the municipal workforce.
The Police Department is the City’s third largest department by spending and second largest by employment. In contrast to the DSS, the Police Department’s work is labor-intensive: its $11 billion budget is 9 percent of the City total while its 46,400 employees constitute 16 percent of the City workforce. Of these employees, about 33,000 are uniformed officers, while 13,200 are civilians. Finally, when it comes to debt service, the City made $7 billion in payments this fiscal year, supporting its $103 billion in outstanding debt.
Revenues: stability or stagnation?
New York City’s government spending is funded by a broader set of revenue sources than the typical U.S. city. Personal and business income is taxed for its resident people and corporations, in addition to the property and sales (ad valorem) tax that traditionally define the revenue base of municipal corporations. The largest single revenue source, the property tax, brought in $35 billion during the 2025 fiscal year. Crucially, this is the only revenue source collected under the exclusive discretion of the City, whereas changes to any other taxes must be approved by the State legislature. Together, these two authorities control local taxes that account for 72 percent of the City’s revenue. As for the remainder, New York State provides $20.9 million and Washington, D.C. $11 million: a combined 26 percent. State and federal funding consists of categorical grants tied to specific programs: state funding is predominantly school aid, while federal funding consists of a broader range of social assistance, housing, and education-related block grants.
New York City revenue, fiscal year 2025
Revenue sourceRevenue (billions)Percent of totalTotal revenue$120.8100% – City funds$87.172% – – Total tax$80.467% – – – Property$34.729% – – – Sales$11.29% – – – Income$16.013% – – – Business$13.611% – – – Other tax$4.94% – – Other city funds$6.76% – Federal$11.09% – State$20.917% – Other$1.71%
The City’s revenue system is geared toward stability rather than growth. The mix of taxes that fund the City generate predictable, stable growth, while failing to fully capture drivers of its economy. While this has allowed it to maintain services through economic oscillations, it has done so by keeping the level of services lower than what they otherwise would have been had revenues maintained pace with the growth of the local economy.
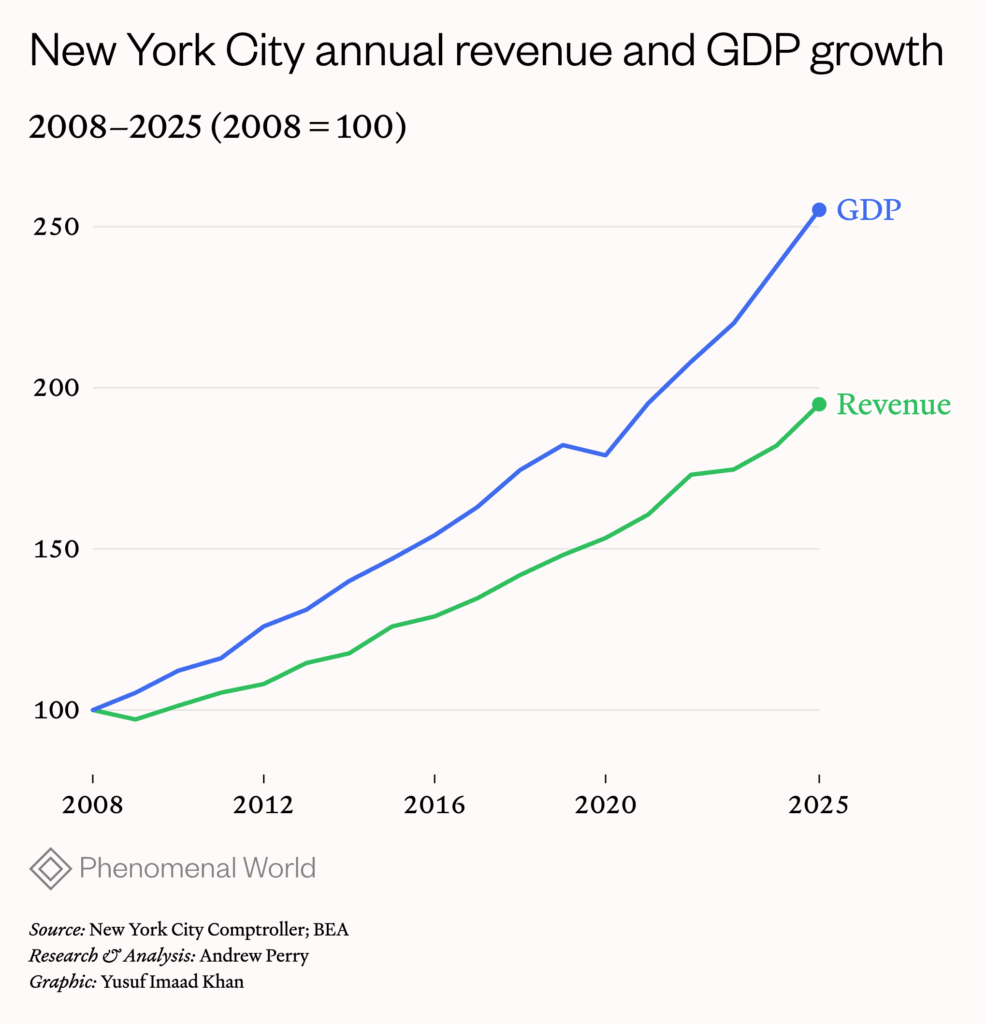
Between 2008 and 2025, the City’s GDP rose by 155 percent to $1.5 trillion. This economic growth has been faster than the City’s revenues, which grew from $60 to $120 billion. Had revenue growth kept pace with the growth of , it would be $24 billion larger than it was in fiscal year 2025, or $144.8 billion. Property tax is the only tax that has kept pace with GDP, whereas the City’s other taxes have lagged behind it. While a responsive tax system would have adapted to capture growth across various dimensions of economic activity, in NYC its control by the state has kept it relatively static amid a changing economy.
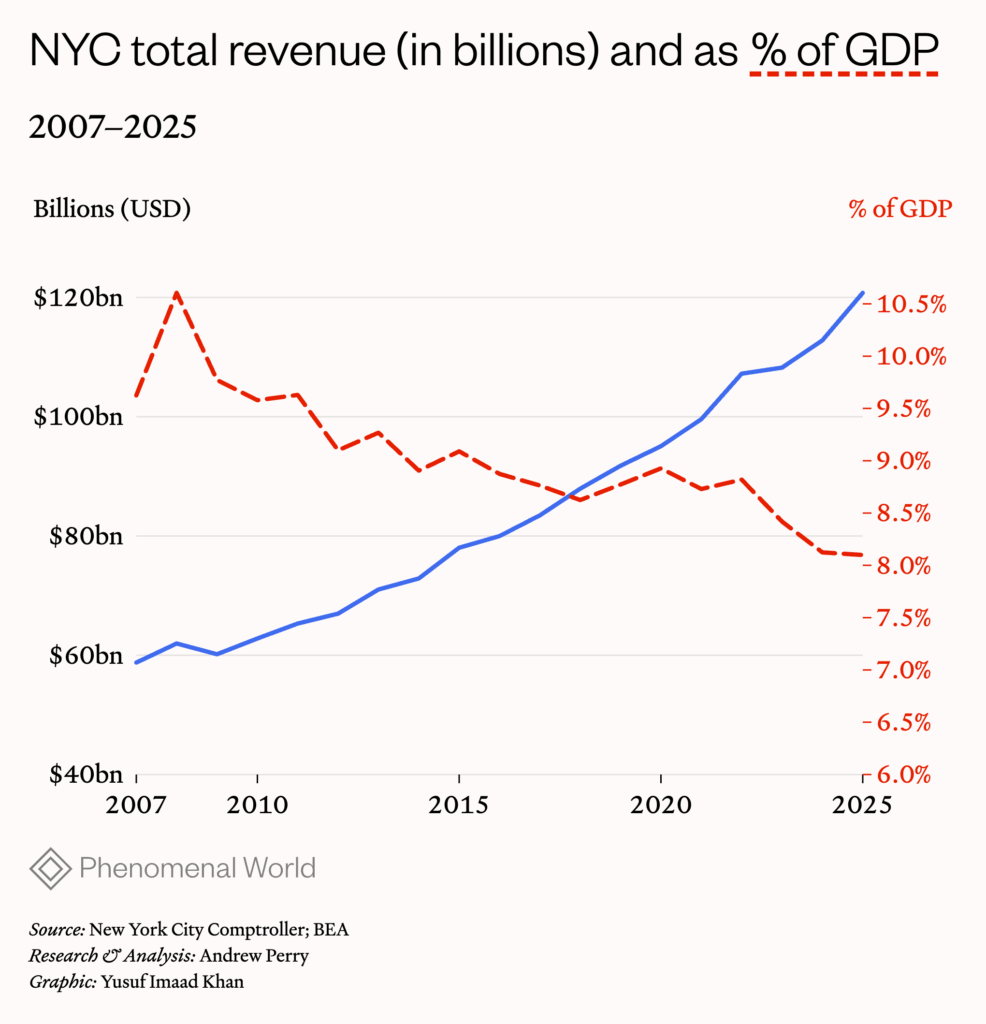
The relative stability of the City’s revenue system—allowing tax assessments below market values—thus prevents spending from growing, easing fiscal management when market values fall. But the logic of this approach is contractionary: between 2007 and 2025, the city’s economy grew at an average annual rate of 5.1 percent while city revenues grew at just 4.1 percent. Sales and business tax growth, 3.1 and 3.4 percent annually, dragged down the 5.6 percent growth in property tax revenue. The rise in property values, which have grown much faster than any other measure of the economy, is not fully reflected in tax appraisals.
“The City has traditionally assessed real property at less than market value,” explains the Official Statement of the City’s recent bond issues. The total value of New York City’s real-estate tax assessments has been just 20 percent of full market value for the last decade, and was even lower during the Bloomberg years. While the entirety of New York City’s taxable real estate is worth some $1.58 trillion today, just $309 billion of this is liable for paying city property taxes. The failure of revenue to keep pace with economic growth eroded the size of the public sector relative to the City’s economy, from 9.6 percent in 2007 to 8.1 percent in 2025.
Sluggish growth in tax revenues was the result of policy choices: the sales tax base has been steadily eroded as the tax only applies to goods, while nationally spending on services has grown far faster amid the digital transformation of the economy. The City’s business taxes, meanwhile, were reformed in 2015 to conform with corporate tax cuts passed by New York State, prompting a sharp near-term decrease in revenue.
The Budget Dance
The Mayor’s office also traditionally under-projects revenues, forecasting figures well below a reasonable anticipated intake. This is, in part, a longstanding fiscal management practice: projecting muted revenue growth hedges the budget against economic downturns, reducing the need to cut services if or when they do materialize. This in turn helps the Mayor to exercise control over the fifty-one-member City Council, setting priorities to which political negotiations must adjust. Yet the practice has broader political implications when it comes to the public’s understanding of the city’s fiscal situation. Its effect has been to obscure the real drivers of expenditure growth and stoke anxiety about the City’s ability to balance the books.
The City’s budget process consists of four projections each fiscal year concerning revenues and expenditures for the current and next two fiscal years. This continuous process begins in January with the Mayor’s Preliminary Budget, which is the basis for the Mayor and City Council to negotiate spending commitments for the coming fiscal year. These are revised in the May Executive Budget and codified in the Adopted Budget the City Council passes in June before the beginning of the fiscal year. In the interim, the November “Mod” (modified budget) updates revenue projections on the basis of the prior year’s actuals.This budget process always projects deficits—spending above revenues—in future years.
The process wherein these gaps are narrowed and, in negotiation with the City Council, new spending is allocated is occasionally referred to as “the budget dance.” It has become far more dramatic in recent years, and it will be decisive in understanding how the Mamdani administration will govern.
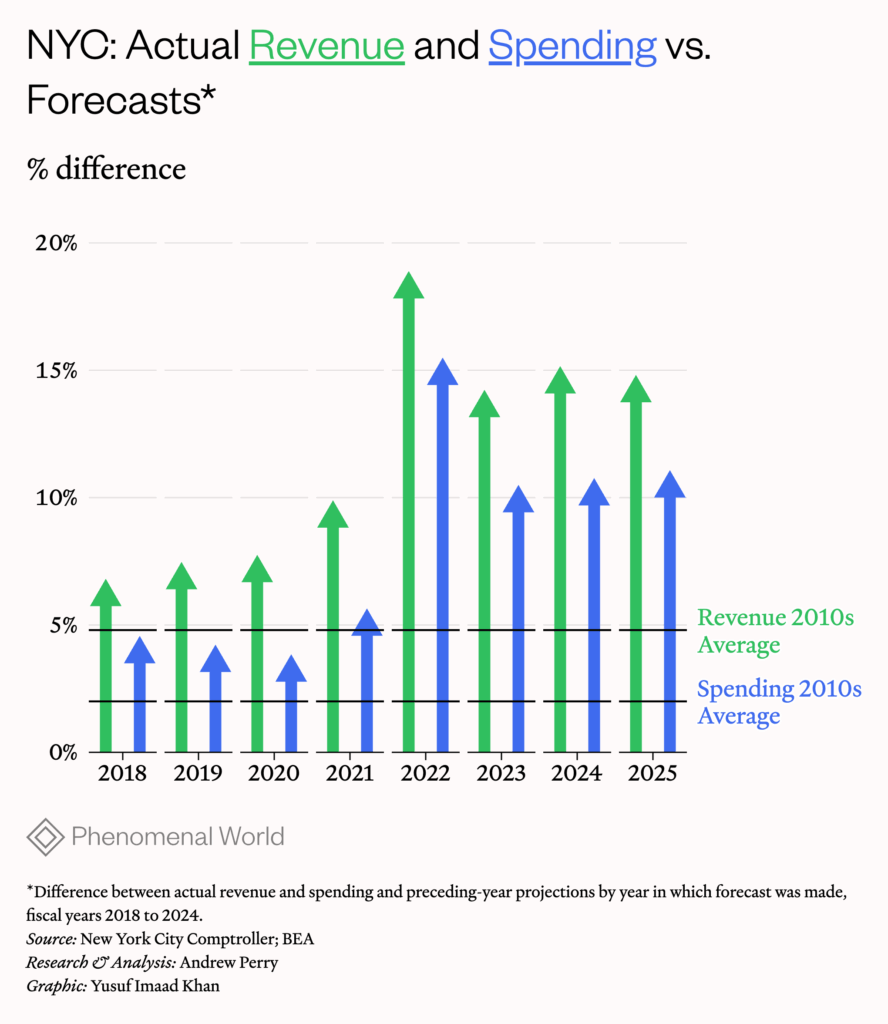
With striking consistency, Bill de Blasio’s two administrations projected third-year budget gaps that, on average, amounted to 6.1 percent of projected revenue between fiscal years 2013 and 2022. Actual revenue, however, exceeded forecasts by an average 6.4 percent over the same period, closing the forecast gaps. Spending forecasts were generally very close to mark—the City can and did forecast its spending commitments accurately.
During the Adams administration, however, the budget dance has become more dramatic and complex, obfuscating spending priorities and the City’s fiscal trajectory. Compared to the 2010s, actual revenues have consistently come in above revenue forecasts. This began, understandably, with the onset of the Covid pandemic before Adams was even elected. The fiscal year 2021 and 2022 executive budget proposals were published in April 2020 and 2021, respectively. Unprecedented federal aid and strong tax receipts spurred annual revenue growth of 5.5 percent and 8.2 percent, respectively. This exceeded prior-year expectations by 9 and 18 percent, respectively. But revenue forecasts under Adams have remained significantly more pessimistic than even cautious pre-Covid projections: the fiscal year 2023 through 2025 executive budgets underestimated revenue in the ensuing year by an average of 14 percent—an error rate three times higher than the pre-Covid average. There is a broad recognition that the City has made excessive pessimism a matter of policy.
As a result of unduly pessimistic revenue forecasts, the City’s spending plans have also become increasingly unmoored from reality. This has come in two forms, each with their own political utility: underbudgeting and overbudgeting spending. Their combined effect has been far more confounding than merely austerity. Budgeting spending too low creates political fictions as the fiscal year progresses. Because state law requires the current fiscal year’s Adopted Budget to balance, higher-than-expected revenue always pushes the City budgets into a de facto surplus. As this surplus is spent, the Mayor and politicos across the country are able to paint a picture of overspending as a justification for cutting services—the politics of the dance.
Disposal of the surplus allows the Mayor to shape perceptions. In fiscal years 2021 and 2022, for example, higher-than-expected revenue pushed spending higher. Most of this spending accrued to the Department of Education (DOE), which faced the costs of the implementing of remote learning. While much of this spending became tied to recurring costs throughout the pandemic, the Adams administration did not “baseline” these new costs into its spending forecasts—the DOE could be accused of persistently spending above budget. Similarly, in social services the City expanded eligibility and benefit levels for CityFHEPS, which provides rental vouchers for New Yorkers facing homelessness. Cash assistance caseloads also rose during the pandemic and have remained elevated. The City has not appropriately budgeted for these social-services costs, which exceeded projections by $2.2 billion in fiscal year 2025. Another practice with a similar effect is called the “surplus roll,” in which the City dispenses its surplus by prepaying subsequent year expenses. In fiscal year 2025, for instance, the City accrued a $3.8 billion surplus. It booked this as 2025 spending in the form of prepaying spending liabilities in fiscal year 2026. Total spending for fiscal year 2025 came in above budget by $3.8 billion, but this prepayment was entirely responsible for the image of above-expectations spending.
Reestimates of New York City’s fiscal year 2025 spending and revenue between June 2024 and June 2025 (figures in millions)
Unspent budgeted fundsAsylum seekers$1,900 Personnel costs$1.4In-year reserves$1,450Debt service$455All other$930Spending above budgetSocial services$2,200Education$670Police & Fire$900All other$2,400Net effect on total spending$87 over budgetRevenue reestimates$3,900 above forecastYear-end surplus$3,800
Budgeting spending too high—in effect, masking the future surpluses—allows for similar claims at the beginning, rather than the end, of each fiscal year. In fiscal year 2024, for example, the City began dramatically increasing its expected spending on asylum seekers amid an influx of migrants. These projected costs proved to be exaggerated: the City’s fiscal year 2025 costs came $1.9 billion below expectations—55 percent lower than the $3.4 billion anticipated at the beginning of the fiscal year.
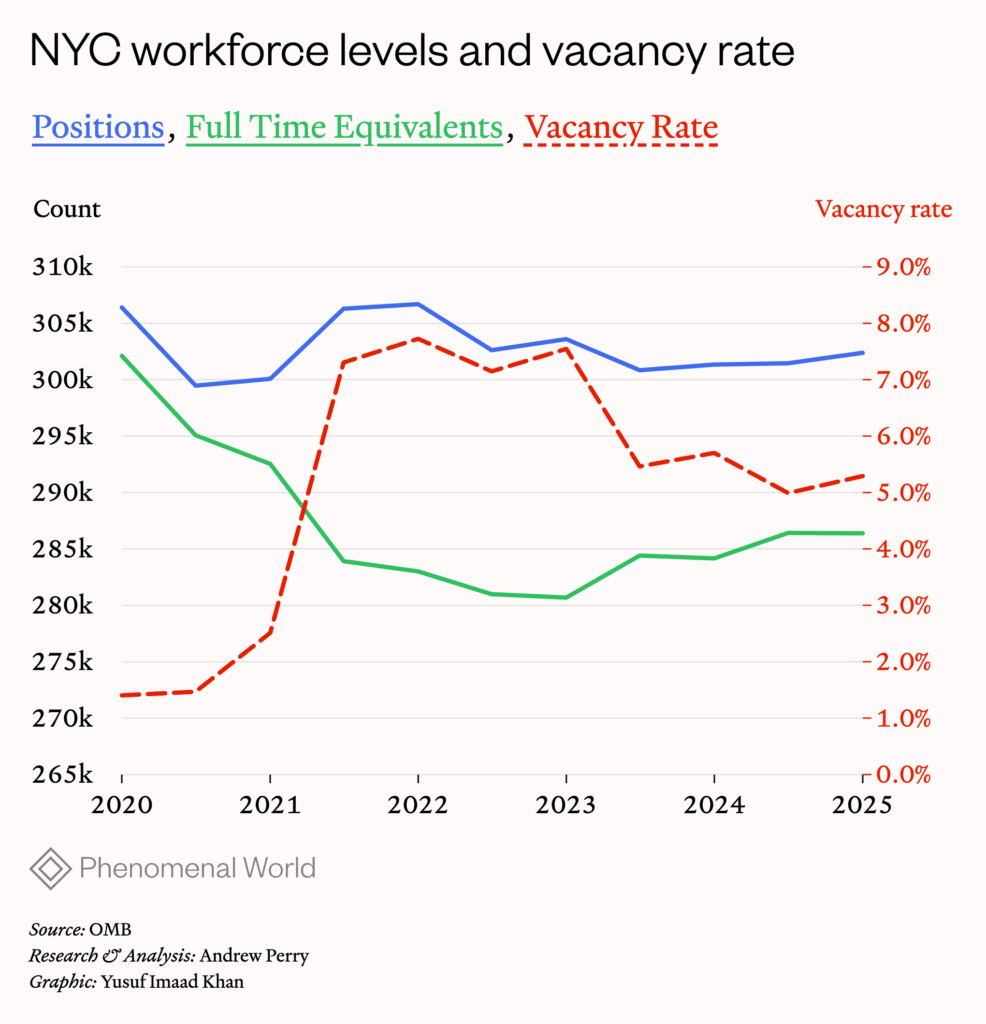
High vacancies across the public workforce since the beginning of the Covid pandemic have had a similar effect. The number of public workers fell early in the pandemic, from 302,000 in June 2020 to 281,000 in April 2023. The size of the workforce has recovered modestly, to about 286,000 by June 2025. The vacancy rate remains above 5 percent. The largest number of vacancies were at the largest agencies: Education and Police with 4,600 and 3,000 vacancies, respectively; however, their vacancy rates were 3 and 6 percent, not much different from the City as a whole. The highest vacancy rates among major agencies were the departments of Probation and Correction, with 24 and 16 percent, respectively. Administrative Services (16 percent vacancy), Housing Preservation and Development (14 percent), Finance (14 percent) also face very high vacancy, jeopardizing basic city functioning.
Through all this the City did not reduce its budgeted staff. The lack of spending on unfilled but budgeted positions, together with lower-than-anticipated pension contributions, generated substantial underspending in recent years, including $1.4 billion in fiscal year 2025.
If disposal of the surplus allows the Mayor to claim certain foreseeable obligations are in fact evidence of irresponsibility, so too does it allow the Mayor to set political priorities. Overtime pay for the Police and Fire Departments in NYC is not new, for example, though it has grown dramatically in recent years. While the City has long underbudgeted overtime wages for uniformed workers, in fiscal year 2025 the $900 million margin was about twice the pre-Covid norm.
Fiscal crises past and future
In recent years there have been rolling anxieties about the City’s fiscal condition. Between the onset of the Covid pandemic and Donald Trump’s re-election as president, there was much talk of so-called “fiscal cliffs:” the inevitable spending cuts needed when the City exhausted funding for recurring but unbudgeted costs associated with expanding social services and education. In the end, though, this problem failed to materialize, because revenue exceeded projections by greater margins than in the past—underpinned by continuing economic growth.
Now, just as the City appears set for a soft fiscal landing, there is a new source of panic: the withdrawal of federal funding by the Trump administration. Such fears proved unfounded under Trump I: federal funding held steady in the early days before surging in response to Covid. Trump II, however, seems far more determined to revoke funding from adversarial local governments. Its defining piece of legislation to date, the One Big Beautiful Bill Act, partly offset $4.5 trillion in cumulative federal revenues over ten years with $1.2 trillion in spending cuts over the same period. These are concentrated in Medicaid and food stamps, which will fall hard on state budgets. New York State faces annual costs of $15 billion once the bill’s provisions take full effect. By and large, such costs do not filter down to the local level: New York City stands to absorb just $100 million in cuts to food stamp funding. Nevertheless, a State government facing massive shortfalls may be less forthcoming with aid to local governments.
The annual federal budget poses a greater risk to the City. For the current federal fiscal year, the White House initially proposed cutting aid to local education, housing vouchers, and other block grants that collectively amount to about $1.8 billion annually. These cuts were not included in the continuing resolution that ended the recent shutdown, which holds federal funding at constant levels. But as the Trump administration’s signature legislation made clear, these areas of federal spending remain at risk in future federal budget negotiations. White House discretion over disaster relief funding is a further risk: the federal funding that has followed past disasters and recessions is far from assured for the next three years.
Mamdani will have to fight to maintain his expansionary program in this context of federal and state retrenchment. His free buses pledge is expected to cost roughly $700 million per year, while the construction of two hundred thousand housing units through borrowing could raise annual debt service costs by $3 billion. His single most expensive pledge, universal childcare, may cost as much as $6 billion. Yet even if the City budget faces headwinds from Washington, its vast and resilient economic base gives Mamdani the ability to weather them. Here, tax reform is of paramount importance. If the City’s revenue had kept pace with its economy over the last fifteen years, it would be able to fund universal childcare four times over. Bringing these two metrics into closer alignment is thus a clear priority. Property taxes can be raised by the City itself, while other revenue will require State legislation. Policymakers at both levels must not let misbudgeting create the false impression that New York City’s fiscal challenges are insurmountable. The economic resources exist to respond to looming threats and to deliver the services demanded by the electorate. It is not a problem of accounting, but of political will.