

We evaluated changes in ambient air quality in the New York metropolitan area by analyzing PM2.5 concentrations across a three-tiered monitor sample: 13 monitors in the broader New York City Core-Based Statistical Area (CBSA), which includes suburban counties in upstate New York and New Jersey; 23 monitors within the five boroughs of New York City; and 6 monitors within the CRZ.
Overall effect
In Figs. 1 and 2, we show the average treatment effect on the treated monitors as well as policy effects on air quality per monitors during the congestion policy, repeated for each model, to show how estimates change from lightweight to the most robust model specifications. We find that the congestion pricing policy substantially reduced ambient air pollution, particularly within the toll zone. Average daily maximum PM2.5 concentrations within the CRZ decreased by 3.05 μg/m3 (SE = 0.022). For context, background levels in the New York City metropolitan area during the study period averaged ~8–9 μg/m3, meaning the observed reduction represents ~22% decline from the counterfactual mean of 13.8 μg/m3 that would have occurred in the absence of the policy. Figure 1 displays the estimated average treatment effects from these models, showing statistically significant and sizable reductions in PM2.5 levels following the introduction of congestion pricing. Effects were also observed outside Manhattan. Across the five boroughs of New York City, average concentrations declined by 1.07 μg/m3 (SE = 0.006), while the broader CBSA region saw a more modest but statistically significant decrease of 0.70 μg/m3 (SE = 0.004). These reductions suggest that the policy’s effects radiated beyond the tolled area, likely due to spillover changes in traffic volume and behavior.
Fig. 1: Policy effects on NYC air quality.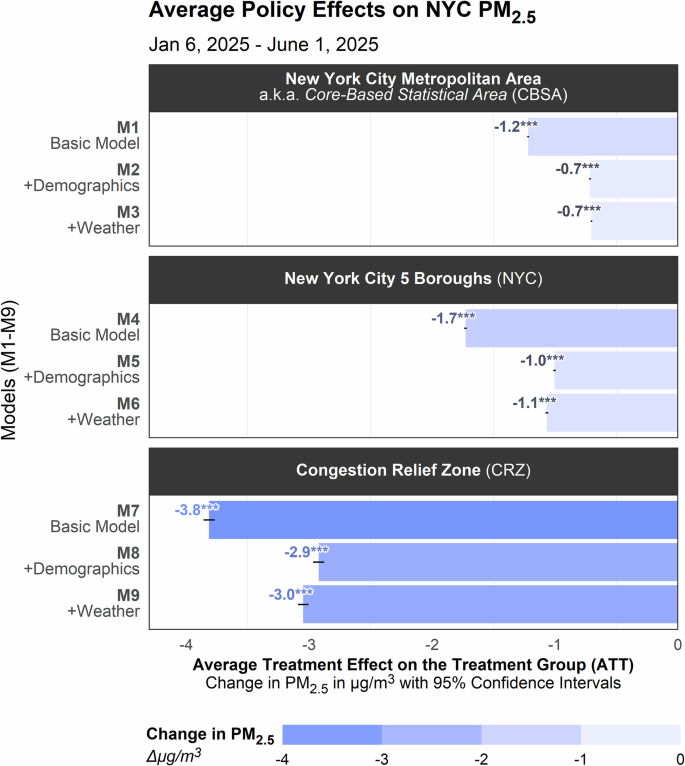
Statistical significance: ***p < 0.001, **p < 0.01, *p < 0.05, p < 0.10. Bars and text show average treatment effects on the treated (ATT) with 95% confidence intervals, estimated by models each with successively more controls. Statistical model tables for Models M1-M9 are shown in Table 1.
Fig. 2: Policy Effects on NYC PM2.5 by Monitor.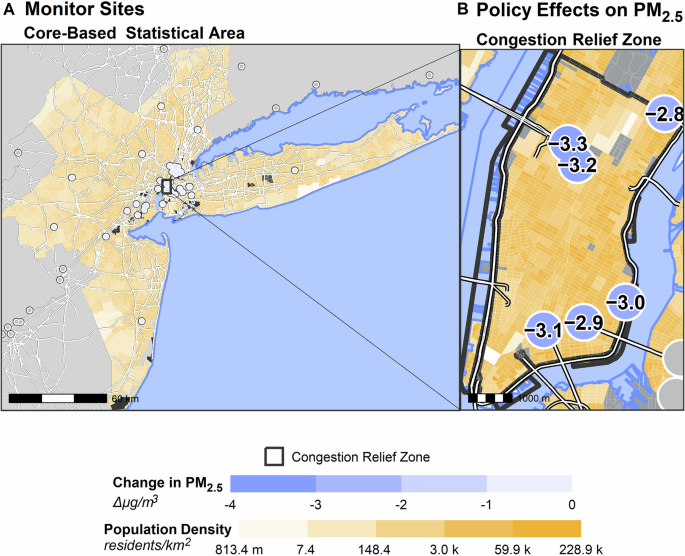
A shows air-quality monitor locations (points) in the NYC Metropolitan Core-Based Statistical Area (CBSA). Points are shaded from white to blue by the size of the estimated decrease in PM2.5 during the Congestion Pricing policy from 6 January 2025 to 1 June 2025. Monitors outside the CBSA are shaded gray. B narrows into the extent of the Congestion Relief Zone (CRZ) in Manhattan. Estimates reflect monitor average treatment effects for fully specified models for the CBSA in A (Model 3) and for the CRZ in B (Model 9). Roads are shown in white. Block groups are shaded by population density in yellow, where gray indicates unavailable data. Mapped in R with the ggplot2 and sf packages30,31.
Robustness across zones
The magnitude of pollution reductions varied by geographic zone but remained directionally consistent, indicating overall decreases across regions, though not uniformly across all locations or road types. Within all three regions—the CRZ, the five boroughs, and the CBSA—models showed statistically significant decreases in PM2.5 levels across all specifications, with results robust to additional environmental and socio-demographic controls (for details, see Models 1–9 in Table 1). This consistent pattern across spatial zones and model types strengthens confidence in the policy’s effectiveness in improving air quality, particularly in dense urban centers.
Table 1 Linear models of air pollution in the New York City metropolitan areaDescriptive evidence
Figure 3 illustrates the annual distributions of the wind direction, speed, and net PM2.5 concentration in NYC, before and after the implementation of congestion pricing. Figure 3A presents wind rose plots for the entire year of 2024 and the first half of 2025. In both years, the prevailing winds came predominantly from the west and northwest directions, consistent with typical meteorological patterns in the region. The mean windspeed increased from 7.6 m/s in 2024 to 9.3 m/s in early 2025, while the proportion of calm wind conditions decreased from 16.4% to 12.3%. These changes suggest a better atmospheric dispersion capacity in 2025, which may influence the transport and dilution of urban air pollutants.
Fig. 3: Annual wind direction and speed patterns and net PM2.5 concentration trends in NYC pre- and post-congestion pricing (2024–2025).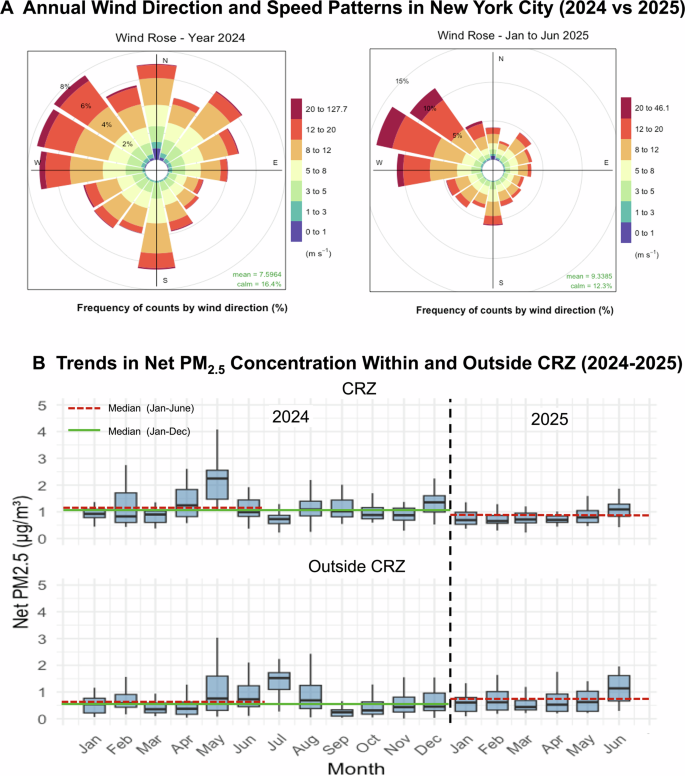
A Wind rose depicts direction and speed distributions for 2024 and Jan–Jun 2025. B Boxplots show monthly net PM2.5 inside vs. outside the CRZ, with median lines for Jan–Jun and Jan–Dec periods.
To isolate local emissions from regional background pollution, we selected four upwind background monitoring sites. These stations were chosen based on two criteria: (1) their persistent positioning upwind of the CRZ under dominant west and northwest wind conditions, as shown in seasonal wind rose patterns (Fig. 3A); and (2) their minimal influence from proximate traffic or industrial emission sources. consistent representation of transported background PM2.5 levels, which were subtracted from city-wide measurements to calculate net PM2.5, thus isolating the local-scale impact of congestion pricing on ambient air quality.
Figure 3B shows monthly net PM2.5 concentrations within and outside the CRZ from January 2024 to June 2025. In 2024, concentrations exhibited clear seasonal variation, peaking in spring and early summer. Comparing median values for January through June, PM2.5 declined within the CRZ from 1.143 μg/m3 in 2024 to 0.865 μg/m3 in 2025, but increased outside the CRZ from 0.542 μg/m3 to 0.727 μg/m3. A similar pattern was observed when comparing the full year of 2024 with the first half of 2025: within the CRZ, medians fell from 1.053 μg/m3 to 0.542 μg/m3, whereas outside the CRZ, they rose from 0.523 μg/m3 to 0.727 μg/m3. These temporal contrasts suggest a possible association between reduced traffic activity and improved air quality within the central urban area.
Figure 4 characterizes the temporal evolution and spatial heterogeneity of net PM2.5 concentrations in NYC before and after the implementation of the congestion pricing policy. Figure 4A, B summarizes monthly trends in policy-hour (05:00–21:00) net PM2.5 levels, comparing monitoring stations located within and outside the CRZ. Following policy initiation in January 2025, median net PM2.5 concentrations consistently declined within the CRZ across most months. In contrast, outside the CRZ, net PM2.5 concentrations exhibited a mixed pattern: initial declines were followed by increases in later months, suggesting possible redistribution or displacement of emissions linked to traffic rerouting. These temporal contrasts are further illustrated by the monthly percent changes, which show pronounced reductions within the CRZ during the early months of 2025, reaching up to a 66% decrease in May, while outside the CRZ, changes were more variable, including increases exceeding 90% in April.
Fig. 4: Temporal and spatial reductions in net PM2.5 during congestion pricing hours across NYC.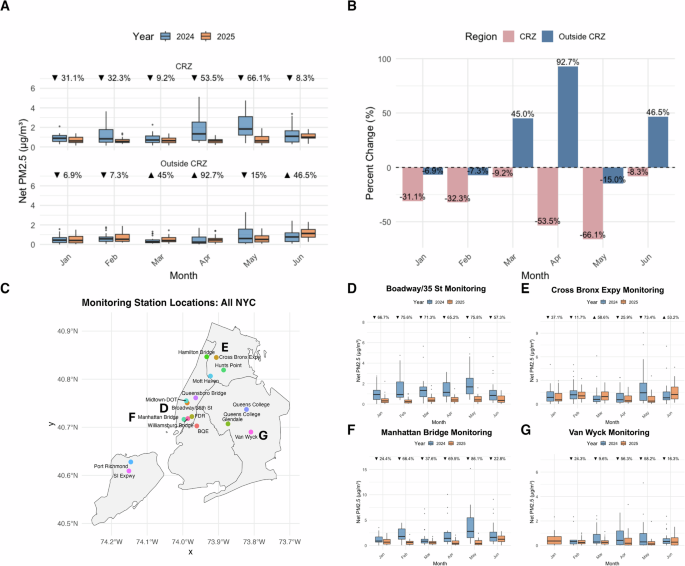
A, B Boxplots and histograms of monthly net PM2.5 inside vs. outside the CRZ for 2024 and 2025, showing percent changes relative to the baseline. C Locations of hourly PM2.5 monitoring stations in NYC. D–G Spatiotemporal distributions at key monitoring stations, highlighting variability across locations and months. Specifically, D Bowery (within CRZ), E Cross Bronx (outside CRZ), F Manhattan Bridge (within CRZ), and G Van Wyck (outside CRZ).
Figure 4C–G further examines the spatial and temporal distribution of net PM2.5 concentrations during policy hours across selected monitoring stations, highlighting regional contrasts inside and outside the CRZ. Stations located within the CRZ—D (Broadway) and F (Manhattan Bridge)—exhibited clear and consistent declines in PM2.5 following policy implementation, with minor fluctuations during the early transition period (February–March) and pronounced reductions by June 2025. In contrast, E (Cross Bronx Station), situated outside the CRZ in the Bronx, showed a different temporal profile: PM2.5 levels did not decline immediately and even rose slightly in March, possibly reflecting increased traffic rerouting around the CRZ. A gradual decline emerged from April onward, suggesting a delayed response as traffic patterns adjusted. G (Van Wyck Station), located further from both the CRZ boundary and primary traffic detour corridors, displayed relatively stable PM2.5 levels, with little year-to-year variation. This suggests that the policy’s influence diminished with increasing distance from the CRZ and that Van Wyck Station was less affected by traffic redistribution.
Together, these observations underscore the heterogeneous impacts of congestion pricing: core CRZ areas experienced immediate and substantial air-quality improvements, while peripheral neighborhoods showed either delayed responses or negligible changes, depending on proximity to the CRZ and exposure to traffic spillover.
Change in effects over time
Excitingly, these effects were not static over time, but grew within the CRZ over time. Figure 5A shows average weekly treatment effects for each geographic zone, where bands show the range of effects most likely per week (95% confidence intervals). These dynamic weekly effects are shown for the CRZ (Model 9), NYC 5 Boroughs (Model 6), and the broader NYC Metropolitan CBSA (Model 3). During the first week of implementation, we estimate an average PM2.5 reduction of 0.8 μg/m3 in the CRZ. These effects steadily increased, reaching an average weekly reduction of 4.9 μg/m3 by Week 20. This cumulative trend suggests persistent and compounding air-quality benefits within the tolled zone.
Fig. 5: Air-quality benefits increase in the congestion relief zone over time.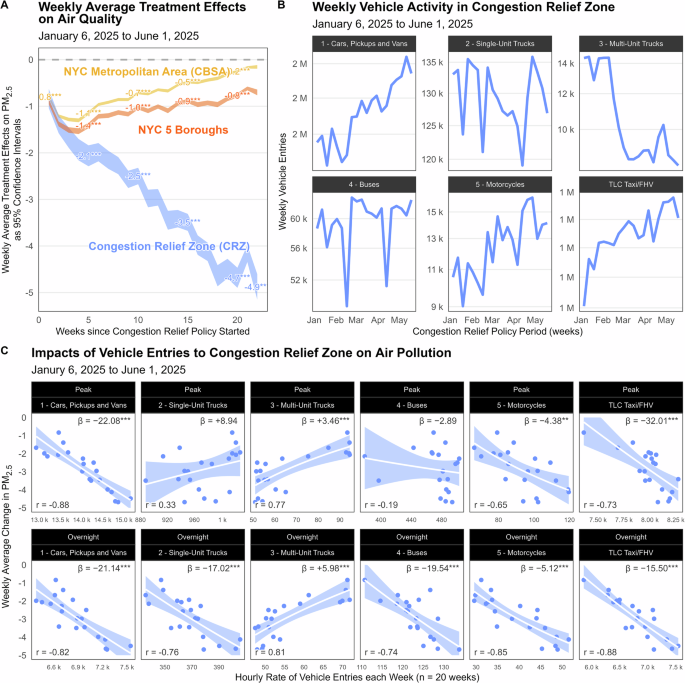
A Bands show weekly average treatment effects within the CRZ (Model 9), NYC 5 Boroughs (Model 6), and NYC Metropolitan Area CBSA (Model 3), with 95% confidence intervals. B Lines depict weekly vehicle activity inside the CRZ, highlighting the drop in Multi-Unit Truck entries. C Trend lines relate changes in air pollution to hourly vehicle entry rates per week, by vehicle class and time period (Peak = 5 AM–10 PM; Overnight = 11 PM–4 AM).
In contrast, we find that air-quality improvements in outer zones (the NYC boroughs and CBSA) were more modest and showed decreases over time. Average treatment effects in these areas were significant in the first weeks of implementation, but the rate of improvement slowed as time progressed. These diminishing returns likely reflect adaptive transportation behavior, describing the thousands of NYC metro area residents and firms who are adjusting their behavior to avoid driving through the tolling zone by rerouting trucks, mode switching, or rescheduling trips. These concurrent changes in vehicle behavior are likely responsible for the change in marginal environmental benefits outside the CRZ. However, it is worth noting that even these further-out areas still produce statistically significantly less air pollution than before congestion pricing’s implementation.
To better understand the link between vehicle activity and air-quality changes, Fig. 5B shows weekly traffic entry trends within the CRZ, with a notable early drop in multi-unit truck entries. Between January and June 2025, vehicle entries into the CRZ decreased substantially: heavy-duty truck entries fell by approximately 18%, car entries by about 9%, and overall vehicle entries by around 11%. These reductions in traffic activity are of a scale that could plausibly account for the observed decreases in peak PM2.5 levels, especially given the disproportionate contribution of heavy-duty vehicles to urban air pollution. The differing responses between trucks and passenger vehicles likely reflect their distinct decision-making dynamics, where individual drivers adjust gradually through small, trip-level changes, whereas trucking companies plan ahead to minimize operating costs, leading to larger, more coordinated adjustments such as rerouting or reducing cross-cordon entries. Figure 5C plots correlations between PM2.5 changes and hourly vehicle entry volumes, disaggregated by vehicle type and time period. These results reinforce that reductions in heavy-duty vehicle traffic are closely associated with air-quality improvements, especially during peak daytime hours.
Taken together, these results suggest that congestion pricing produces increasingly strong environmental returns within the tolled zone while producing time-limited co-benefits in adjacent areas. Future analyses could evaluate whether longer-term shifts in commuting patterns sustain or reshape these trends.
NYC congestion pricing cut PM2.5 by 22%
Our analysis provides the first quasi-experimental evidence that New York City’s cordon-based congestion pricing policy produced rapid and substantial air-quality improvements. Within just six months of implementation, daily maximum PM2.5 in the CRZ declined by 22%, controlling for background concentrations, meteorology, and neighborhood demographics. This magnitude exceeds prior evidence from Stockholm, where congestion pricing reduced air pollution by 5–15% between 2006 and 20105, and London’s Ultra Low Emission Zone, which achieved about a 7% decline in PM2.5 citywide between 2019 and 202210. The comparatively larger effects in New York likely reflect both the intensity of travel demand and the greater modal flexibility of its commuters, supported by an extensive transit system and multi-modal system.
Importantly, the results show that air-quality improvements were not confined to the tolled zone. We find no evidence of emissions displacement to neighboring areas; instead, the analysis reveals net reductions across the broader metropolitan region. While improvements in the five boroughs and the broader CBSA were smaller (1.07 and 0.70 μg/m3, respectively), these reductions remain statistically significant across specifications. This spatial gradient reflects how pricing reshapes travel behavior beyond the tolled zone through rerouting, mode switching, and trip rescheduling, while producing both direct and indirect environmental benefits. These findings suggest that congestion pricing acts as a system-wide behavioral intervention rather than a geographically bounded one.
Behavioral adaptation drives compounding environmental gains
Temporal dynamics reinforce this interpretation. As shown in Fig. 5A, weekly treatment effects within the CRZ intensified nearly fivefold by Week 20 (rising from ~0.8 μg/m3 in Week 1 to ~4.9 μg/m3 by Week 20), while the corresponding curves for the five boroughs and the CBSA are flatter and begin to plateau earlier, indicating more modest but still negative effects outside the cordon. Read together with the spatial pattern in Fig. 2A, where monitors across the CBSA are shaded light blue, these trends indicate net reductions rather than displacement: early gains are concentrated in the core, and smaller improvements diffuse outward as travelers adapt. This pattern implies that early post-implementation evaluations may understate long-term air-quality gains, as behavioral adjustments (e.g., trip consolidation, increased transit use, and peak-hour avoidance) accumulate gradually rather than instantaneously. Conversely, smaller or slower improvements in outer zones may reflect the limits of mode substitution once key travel patterns stabilize.
Long-term success demands reinvestment, freight integration, and adaptive management
Three key takeaways emerge. First, reinvestment is critical. Allocating a portion of toll revenues to support outer-borough transit, subsidized fares, and active-mobility infrastructure would extend benefits beyond the CRZ and ensure citywide accessibility11,12. Second, freight management deserves explicit integration. Our results confirm that heavy-duty truck activity remains a dominant driver of localized air-quality variation. Differentiated tolls, incentives for zero-emission freight vehicles, and coordinated delivery scheduling could amplify environmental benefits while reducing concentrated burdens in communities already overexposed to truck emissions13,14. Third, adaptive management is essential. As weekly treatment effects grew over time, continuous air-quality monitoring, dynamic rate adjustments, and iterative policy design will be vital to sustaining gains and preventing rebound effects15,16. These lessons align with international evidence that successful congestion pricing programs rely on transparency, reinvestment, and continuous adaptation.
New York’s experience reinforces global evidence on congestion pricing
From a broader perspective, this study contributes new empirical evidence to the global literature on pricing-based environmental policy. The results demonstrate that congestion pricing, when implemented in a high-density, transit-oriented U.S. city, can achieve emission reductions comparable to or exceeding those of long-established European cases, such as Milan’s Area C program (17% decline in PM10) and London’s congestion charge (5–10% reduction in PM10)17,18. They also underscore that environmental and mobility benefits can coexist, positioning congestion pricing as a rare intervention that advances multiple urban sustainability goals simultaneously: reducing pollution, improving traffic efficiency, and generating revenue for infrastructure modernization19.
Finally, while these findings are encouraging, several caveats merit discussion. The analysis covers only the first six months of implementation, limiting inferences about longer-term outcomes or potential rebound effects. Moreover, the absence of unaffected counterfactual monitors required reliance on predictive modeling rather than traditional difference-in-differences (DiD) methods20. Future research should assess whether the observed PM2.5 reductions persist over time, how benefits vary across demographic and spatial contexts, and how complementary measures—such as fleet electrification, transit expansion, and active-mobility investment—can amplify these gains. Extending this framework to other pollutants, including NOx and O3, will also help clarify the full atmospheric and health implications of congestion pricing21,22,23,24.