

If you’re wondering what to do about Manhattan Associates stock at this crossroads, you’re in good company. The once high-flying supply chain software specialist has caught the attention of investors trying to make sense of recent swings. Despite an impressive 54.3% three-year return and a remarkable 101.9% gain over five years, the stock is now catching its breath. Over the past month, shares have slipped by 8.4%, pushing year-to-date performance down to -26.8%, with a full-year drop to -34.0%. It’s a stark contrast to the robust growth trajectory that had become almost routine, and many are weighing whether this pullback is a fleeting blip or a sign to reconsider their positions.
Some of this pressure appears linked to the wider recalibration in tech and software valuations seen across the market, rather than any specific shock tied to Manhattan Associates. Investors seem to be balancing the company’s long-term momentum with a more cautious view of the sector’s near-term risks. If you’re evaluating your next move, knowing where Manhattan stands on valuation is essential. That’s where things get interesting. According to our scoring system, the company is currently undervalued in just 1 out of 6 key valuation checks, resulting in a modest score of 1.
But numbers only tell part of the story. Up next, we’ll break down each valuation method and reveal how Manhattan Associates stacks up. And stick around, because by the end, we’ll talk about a smarter way to think about valuation, especially in markets like this.
Manhattan Associates scores just 1/6 on our valuation checks. See what other red flags we found in the full valuation breakdown.
Approach 1: Manhattan Associates Discounted Cash Flow (DCF) Analysis
A Discounted Cash Flow (DCF) model estimates a company’s intrinsic value by extrapolating its future cash flow projections and discounting them back to today’s value. This method aims to capture both current earnings power and expectations for future growth in cash generation.
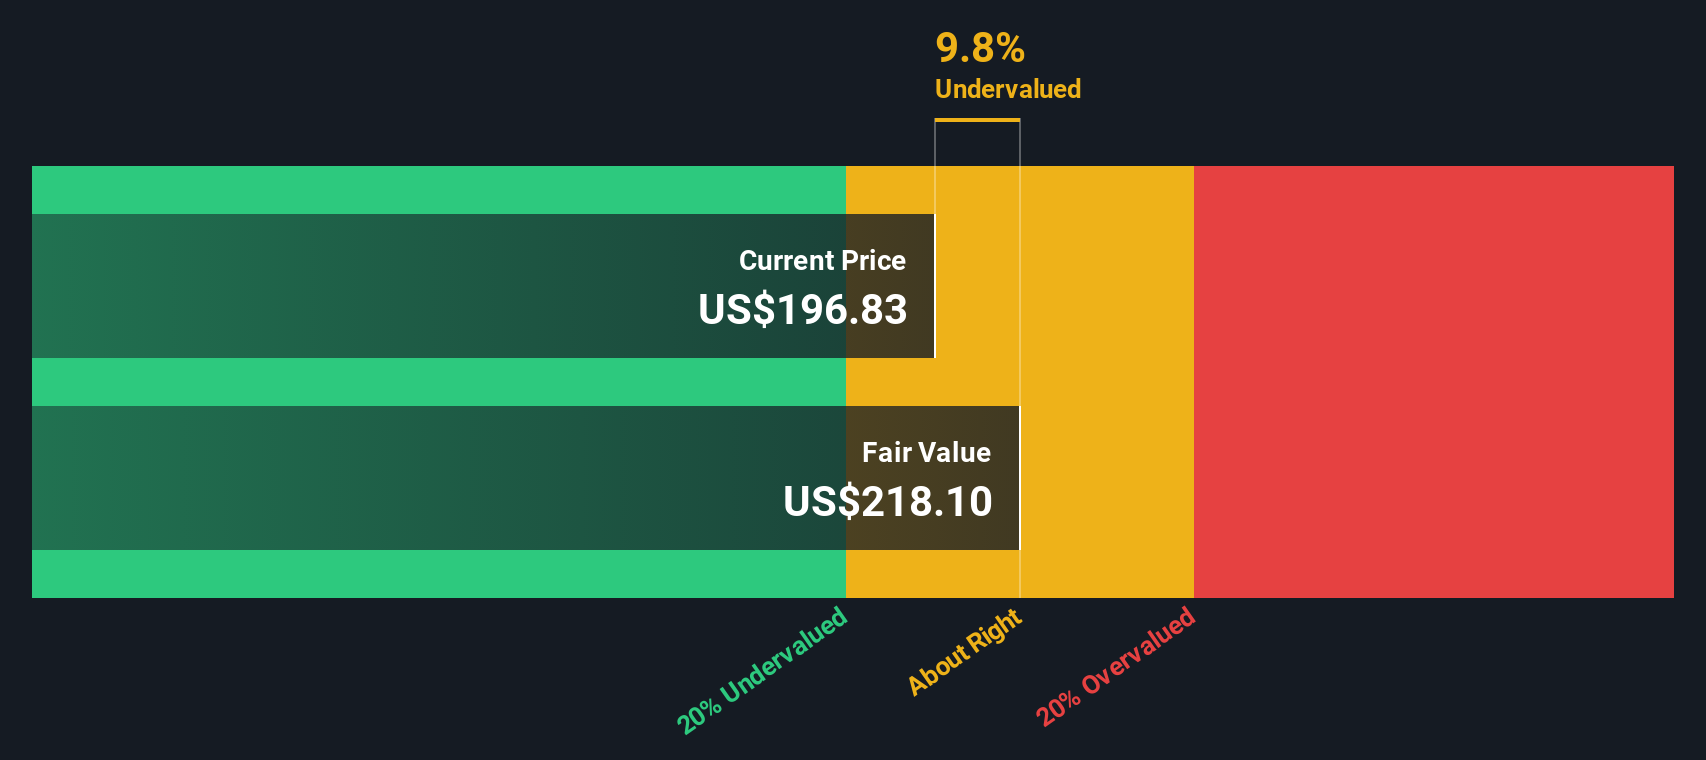
For Manhattan Associates, the DCF assessment is based on the company’s Free Cash Flow, which stood at $308.1 million over the last twelve months. Analysts forecast continued expansion through 2029, with Free Cash Flow projected to reach $665.9 million five years from now. In the longer term, estimates are extrapolated up to 2035 by Simply Wall St, reflecting a moderate pace of growth as the business matures.
These cash flows are then discounted to reflect their value in today’s dollars, producing an estimated fair value of $218.10 per share using a 2 Stage Free Cash Flow to Equity model. Based on this, the DCF suggests the stock is about 9.8% undervalued compared to the current share price.
While not a dramatic margin, the DCF signals that Manhattan Associates is trading roughly in line with its intrinsic value, offering neither a steep bargain nor a worrying premium.
Result: ABOUT RIGHT
 MANH Discounted Cash Flow as at Oct 2025
Simply Wall St performs a valuation analysis on every stock in the world every day (check out Manhattan Associates’s valuation analysis). We show the entire calculation in full. You can track the result in your watchlist or portfolio and be alerted when this changes.
Approach 2: Manhattan Associates Price vs Earnings
The Price-to-Earnings (PE) ratio is the go-to metric for valuing profitable companies like Manhattan Associates because it relates a company’s stock price to its actual earnings power. This makes it especially useful for gauging how much investors are willing to pay for each dollar of current profit. Of course, what counts as a “normal” or “fair” PE depends not just on the sector, but also on the company’s expected growth rate and any risks that might impact future profits. Higher expected growth or lower risk usually justifies a higher PE. Slower growth or more uncertainty typically commands a lower multiple.
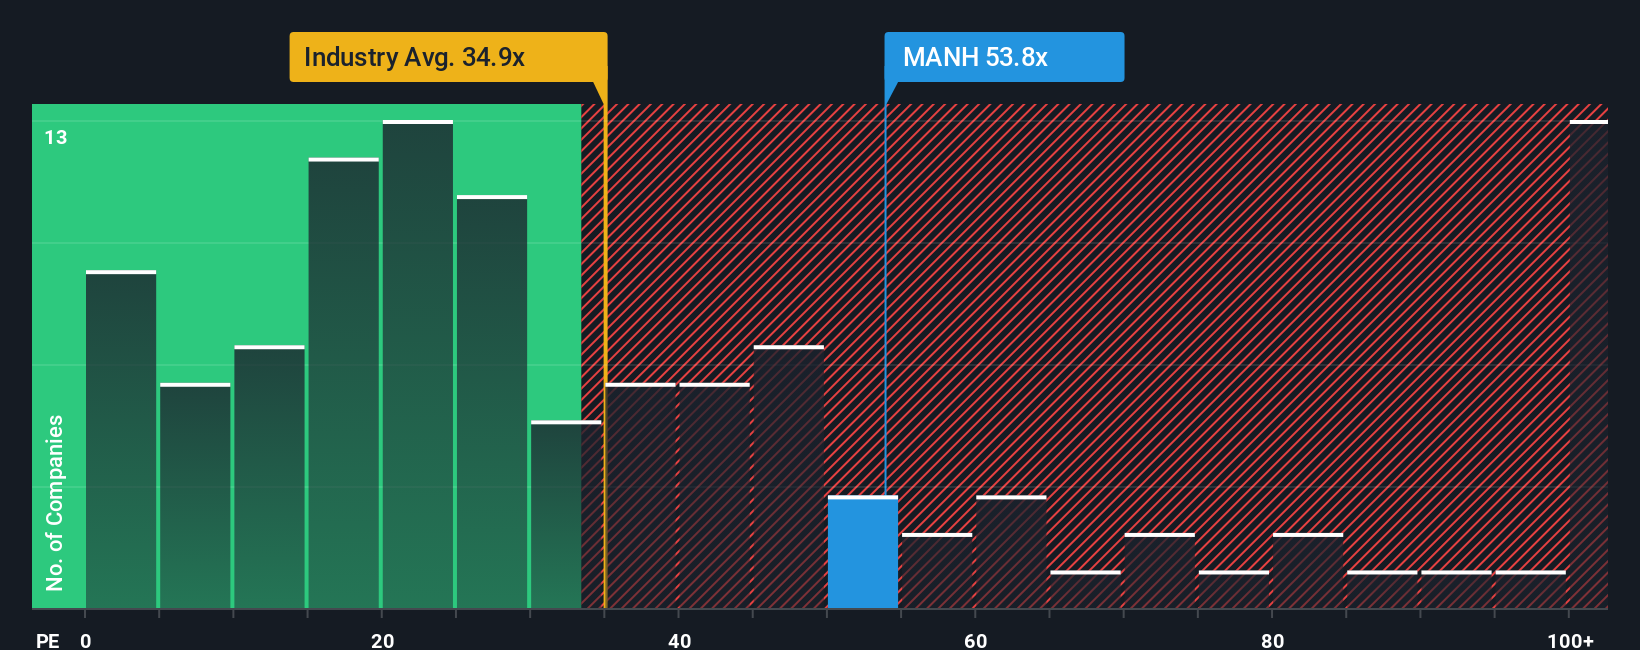
Right now, Manhattan Associates trades at a PE of 53.8x, substantially above the Software industry average of 34.9x and its public company peer group at 35.5x. At first glance, this makes the stock look expensive relative to sector benchmarks. However, these broad comparisons do not capture the full picture because they overlook critical factors like Manhattan’s growth outlook, margins, and size.
This is where Simply Wall St’s proprietary “Fair Ratio” comes in. The Fair Ratio calculates what a justified PE would be: 31.9x for Manhattan Associates. It factors in the company’s unique profile, including its earnings growth, profitability, industry, and market cap. Unlike simple peer or industry averages, the Fair Ratio is tailored to what actually matters for the business and serves as a more meaningful benchmark for valuation.
With Manhattan’s current PE ratio (53.8x) sitting well above its Fair Ratio (31.9x), this approach suggests the stock is trading at a premium relative to where its fundamentals would usually put it.
Result: OVERVALUED
 NasdaqGS:MANH PE Ratio as at Oct 2025
PE ratios tell one story, but what if the real opportunity lies elsewhere? Discover companies where insiders are betting big on explosive growth.
Upgrade Your Decision Making: Choose your Manhattan Associates Narrative
Earlier we mentioned there is an even better way to understand valuation, so let’s introduce you to Narratives. A Narrative is simply your personalized story about a company: your perspective on its future growth, risks, and financial outcomes, all mapped onto your own projected numbers for things like fair value, revenue, and margins. It connects the “why” behind your investment convictions to your actual forecasts and then calculates what you believe is a reasonable price for the stock today.
Narratives are available on the Simply Wall St Community page, making it easy for anyone to build their own forecast and see how their outlook stacks up against other investors, all updated automatically as real news and earnings are reported. This empowers you to decide when Manhattan Associates is a buy or sell by comparing your Fair Value to the current share price and refining your view as the facts change.
For Manhattan Associates, one investor’s Narrative could assume cloud migration and AI unlock accelerating growth and margin gains, leading them to a Fair Value of $250. Another might worry about sluggish conversions and tough competition, landing closer to $205. No matter which camp you fall into, Narratives make it easy to check your assumptions and see exactly how your thesis aligns with the latest data.
Do you think there’s more to the story for Manhattan Associates? Create your own Narrative to let the Community know!
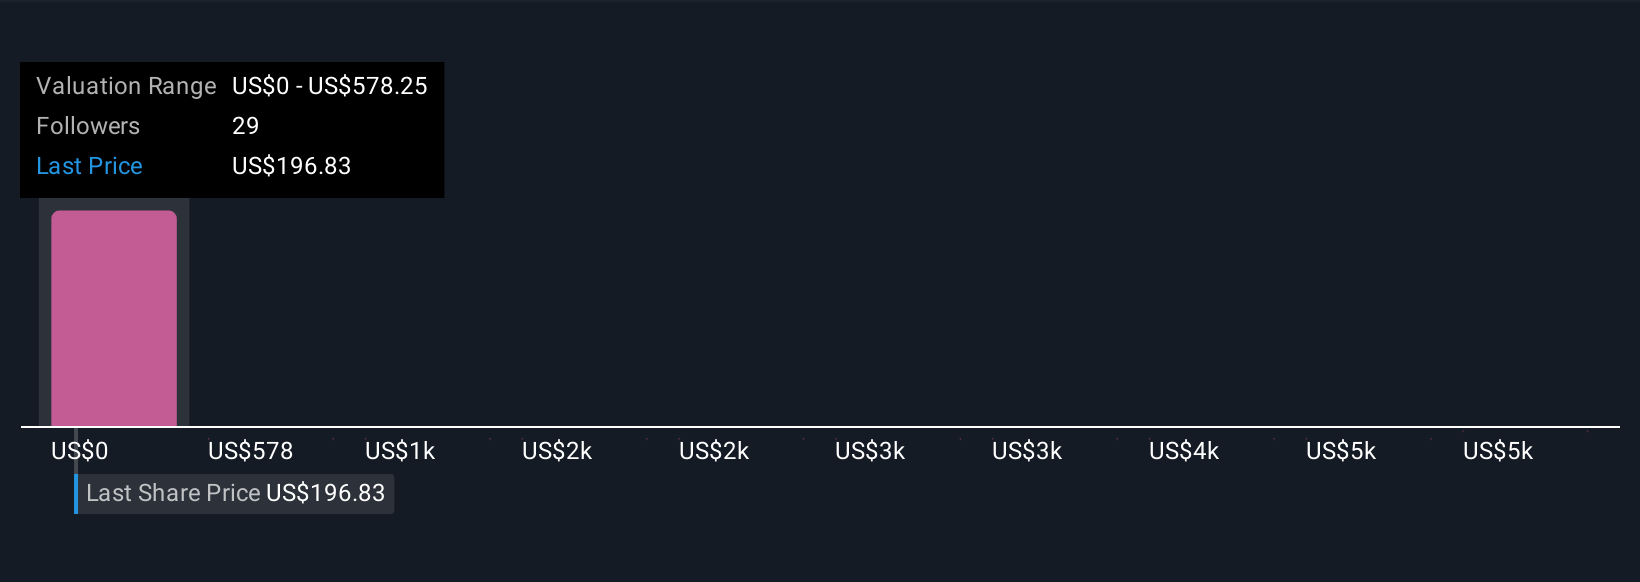 NasdaqGS:MANH Community Fair Values as at Oct 2025
This article by Simply Wall St is general in nature. We provide commentary based on historical data
and analyst forecasts only using an unbiased methodology and our articles are not intended to be financial advice. It does not constitute a recommendation to buy or sell any stock, and does not take account of your objectives, or your
financial situation. We aim to bring you long-term focused analysis driven by fundamental data.
Note that our analysis may not factor in the latest price-sensitive company announcements or qualitative material.
Simply Wall St has no position in any stocks mentioned.
New: Manage All Your Stock Portfolios in One Place
We’ve created the ultimate portfolio companion for stock investors, and it’s free.
• Connect an unlimited number of Portfolios and see your total in one currency
• Be alerted to new Warning Signs or Risks via email or mobile
• Track the Fair Value of your stocks
Have feedback on this article? Concerned about the content? Get in touch with us directly. Alternatively, email editorial-team@simplywallst.com