
Petition season for the 2026 primary season is already underway as of this Monday, and as The Citizen’s Lauren McCutcheon wrote last week, there are ample opportunities for people interested in local politics to win a seat on their local Democratic or Republican ward committee.
I’ve been a part of citywide organizing efforts for these hyper-local elections in 2018 and 2022 on the Democratic side, and want to help underscore just how low the barrier to success is in these races for anyone who may be on the fence about giving it a try this year.
This election season I’ve been more focused on making some election organizing tools with Claude Code that I hope will be broadly useful to committeeperson candidates across the city, and help to reduce the frictions of organizing even more. 5th Square PAC, the urbanist organization, is hosting these tools but they’re there for anybody who’s interested.
Along the way in building those, there turned out to be some good journalism grist too for helping more local politics watchers gain a better understanding of this vast and fragmented party ecosystem. Here are a few key things I learned looking at the 2022 committeeperson election results data and the January 2026 voter file.
Over 90 percent of races were uncontested
In 2022, fully 91 percent of Philly’s 1,703 divisions had no competitive election for Democratic committeeperson. Each division can elect up to two people, but only 151 divisions — 9 percent — had a contested primary where 3 or more people ran.
The rest were uncontested slates of candidates (1,020 divisions), write-in winners (402), or divisions where no candidates filed (130).
Within that 9 percent of divisions with contested races, the median winning vote total was just 83 votes. About a third of the competitive races came down to single-digit win margins.
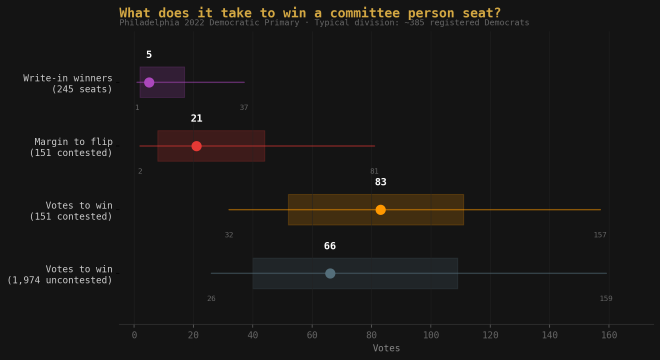
The median win margin in contested races was 21 votes. About a third of all competitive races — 49 out of 151 — were very competitive, and were decided by 10 or fewer votes. In those races, the median margin was just 5.5 votes. We are talking about very small numbers of people who participate in these elections.
Voter participation drops off significantly as you get that far down the ballot, and this is where getting out and introducing yourself to your neighbors in the weeks and months between now and the election can really pay off.
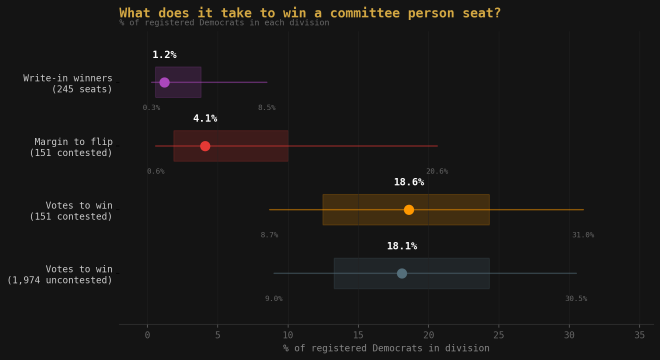
In both contested and uncontested divisions alike, only about 18 to 19 percent of registered Democratic voters in the median division even vote in the committeeperson elections. But the typical Philadelphia voting division has about 385 registered Democrats, and people are winning these races with less than 100 votes.
In a typical division, if eight people showed up to the polls in 2022 who weren’t otherwise planning to vote, they could have changed the outcome in a quarter of every competitive CP election in the city.
For write-in candidates — people who decide to run after the final ballot is set by the City Commissioners — the bar is even lower. 402 people won CP elections as write-in candidates in 2022, with a median winning write-in vote total of just seven votes. Some 137 of those candidates won with five or fewer votes, and 10 divisions were won with a single vote!
High churn
For everyone thinking about 2026, the 2022 winners data is only so helpful. People move a lot, and many people who got elected to one of these seats in 2022 now live somewhere else. And nobody knows but the ward leaders at this point, heading into the next election.
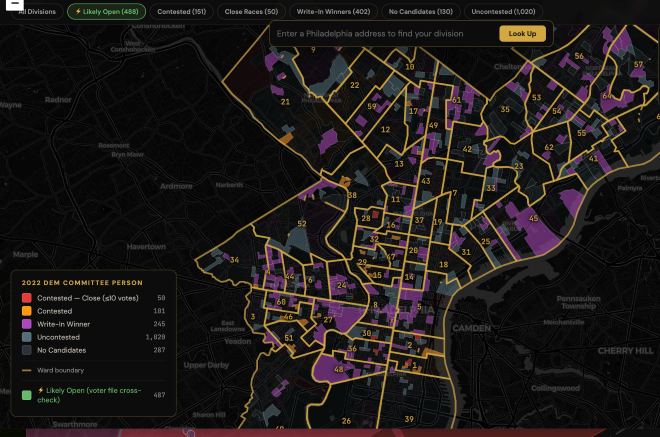
As part of my work on the election tools, I pulled in a voter file I downloaded in January and joined the 2022 committeeperson election data to the voter file as best I could, to look at this question. On the map, you can select the “Likely Open Seats’ filter and see the divisions where a confirmed match (between the election list and the voter file list) has moved—which we know based on a confirmed changed registration address, changed party status, or their absence from the Philadelphia voter file.
Counting only the high-confidence matches to be conservative, at least 487 divisions now have a likely open committeeperson seat.
When a seat is open, ward leaders have a lot of power to fill those seats with people aligned with them. Which isn’t necessarily good or bad on its own, but if you find yourself disagreeing with who your ward endorses in City Council and state legislative primaries, then it’s a problem. In the “open” wards, the full committee gets to vote on candidate endorsements, and in “closed” wards, only the ward leader gets to decide.
The reason some organizations get involved in competing for these races is because next year, the wards will endorse in City Council primaries, and who wins CP seats determines which types of candidates will be recommended to voters outside the polls on Election Day. The ward elections are, to a large extent, just a big proxy fight over 2027 endorsement power. Which is all to say, the more seats are left open after the election, the more votes the ward leader gets to support their favorites.
Committeeperson turnover varies a lot by Council District
Perhaps unsurprisingly, the 1st Council District, which includes a lot of wealthier and gentrifying areas, had the highest share of competitive elections, with average levels of committeeperson turnover since 2027. Twenty-three percent of the divisions had contested races there. The next most competitive district was the 4th, with 13 percent of divisions seeing contested races, and the lowest turnover percentage of the 10 Council districts.
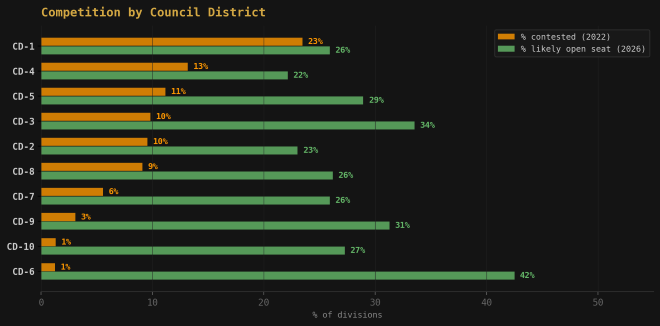
In three Council districts — the 3rd, 6th, and 9th — over 30 percent of the committeeperson seats will turn over from 2022. And the 6th District is a massive outlier among the group, with 42 percent turnover.
That’s a worrying sign for Democratic organizational infrastructure in the Lower Northeast from Democratic City Committee’s perspective. Its only comparison is the Republican 10th District represented by Council’s only GOP member Brian O’Neill, and it could be a sign that Trump-era political-demographic realignment factors are starting to hurt the party downballot.
As a whole, the least competitive Council districts tend to have the most vacancies, calling into question whether Democratic City Committee’s strong allergy to intense primary competition is actually very helpful to the party as an organization, or just the current leadership. The places that don’t see much interest or enthusiasm in competing for these elections also see the highest turnover of committee people.
The full picture shows a political organization that is overwhelmingly not seeing a surge of new participants, even during what felt to many of us in the Gentrification Belt neighborhoods like a very competitive party election cycle last time.
With so little competition actually happening, it makes the party look paranoid about new entrants at a time when the problem they’re facing is exactly the opposite—they’re working with an unpopular national brand that is struggling to capitalize on Donald Trump’s deep unpopularity. Under the circumstances, they could use all the help they can get.
For more information on how to run, or just to see what the landscape looks like where you live, visit 5th Square’s election hub website.
![]() MORE ON LOCAL ELECTED OFFICES
MORE ON LOCAL ELECTED OFFICES
Photo by Josh Middleton