

Erie Indemnity (ERIE) closed out FY 2025 with fourth quarter revenue of US$951.0 million and basic EPS of US$1.21, while trailing twelve month revenue stood at about US$4.1 billion and EPS at US$10.70. Together, these figures set the scene for a year in which margins and earnings quality will be front of mind for investors. The company has seen quarterly revenue move from US$924.1 million and EPS of US$3.29 in Q4 2024 to US$951.0 million and EPS of US$1.21 in Q4 2025. Those shifts, alongside a trailing net profit margin of 13.8% versus 15.8% a year earlier and a 2.28% dividend yield, frame a results season where investors are watching how profitability holds up.
See our full analysis for Erie Indemnity.
With the numbers on the table, the next step is to set these results against the most widely held narratives about Erie Indemnity to see which views are supported by the data and which ones start to look out of date.
Curious how numbers become stories that shape markets? Explore Community Narratives
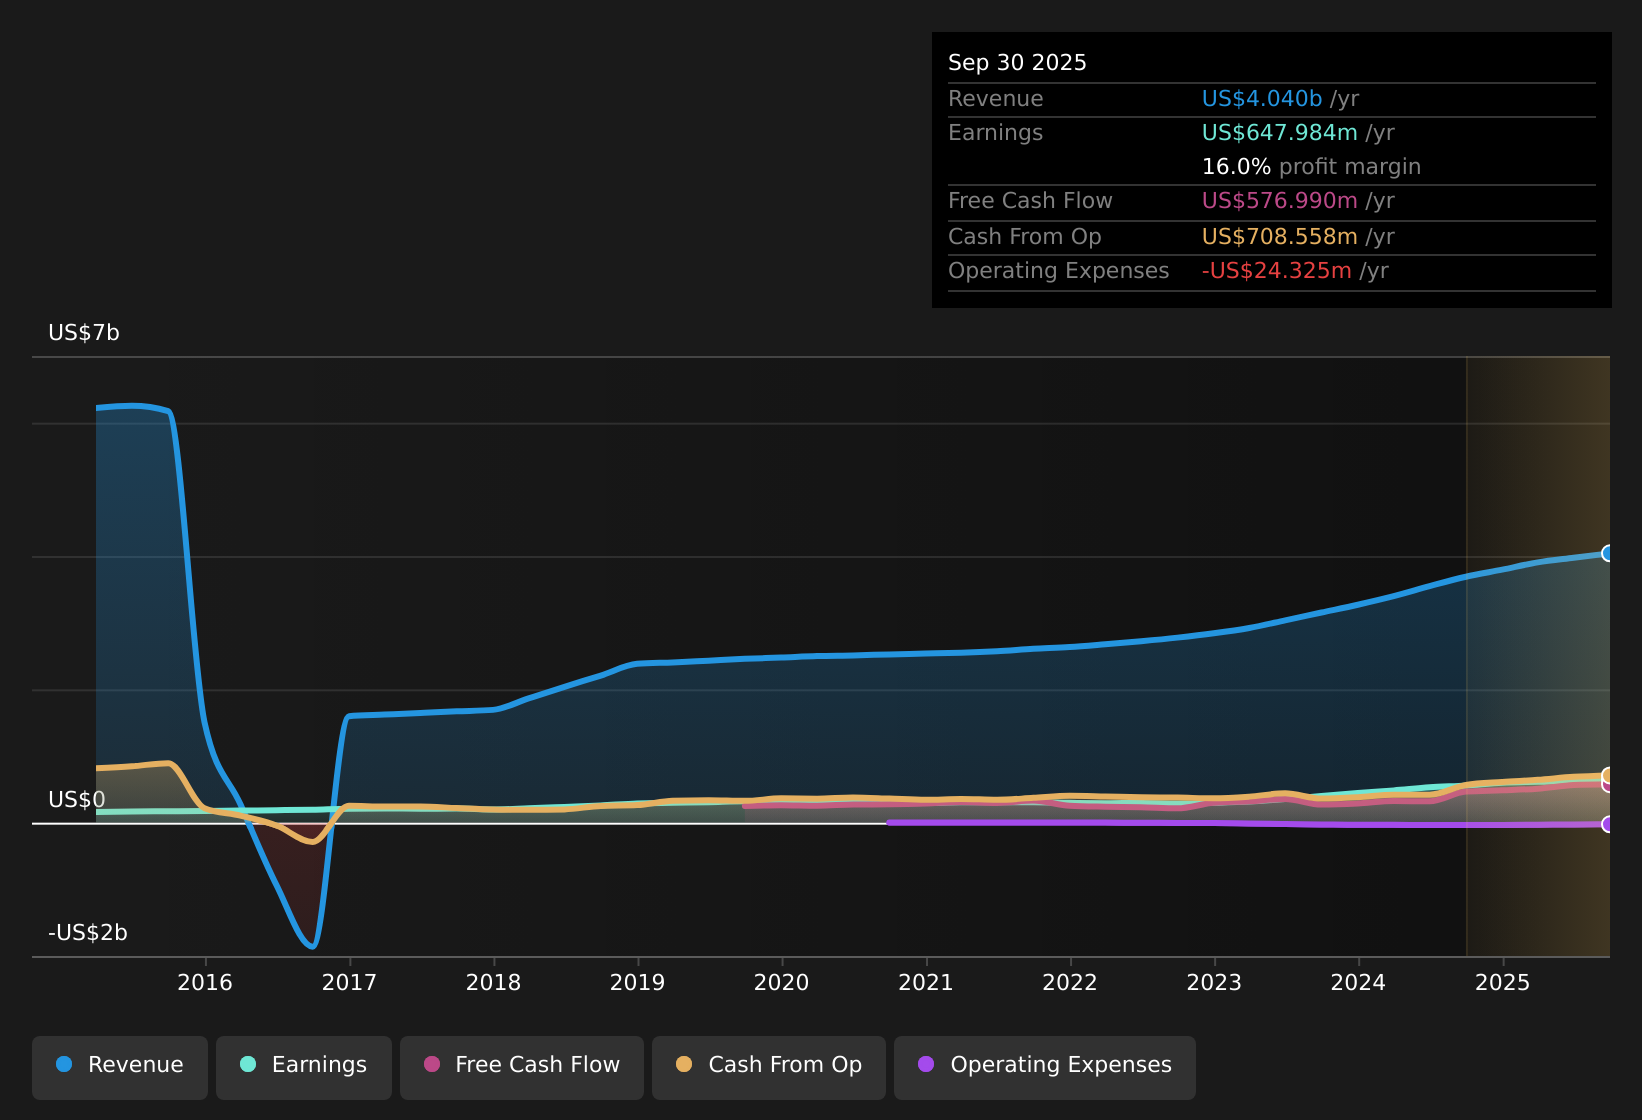 NasdaqGS:ERIE Earnings & Revenue History as at Feb 2026 13.8% margin and earnings wobble against five year trend Over the last 12 months, Erie Indemnity reported a 13.8% net profit margin versus 15.8% a year earlier, and that sits alongside five year earnings growth of 19.2% a year, with earnings turning negative in the most recent year relative to that longer trend. Bears argue that the recent earnings weakness undercuts the longer term growth story, and the margin data gives them specific numbers to point to.
The trailing 12 month figures show net income of US$559.3 million on US$4.1b of revenue, while the commentary notes that earnings for the most recent year were negative versus the 19.2% annual growth rate over five years, so short term performance does not mirror the multi year pattern. With Q4 2025 net income at US$63.4 million compared with US$152.0 million in Q4 2024, critics focus on how that gap lines up with the margin shift from 15.8% to 13.8% when they question the durability of past growth. Trailing P/E of 24x and price above DCF fair value The stock trades on a trailing P/E of 24x, compared with a peer average of 14.8x and a US insurance industry average of 12.3x, and at a share price of US$257.01 that sits above the DCF fair value of US$250.88. What stands out for bearish investors is how this valuation premium lines up with softer recent profitability.
The premium P/E multiple, together with a DCF fair value that is lower than the current share price, is being considered alongside the 13.8% trailing margin, which is below the 15.8% margin a year earlier, when skeptics question how much optimism is already reflected in the price. Because the data set is based on trailing numbers rather than forward estimates, bears focus on the gap between the US$559.3 million of trailing net income and the negative earnings outcome in the most recent year relative to the five year trend when weighing whether 24x P/E and a price above DCF fair value leave much room for disappointment. Investors who want to see how different valuation models and community views stack up against these numbers can take a closer look at Curious how numbers become stories that shape markets? Explore Community Narratives for extra context around the story behind the figures.
Dividend yield of 2.28% alongside mixed profit signals The company paid a dividend that yields 2.28% over the last 12 months, set against trailing 12 month net income of US$559.3 million and net profit margin of 13.8%. Supporters often highlight the combination of long term earnings growth and a steady income stream, and the trailing figures give them some backing but also add a few points to watch.
The historical 19.2% annual earnings growth rate over five years and the 2.28% yield are considered together when investors talk about Erie as a potential long term compounder, even though the most recent year showed earnings turning negative against that longer run rate. At the same time, the move from a 15.8% to 13.8% net margin over the last year means income focused holders are keeping an eye on how future profits track relative to the current US$4.1b revenue base to gauge how comfortably that dividend fits within earnings. Next Steps
Don’t just look at this quarter; the real story is in the long-term trend. We’ve done an in-depth analysis on Erie Indemnity’s growth and its valuation to see if today’s price is a bargain. Add the company to your watchlist or portfolio now so you don’t miss the next big move.
If this mix of earnings pressure and valuation questions leaves you on the fence, take a moment to review the numbers yourself and move quickly in forming your own stance. To see what others view as the brighter parts of the story, have a look at 1 key reward and weigh those points against your own reading of the results.
Explore Alternatives
Erie Indemnity’s recent negative earnings against its five year growth trend, margin compression from 15.8% to 13.8%, and 24x P/E above DCF fair value all point to valuation pressure.
If that combination of softer profitability and a premium price makes you uneasy, check out 51 high quality undervalued stocks to quickly zero in on companies where pricing looks more aligned with recent earnings strength.
This article by Simply Wall St is general in nature. We provide commentary based on historical data
and analyst forecasts only using an unbiased methodology and our articles are not intended to be financial advice. It does not constitute a recommendation to buy or sell any stock, and does not take account of your objectives, or your
financial situation. We aim to bring you long-term focused analysis driven by fundamental data.
Note that our analysis may not factor in the latest price-sensitive company announcements or qualitative material.
Simply Wall St has no position in any stocks mentioned.
Valuation is complex, but we’re here to simplify it.
Discover if Erie Indemnity might be undervalued or overvalued with our detailed analysis, featuring fair value estimates, potential risks, dividends, insider trades, and its financial condition.
Have feedback on this article? Concerned about the content? Get in touch with us directly. Alternatively, email editorial-team@simplywallst.com