

Find winning stocks in any market cycle. Join 7 million investors using Simply Wall St’s investing ideas for FREE.
If you are wondering whether Erie Indemnity at around US$257 per share is starting to look attractive, this article will walk through what the current price might be implying about its value.
The stock has recently been under pressure, with a 9.5% decline over the last 7 days, 6.8% over the last 30 days, a 7.5% decline year to date, and a 34.1% decline over the past year. The 3 year and 5 year returns sit at 14.6% and 15.8% respectively.
These moves have put Erie Indemnity back on some investors’ radars and have raised questions about whether the recent share price performance aligns with the underlying fundamentals. That is what makes an evergreen look at valuation useful, as it can help you separate short term sentiment from a longer term view of what the business might be worth.
On our framework of six valuation checks, Erie Indemnity currently scores 0 out of 6 on value. You can see this in more detail in its valuation score. Next we will step through the main valuation approaches before finishing with a way to assess value that goes beyond any single model.
Erie Indemnity scores just 0/6 on our valuation checks. See what other red flags we found in the full valuation breakdown.
The Excess Returns model looks at how much profit Erie Indemnity earns on its equity compared with the return that shareholders require. Instead of focusing on cash flows, it starts with the company’s book value and earnings power, then estimates how much value is created after covering the cost of equity.
For Erie Indemnity, book value is $43.67 per share and stable earnings per share are estimated at $10.14, based on the median return on equity from the past 5 years. The average return on equity is 29.00%, while the cost of equity is $2.44 per share, which leaves an excess return of $7.70 per share. The stable book value input used in the model is $34.97 per share, taken from the median book value over the past 5 years.
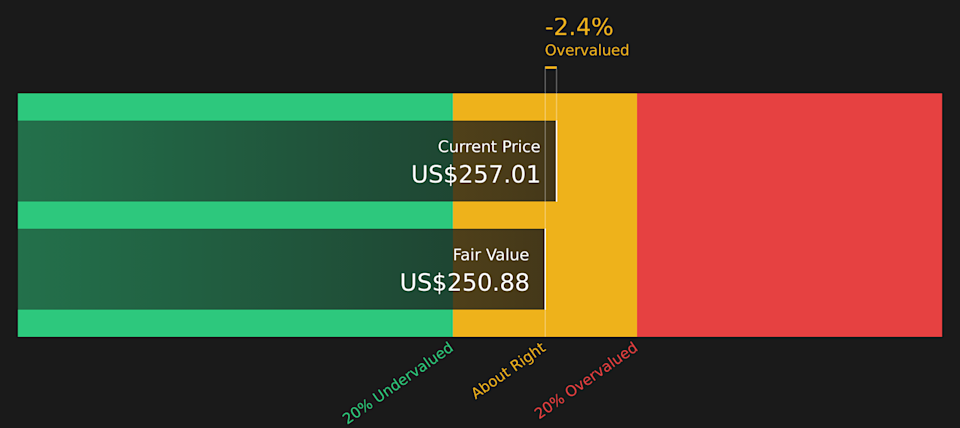
Using these inputs, the Excess Returns framework produces an estimated intrinsic value of about $250.88 per share. Compared with the current share price of roughly $257, this implies the stock is about 2.4% overvalued, which is a relatively small gap.
Result: ABOUT RIGHT
Erie Indemnity is fairly valued according to our Excess Returns, but this can change at a moment’s notice. Track the value in your watchlist or portfolio and be alerted on when to act.
 ERIE Discounted Cash Flow as at Feb 2026
Story Continues
For a profitable company like Erie Indemnity, the P/E ratio is a straightforward way to see how much investors are paying for each dollar of earnings. It links directly to what the business is currently earning, which many investors find easier to relate to than more complex cash flow models.
What counts as a “fair” P/E usually reflects two things: growth expectations and risk. Higher expected earnings growth or lower perceived risk can justify a higher multiple, while slower growth or higher risk tends to point to a lower one.
Erie Indemnity currently trades on a P/E of about 24.0x. That is above the Insurance industry average P/E of around 12.1x and also above the peer group average of roughly 14.8x. Simply Wall St’s Fair Ratio is a proprietary estimate of what P/E might make sense for Erie Indemnity, based on its earnings growth profile, industry, profit margins, market cap and company specific risks, rather than just simple comparisons.
Because the Fair Ratio is tailored to the company, it can be more informative than looking only at peers or the broad industry. In this case, the Fair Ratio is not available, so there is no model based comparison to determine whether the current P/E looks overvalued or undervalued.
Result: ABOUT RIGHT
 NasdaqGS:ERIE P/E Ratio as at Feb 2026
P/E ratios tell one story, but what if the real opportunity lies elsewhere? Start investing in legacies, not executives. Discover our 22 top founder-led companies.
Earlier we mentioned that there is an even better way to understand valuation, so let us introduce you to Narratives, which are simply your story about a company, tied directly to your view of fair value and your expectations for future revenue, earnings and margins.
On Simply Wall St, Narratives sit inside the Community page and give you an easy way to connect Erie Indemnity’s story to a financial forecast and then to an estimated fair value, so you can quickly see how your view compares with the current share price.
You set the assumptions; the platform turns them into a forecast and fair value. You can then use the gap between Fair Value and Price to help decide whether the stock looks appealing, fully priced or expensive for you personally.
Narratives are refreshed when new information such as earnings or news is added to the platform, so your story and fair value stay in sync with what is happening. You can see, for example, one Erie Indemnity Narrative that assumes a relatively low fair value and modest outlook beside another that assumes a much higher fair value and stronger outlook, all using the same underlying tool.
Do you think there’s more to the story for Erie Indemnity? Head over to our Community to see what others are saying!
NasdaqGS:ERIE 1-Year Stock Price Chart
This article by Simply Wall St is general in nature. We provide commentary based on historical data and analyst forecasts only using an unbiased methodology and our articles are not intended to be financial advice. It does not constitute a recommendation to buy or sell any stock, and does not take account of your objectives, or your financial situation. We aim to bring you long-term focused analysis driven by fundamental data. Note that our analysis may not factor in the latest price-sensitive company announcements or qualitative material. Simply Wall St has no position in any stocks mentioned.
Companies discussed in this article include ERIE.
Have feedback on this article? Concerned about the content? Get in touch with us directly. Alternatively, email editorial-team@simplywallst.com