

What recent performance means for Erie Indemnity (ERIE) shareholders
Recent trading in Erie Indemnity (ERIE) has drawn attention after a 6.1% one day decline, adding to weaker returns over the past week, month and past 3 months, and prompting investors to reassess expectations.
Over the past week the stock is down 7.9%, with a 1 month return of a 3.0% decline and a past 3 months return of a 14.3% decline. Year to date, Erie Indemnity has fallen 15.9%, while the 1 year total return stands at a 31.4% decline.
Set against this shorter term weakness, the company’s longer track record shows a 3 year total return of 7.5% and a 5 year total return of 18.2%. That mix of outcomes is shaping how investors are looking at current pricing and business fundamentals.
See our latest analysis for Erie Indemnity.
This latest 6.1% one day share price decline, with the stock now at $233.62, adds to a year of weak share price returns and contrasts with the more positive multi year total shareholder returns.
If this pullback has you reassessing your watchlist, it could be a good moment to broaden your search and check out 18 top founder-led companies
With ERIE trading at $233.62 and an estimated intrinsic discount of about 11.6%, the question now is whether recent weakness has left the stock undervalued or if the market is already pricing in future growth.
Price-to-Earnings of 21.4x: Is it justified?
On earnings alone, Erie Indemnity looks expensive, with a P/E of 21.4x at a share price of $233.62 compared to a peer average of 15x and a US Insurance industry average of 11.6x.
The P/E ratio compares what you pay today for each dollar of earnings. A higher multiple usually reflects the market assigning a premium to the company’s profit profile.
For ERIE, that premium sits alongside some mixed signals, including negative earnings growth of 7% over the past year, net profit margins at 14% compared with 15.7% last year, and strong 5 year annual earnings growth of 18.7%. These factors may be influencing how investors view the business’s long term earnings power.
Compared with both the US Insurance industry P/E of 11.6x and the peer average of 15x, ERIE’s 21.4x multiple is materially higher. This suggests the market is willing to pay a clear premium relative to sector and peer benchmarks.
See what the numbers say about this price — find out in our valuation breakdown.
Result: Price-to-Earnings of 21.4x (OVERVALUED).
However, the premium P/E and recent 1 year total return decline of 31.4% highlight the risk that any disappointment on earnings or margins could pressure sentiment further.
Find out about the key risks to this Erie Indemnity narrative.
Another angle on value
While the 21.4x P/E points to an expensive stock, our DCF model tells a different story, with Erie Indemnity trading at $233.62 compared with an estimated future cash flow value of $264.13. That gap suggests a possible discount, so which signal should carry more weight for you?
Look into how the SWS DCF model arrives at its fair value.
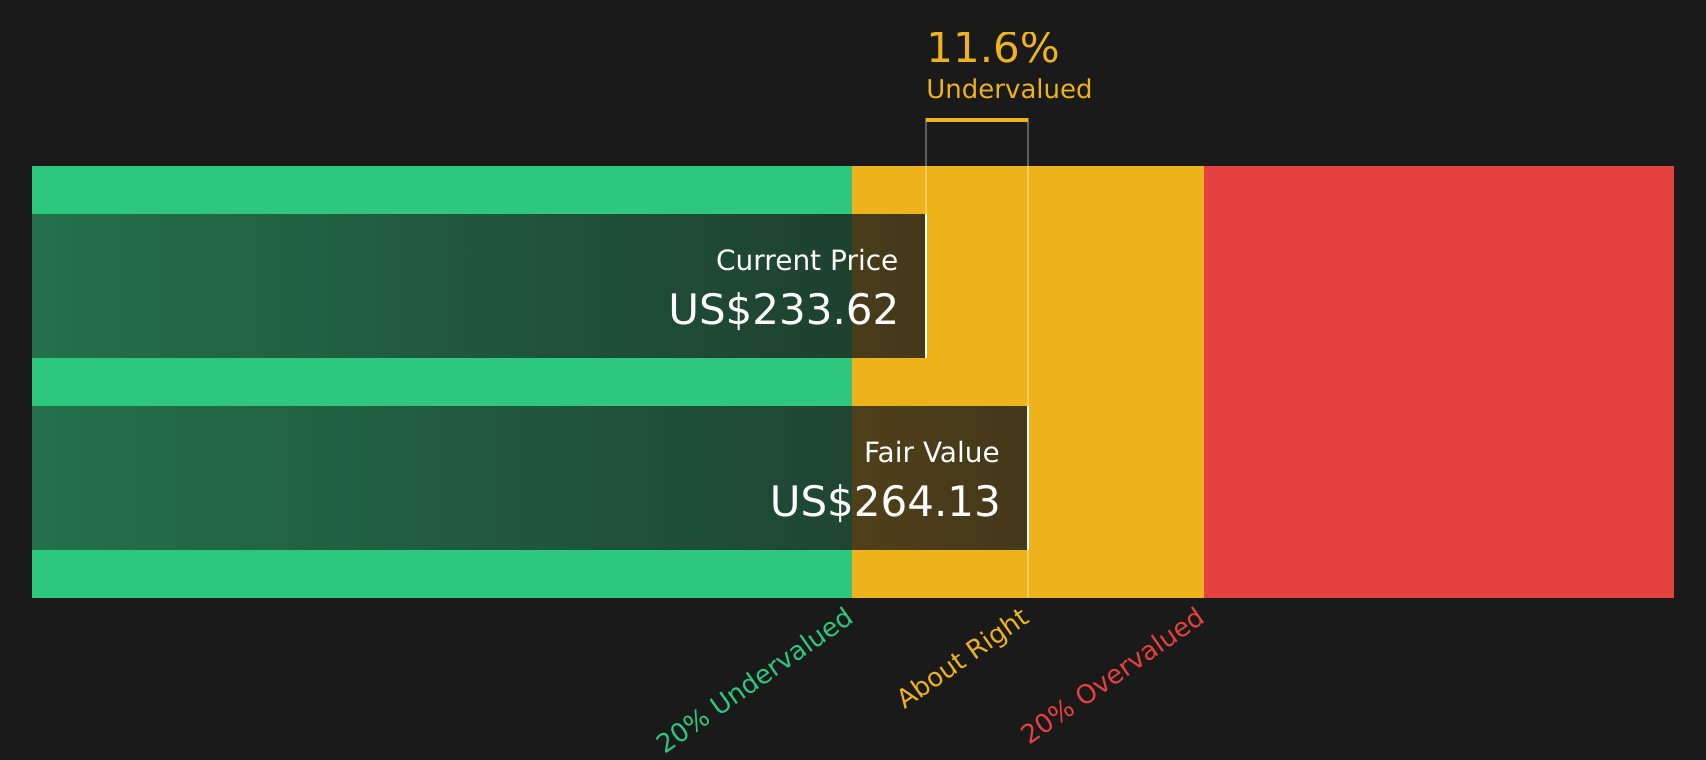 ERIE Discounted Cash Flow as at Apr 2026
Simply Wall St performs a discounted cash flow (DCF) on every stock in the world every day (check out Erie Indemnity for example). We show the entire calculation in full. You can track the result in your watchlist or portfolio and be alerted when this changes, or use our stock screener to discover 54 high quality undervalued stocks. If you save a screener we even alert you when new companies match – so you never miss a potential opportunity.
Next Steps
The recent combination of weak returns and a potential value gap might leave you undecided. Take a closer look now and weigh the upside factors for yourself by checking out 2 key rewards
Looking for more investment ideas?
If ERIE has sharpened your thinking, do not stop here. Use the Simply Wall St Screener to uncover other opportunities that might suit your approach.
This article by Simply Wall St is general in nature. We provide commentary based on historical data
and analyst forecasts only using an unbiased methodology and our articles are not intended to be financial advice. It does not constitute a recommendation to buy or sell any stock, and does not take account of your objectives, or your
financial situation. We aim to bring you long-term focused analysis driven by fundamental data.
Note that our analysis may not factor in the latest price-sensitive company announcements or qualitative material.
Simply Wall St has no position in any stocks mentioned.
Valuation is complex, but we’re here to simplify it.
Discover if Erie Indemnity might be undervalued or overvalued with our detailed analysis, featuring fair value estimates, potential risks, dividends, insider trades, and its financial condition.
Have feedback on this article? Concerned about the content? Get in touch with us directly. Alternatively, email editorial-team@simplywallst.com