
Upon creating the first survey, which easily collected and displayed real-time data, the health bureau started receiving vaccine survey requests from school districts, community organizations, and the county jail. Penchishen knew GIS was something the bureau needed to invest in.
“I saw the future with GIS. If we really use this right, we can really benefit from our data—all the time,” Penchishen said.
So with its Cooperative Agreement for Emergency Response: Public Health Crisis Response and Enhancing Detection grants, the city health bureau purchased GIS software licenses, training, and tech support for the next two years up front so that it could continue to leverage the technology and expand it to improve additional workflows.
“It’s been phenomenal for our organization,” said Penchishen. “We’re still certainly in the early stages and still learning, but very quickly we had staff buy-in. They saw that this could reduce some duplication; it could increase efficiencies. So, staff were eager to learn about how GIS could improve their programs. We also have seen just from the short time we’ve been using GIS that it’s really changing the way our organization operates, and it’s going to make us a better health department in the long run.”
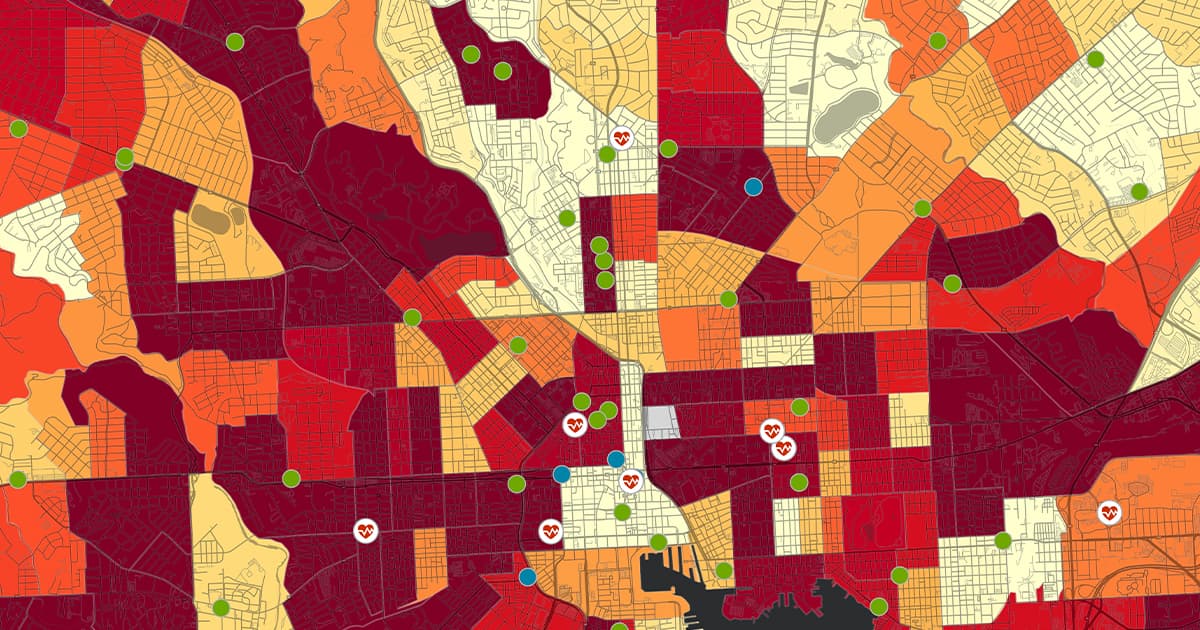
Still, in the middle of a global pandemic, the health bureau quickly started finding areas in its programs that could be improved. For example, upon connecting the survey results to dashboards, staff effortlessly detected populations that were getting vaccinated and which were not. Based on this information, the city’s health bureau saw that only 6 percent of its Hispanic population were getting vaccinated. The City of Bethlehem has a 28.2 percent population of Hispanics, so staff knew then that they had to adjust and tailor their outreach efforts toward these communities.