
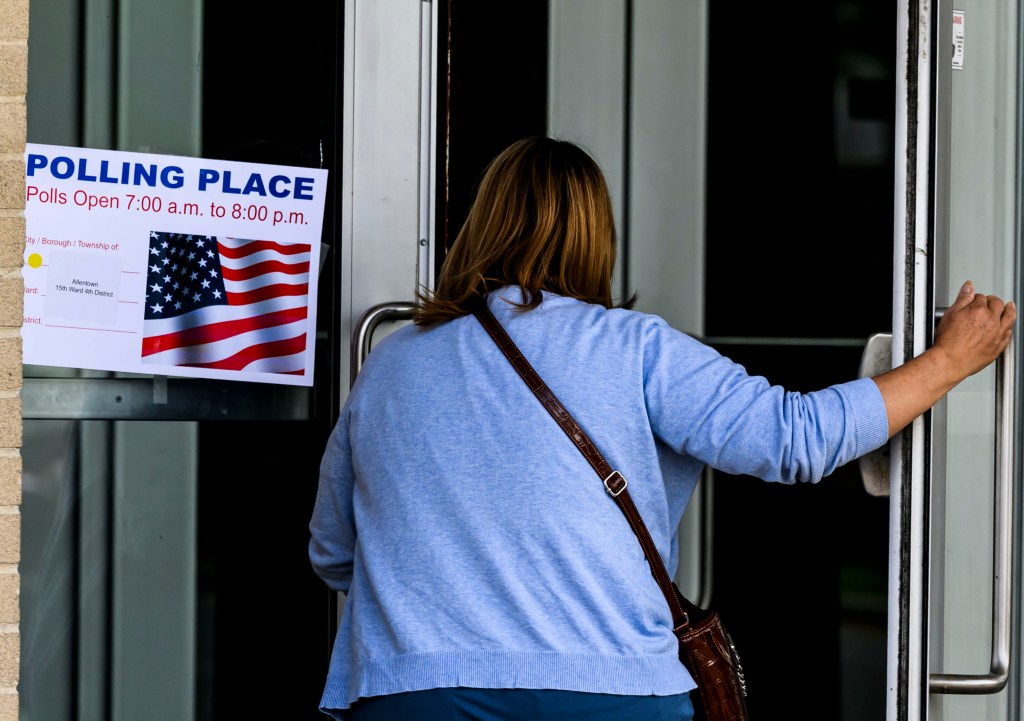
More than 6,400 Lehigh Valley residents joined the voter rolls between the May 20 primaries and the registration deadline in advance of Tuesday’s general municipal election.
The Pennsylvania Department of State, which oversees and coordinates the work of the state’s 67 county election offices, reports that there are 8.9 million voters on the rolls, down from the 9.17 million voters who were registered for the presidential election last year, typical of the ebb and flow of registrants through various election cycles.
Statewide, 58,000 people registered to vote before the Oct. 20 deadline, department data shows.
Democrats maintain a 1.9% registration margin statewide, with 3.81 million adherents compared with 3.64 million Republicans, slipping 1.2% since last year. That continues a rebalancing of the state’s electorate in effect for more than two decades. The chart below shows the current affiliation statistics.
The same holds true in Lehigh and Northampton counties. In Lehigh, Democrats outnumber Republican voters, 109,872 to 90,050. The margin is slightly smaller in Northampton County, where 94,409 voters are Democrats and 86,6156 are Republicans.
The mix of urban, suburban and rural areas helps keep things interesting to political wonks and makes Pennsylvania one of the swingier swing states. Democrats tend to dominate in population centers across the state, as shown in the county map below. Select a county to see its registration numbers.
Most of the state’s urban areas — Philadelphia, Pittsburgh, Allentown, Scranton, Erie and Harrisburg — trend in the Democrats’ favor, varying from an almost 60% registration advantage in Philadelphia down to 3.2% in Erie. Centre County, home of Penn State, lives up to its name with an almost evenly divided electorate.
Similar patterns are seen on the local level in Lehigh and Northampton counties: The three cities are reliably blue, while the suburbs are less strongly so, and the rural areas, especially in northwestern Lehigh County and northeastern Northampton County, are bright red, as seen in this municipal map.
Easton is the bluest place in the Lehigh Valley, with Democrats enjoying a 36.43% advantage over their Republican neighbors (56.1% versus 19.7%). That’s almost the mirror image of Lynn Township in Lehigh County, where Republicans outnumber their Democratic neighbors by a 36.44% margin, 60.8% versus 24.4%.
Northampton Borough’s voters claim the distinction of the most evenly divided between the two major parties. There are 12 more Democrats than Republicans among the 7,341 registrants — 2,954 Democrats compared with 2,942 Republicans, a whisker-thin 0.16% advantage. West Easton and Upper Macungie also have a less than 1% margin between the two parties.
The number of voters who choose not to affiliate with either major party hovers at about 16%. That includes those who have picked a third party like the Libertarian, Green or Conservative, or, more likely, have eschewed any party affiliation.
The trend is even stronger in the Lehigh Valley, where more than 1 out of 5 voters has gone their own way. The table below shows the top party affiliations of the area’s 480,165 registered voters.
New voters don’t like to party
Among the Lehigh Valley’s 480,000 voters are 6,440 people who weren’t on the voter rolls for the primaries in May. Newly registered voters are those that have not been registered anywhere in Pennsylvania, they do not include people who have moved within Pennsylvania and updated their registration to reflect their new address.
Only one area town, miniscule Chapman, which is surrounded by Moore Township in Northampton County, failed to add any newly registered voters to its 146 existing ones.
While the average age for all Lehigh Valley voters is 50.98 years, the newly registered average 34.5 years of age. Two local voters — one in Freemansburg and one in Upper Saucon — can celebrate their 18th birthday on Nov. 4 by casting their first votes. There are 1,469 18-year-olds among recent registrants, and 2,009 new Valley voters under 21, almost one-third of new voter enrollees.
But not every new voter is a Labubu-carrying, 6-7-juggling teenager or young adult: 484 newly enrolled voters are age 65 or older, including 18 people who are at least 90 years old. The oldest new voter will look forward to their 100th birthday the week after they cast their first vote in Pennsylvania.
The Democrats have a registration margin of 5.83% among all 480,000 voters in Lehigh and Northampton counties, and they are up 11.27% for the local voters who have registered since May 21. But that margin is deceptive in that it’s a higher percentage of a smaller total. The novice voters are much more likely than the general electorate to abandon parties altogether, as seen in this chart.
The largest plurality of new voters have chosen something other than Democratic or Republican, so it is anyone’s guess how they might choose to vote Tuesday.
Mailing it in
More than 1.1 million Pennsylvania voters — about 1 out of every 8 voters, or 12.7% — were approved for a mail or absentee ballot this election cycle, according to the Oct. 30 report from the Department of State. That’s a record number of requests for a municipal election cycle, and approximately the same as last year’s Presidential election.
A continuing trend is that Democrats favor mail ballots more than Republicans by a margin of 2.5 to 1. The county map below shows where the most voters requested mail or absentee ballots. (Although counted separately, mail and absentee ballots are functionally the same in Pennsylvania.)
As of Oct. 30, almost two-thirds of mail ballots have been returned to county election offices. They cannot be opened or counted until Election Day, although county election officials can, at their discretion, examine the outer envelope to determine if information is missing or illegible. If a voter is informed that their mail ballot has been rejected, they can vote by provisional ballot. Provisional ballots will be adjudicated starting Friday, when the official legal canvassing (counting of the votes) begins, according to Tim Benyo, Lehigh County’s chief clerk for registration and elections.
The table below shows the number of mail or absentee ballots sent and returned in each county.
In Lehigh County, 61% of the 33,932 mail ballots requested had been returned. More than 35% of the 35,192 ballots requested in Northampton County were returned.