
The data and insights featured in this article are from a report by Dr. Jim Lee, professor of economics at Texas A&M University-Corpus Christi. The study was commissioned by the Texas Real Estate Research Center.
The lack of affordable housing isn’t unique to Corpus Christi. It’s an issue impacting metros across Texas and the U.S. and it’s gotten worse since the pandemic.
In 2020, Corpus Christi had a Housing Affordability Index (HAI) ratio of 1.8, meaning the median household income was 80 percent higher than what was needed to qualify for a mortgage of a median-priced home (assuming 20 percent down and 25 percent of income as the qualifying ratio). As of 2024, that ratio was close to one (1.08 HAI, or 8 percent) under the same assumptions.
During the same period, 2020 to 2024, the average price of a house in Corpus Christi has gone from $269,447 to $357,008, a 32.5 percent increase. This underscores how high interest rates, a stagnant job market, rising home prices, and lack of inventory have combined to make homeownership difficult for many in Corpus Christi.
There have been some improvements. The HAI has increased to 1.19 as of third quarter 2025, and there has been progress made by city officials and policymakers to remove roadblocks preventing residents from having more affordable housing options. Still, more can be done to increase inventory, especially in certain communities.
Imbalance in the Housing Market
Increasing inventory is one way to lower housing costs. In Corpus Christi, there is seemingly enough approved housing to accommodate the expected local population growth through 2050. So, why aren’t more houses being built where they are needed the most?
As of 2024, more than 15,000 units were authorized or zoned and awaiting construction to begin. Assuming 2.5 residents per household, development is expected to accommodate approximately 38,000 additional residents. According to the Corpus Christi Metropolitan Planning Organization’s Small Area Forecast Task Force, the metro area is expected to grow to approximately 471,000 by 2050, or roughly 26,000 more residents than those in the 2020 U.S. Census.
By those estimations, Corpus Christi has enough potential inventory to satisfy its population growth. However, construction hasn’t spread throughout the metro area. Instead, most new housing projects are in the London district (ZIP code 78415) and other South Side communities (ZIP code 78414), as well as ZIP code 78418, which includes Flour Bluff and North Padre Island. As previously reported in this series, 15 percent of workers commute from ZIP code 78414 and approximately 10 percent commute from ZIP code 78415.
Is Infill Development the Solution?
Providing housing supply that aligns with the specific needs of workers in different industries can mitigate the imbalances of the region’s housing market. One way to do that is with infill development, or housing construction on land that is unused or underused. However, the distribution of infill lots is uneven across the metro area and especially prevalent in certain ZIP codes.
Figure 1 shows neighborhoods for future infill housing development. Neighborhoods adjacent to the industrial district next to the Inner Harbor have the largest shares of infill lots. More than half of land lots in ZIP codes 78402 and 78407 are vacant. However, the newest developments in 78413 and 78414 are mostly built out. In Flour Bluff and North Padre Island (ZIP code 78418), 22 percent of the lots are vacant.
FIGURE 1: SHARE OF INFILL LOTS BY ZIP CODE
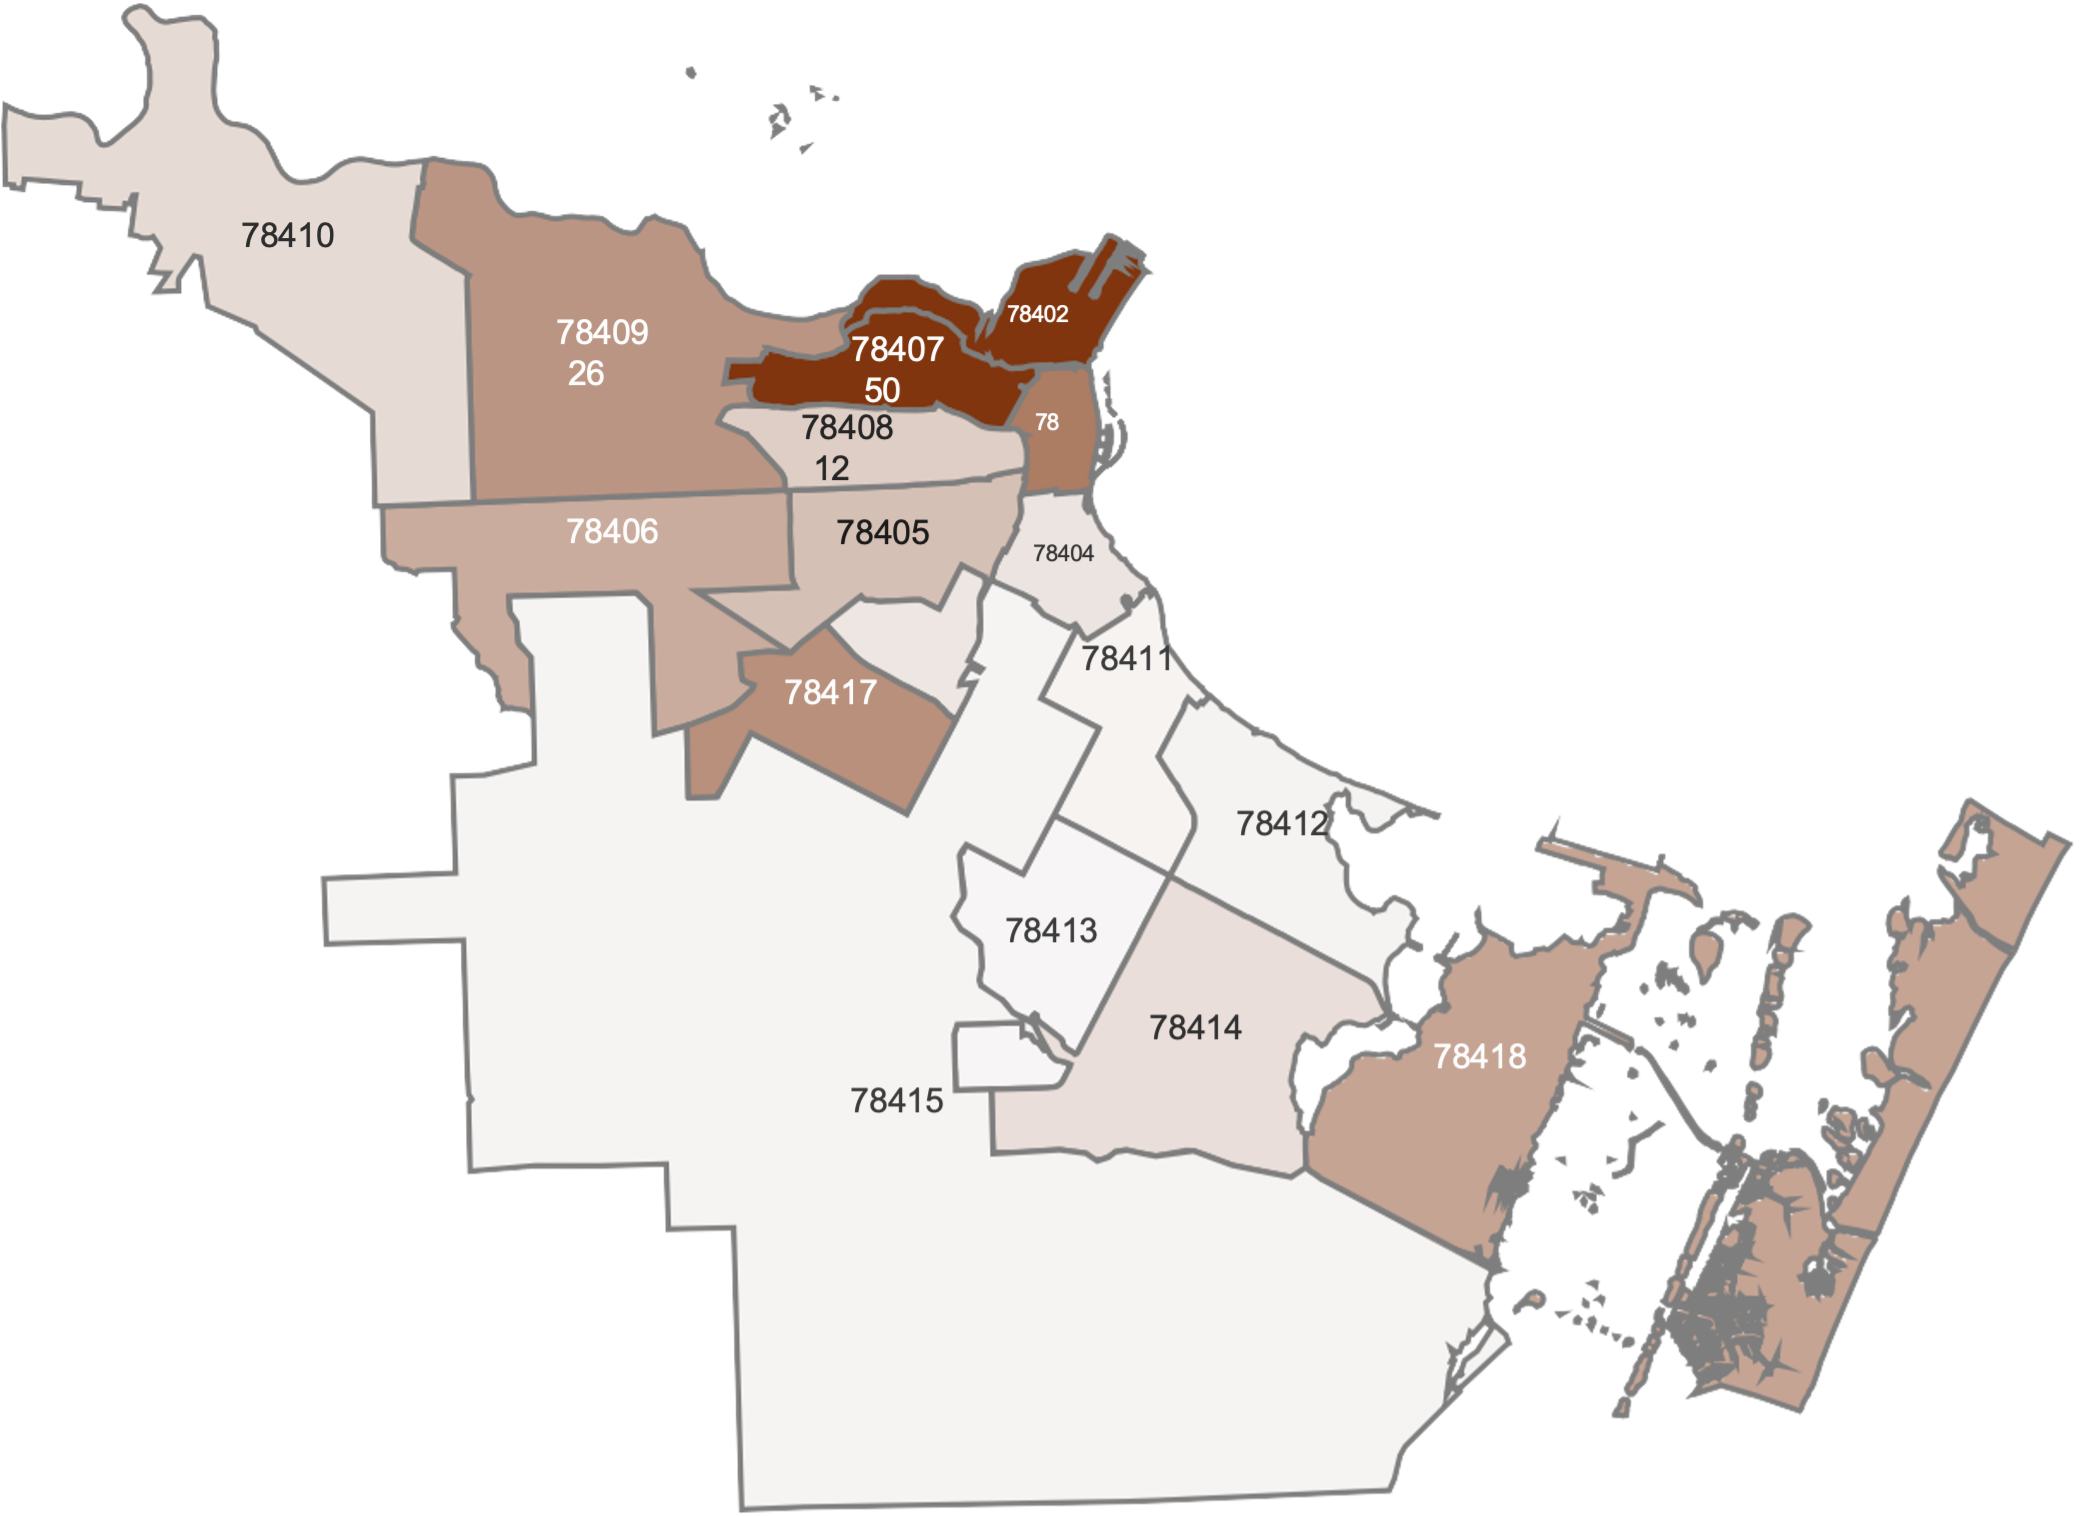 Source: City of Corpus Christi
Note: Calculated from individual land parcel data obtained from the Open Data database provided by the City of Corpus Christi GIS Services.
The slow pace of housing development in certain neighborhoods could be due to a lack of financial incentives for developers. Figure 2 plots the infill lot data of individual ZIP code areas against the percentage change in median closing prices of homes sold in those areas between 2012 and 2023. The dashed red line suggests that neighborhoods experiencing faster home price appreciation tended to have relatively fewer vacant lots.
FIGURE 2: INFILL LOTS VS. 2012-23 HOME PRICE CHANGE BY ZIP CODE
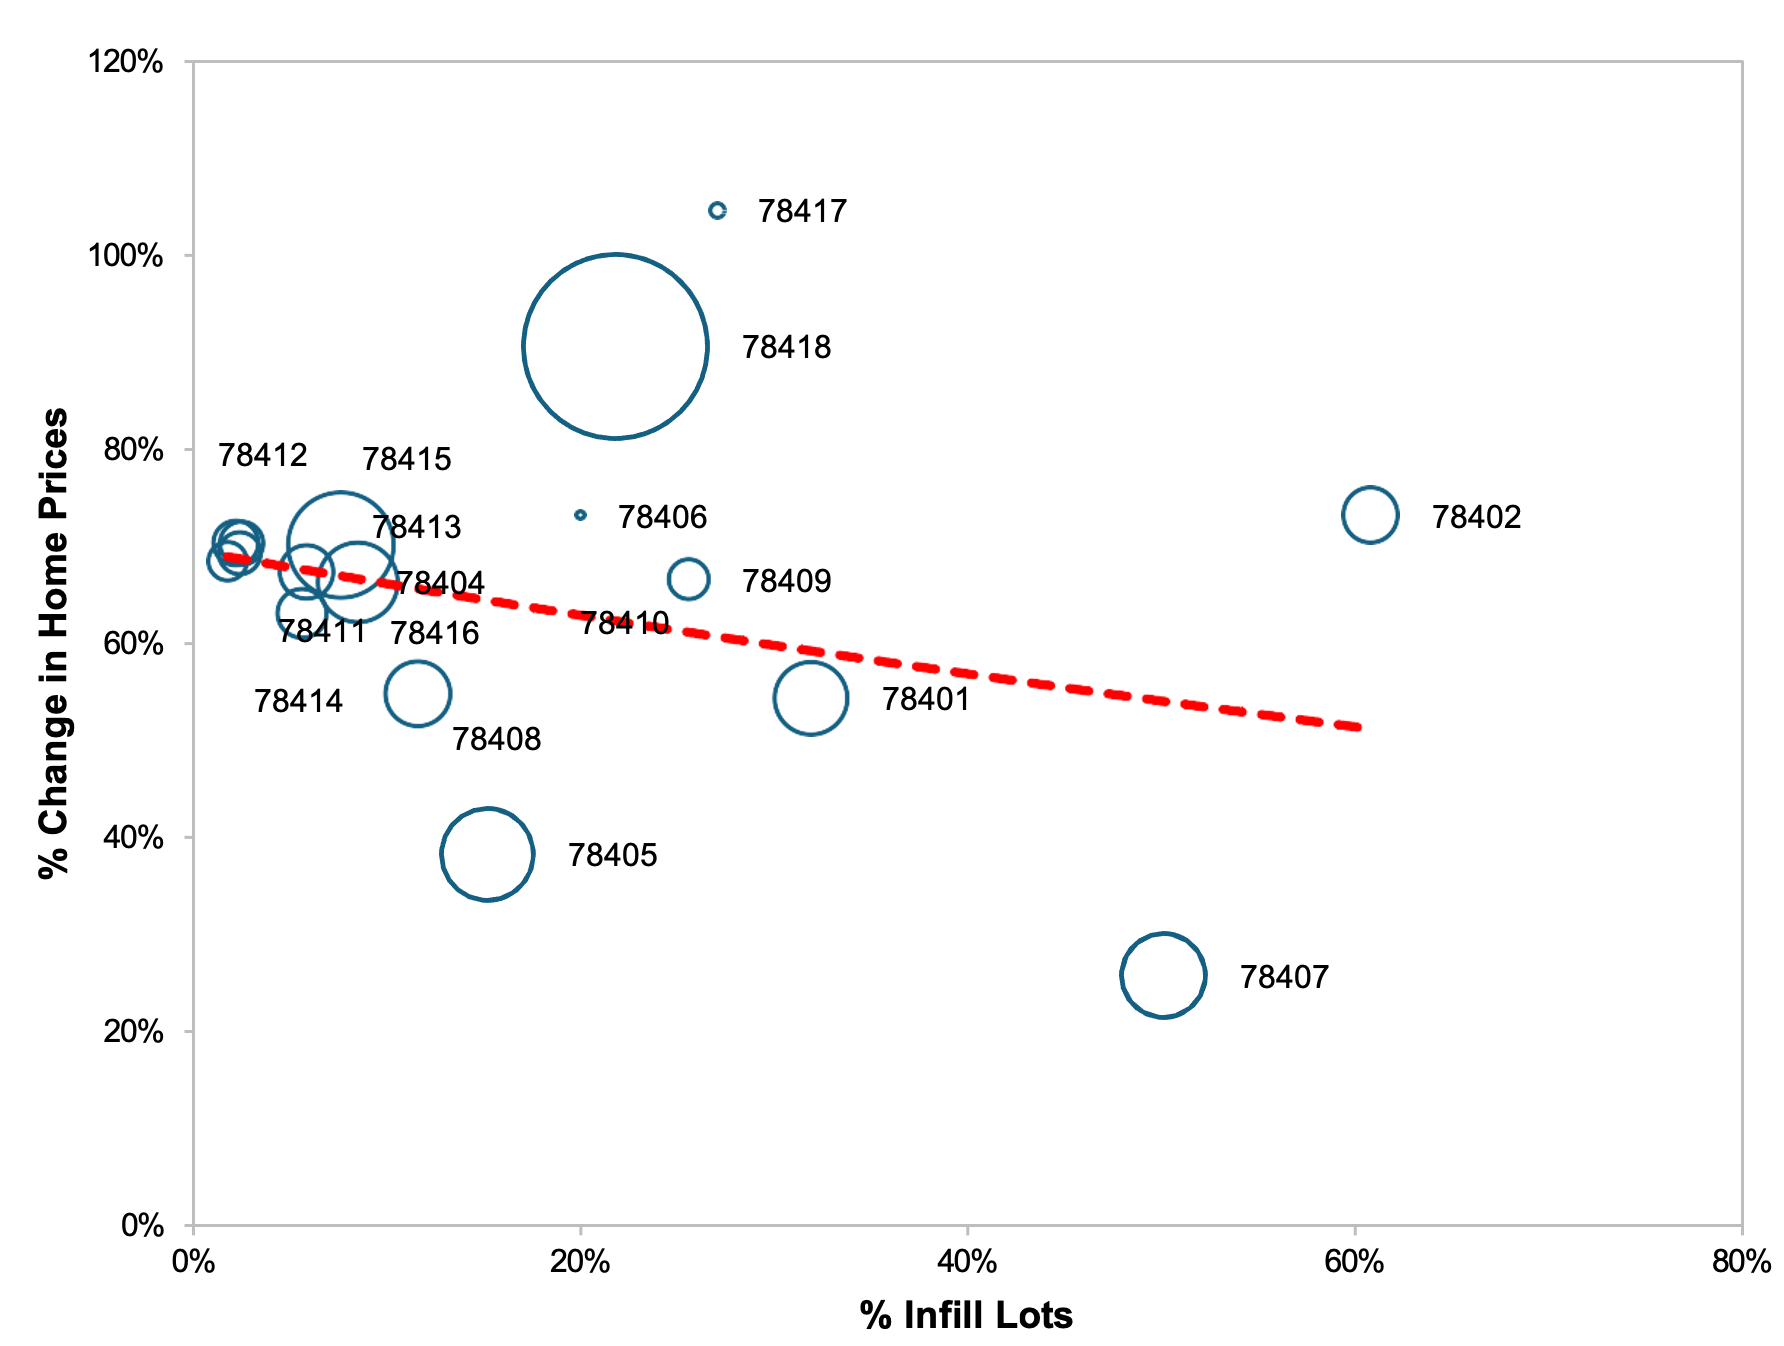 Sources: City of Corpus Christi; Zillow
Note: Larger bubbles represent more land lots.
The negative association between infill lots and home price appreciation presents a problem for local government officials and planners. Struggling communities with relatively lower home prices will continue to be left behind if decisions about housing development are left to private developers.
Change in Public Policy
To reverse course, it will likely take public intervention to ensure an adequate number of infill housing development is built in low-income neighborhoods. The benefit of reducing the cost and burden of commuting to work, especially for the working poor in the city center, warrants a change in policy.
So far, the City of Corpus Christi has made efforts to loosen zoning regulations and revamp affordable housing programs to promote infill development of vacant lots. The City has also offered incentives to attract developers to build housing in the communities that need it the most.
For example, in 2024, City officials provided support for developers to build affordable housing projects in the former Lamar and Lozano Elementary Schools in the Central district. Located in ZIP code 78405, those sites have substantial infill development opportunities.
The City also approved an incentive program to assist with the redevelopment of the Casa Blanco Village apartments from two vacant hotels. Located between IH-37 and Leopard Street, this workforce housing project is in ZIP code 78407 and has the most infill development opportunities in the city.
With continued efforts from policymakers, cooperation from developers, and engagement from local communities, Corpus Christi should be able to maintain this positive momentum.
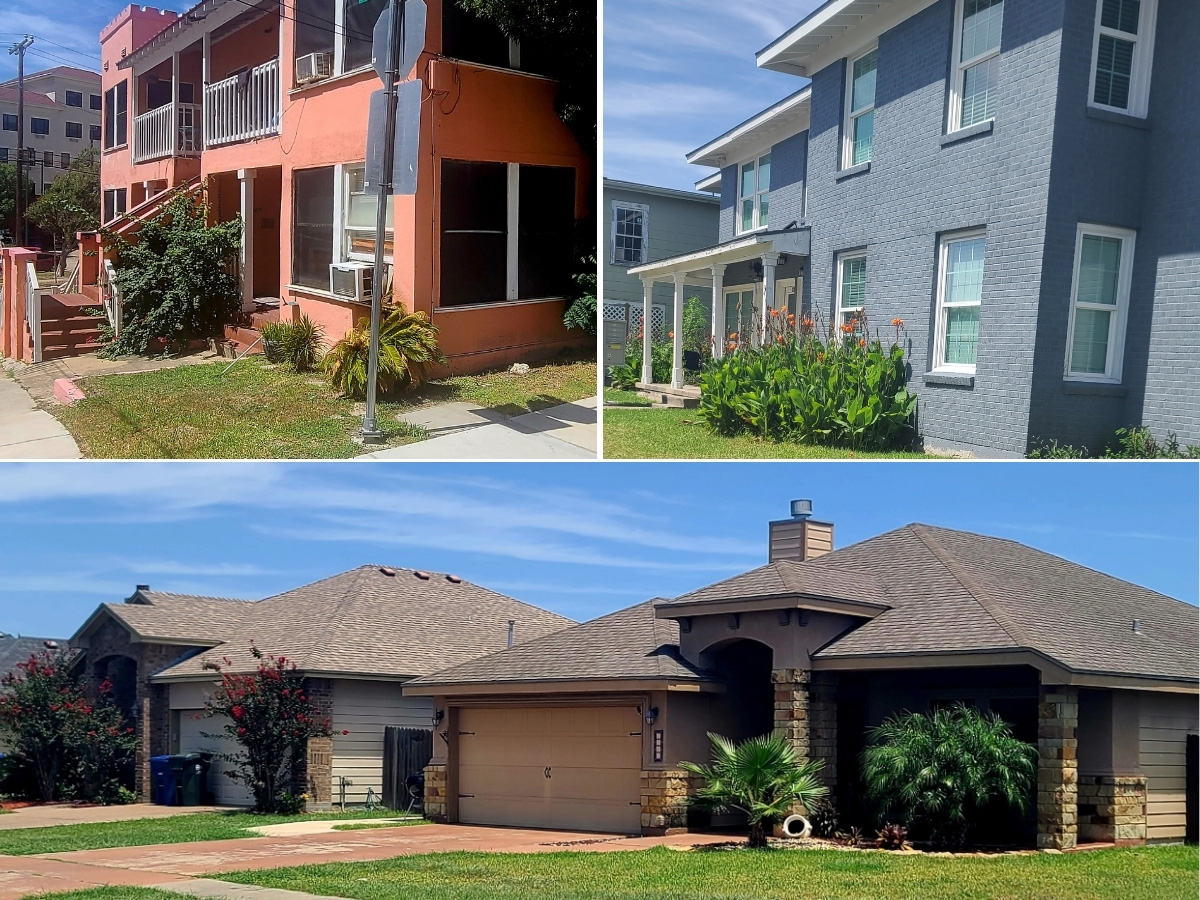
Photos courtesy of Barton Bailey