
The data and insights featured in this article are from a report by Dr. Jim Lee, professor of economics at Texas A&M University-Corpus Christi. The study was commissioned by the Texas Real Estate Research Center.
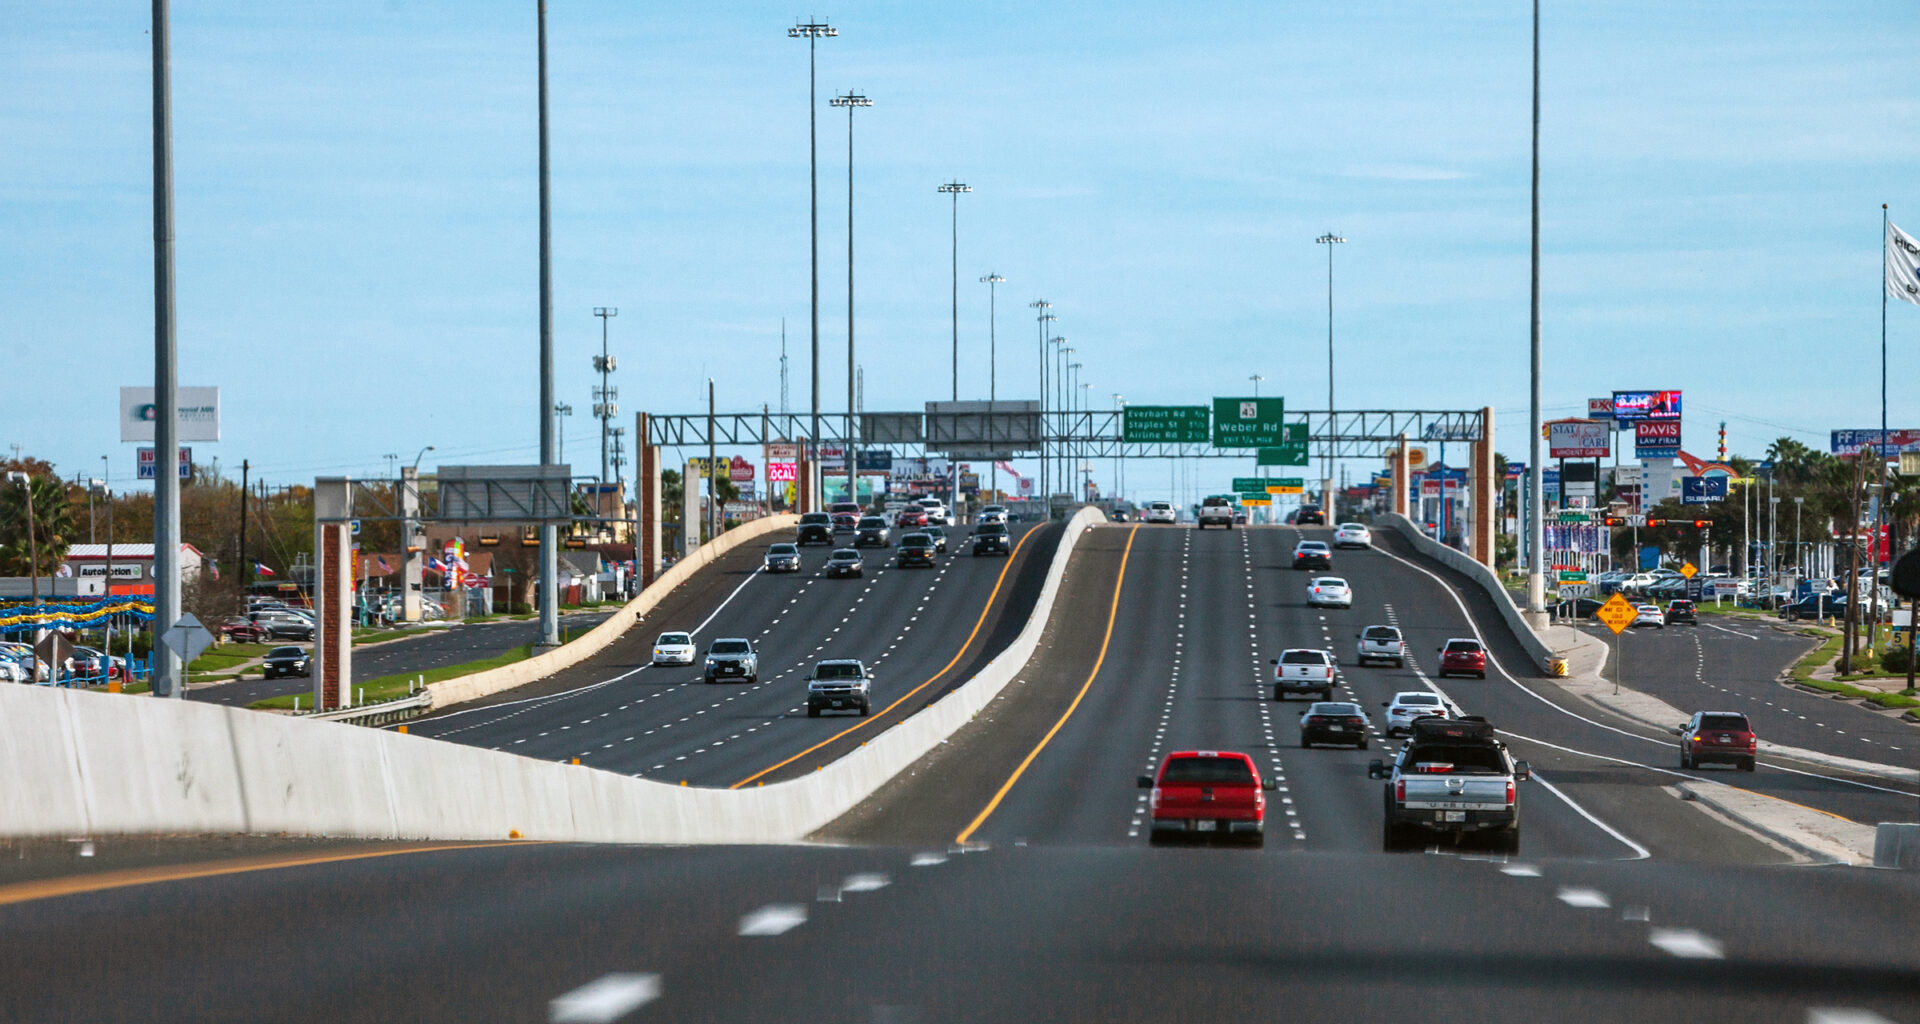
The new Harbor Bridge in Corpus Christi opened earlier this year and at 1,661 feet, it is the largest cable-stayed bridge in the United States.
Not only does the bridge alter the Corpus Christi skyline and improve movement through the shipping channel, but it’s also expected to reduce traffic congestion in the city, an issue that is a growing concern.
While residents in Corpus Christi have a shorter commute time (20.9 minutes) than the national average (26.4 minutes), the distances they’re traveling to reach their employer has been increasing. In 2012, 63 percent of residents traveled less than 10 miles to work. By 2023, 49 percent traveled less than 10 miles, and 27 percent traveled more than 50 miles.
There are three counties in the Corpus Christi Metropolitan Statistical Area (MSA), Aransas, Nueces, and San Patricio. Of those, Aransas County has the highest share of residents who travel both short distances (within 10 miles) and distances longer than 25 miles (Figure 1). The longer distance is due to a large share of Aransas County residents commuting to employers in the City of Corpus Christi in Nueces County.
The shorter commute time in Corpus Christi reflects the ongoing investment in infrastructure, improved roadways, and lower transportation costs in general. However, distances are growing longer due to more new businesses choosing to be in remote areas as opposed to population centers. This has led to a mismatch between where residents live and where their jobs are located.
Figure 1: Distance to Employment Location by County (2023)
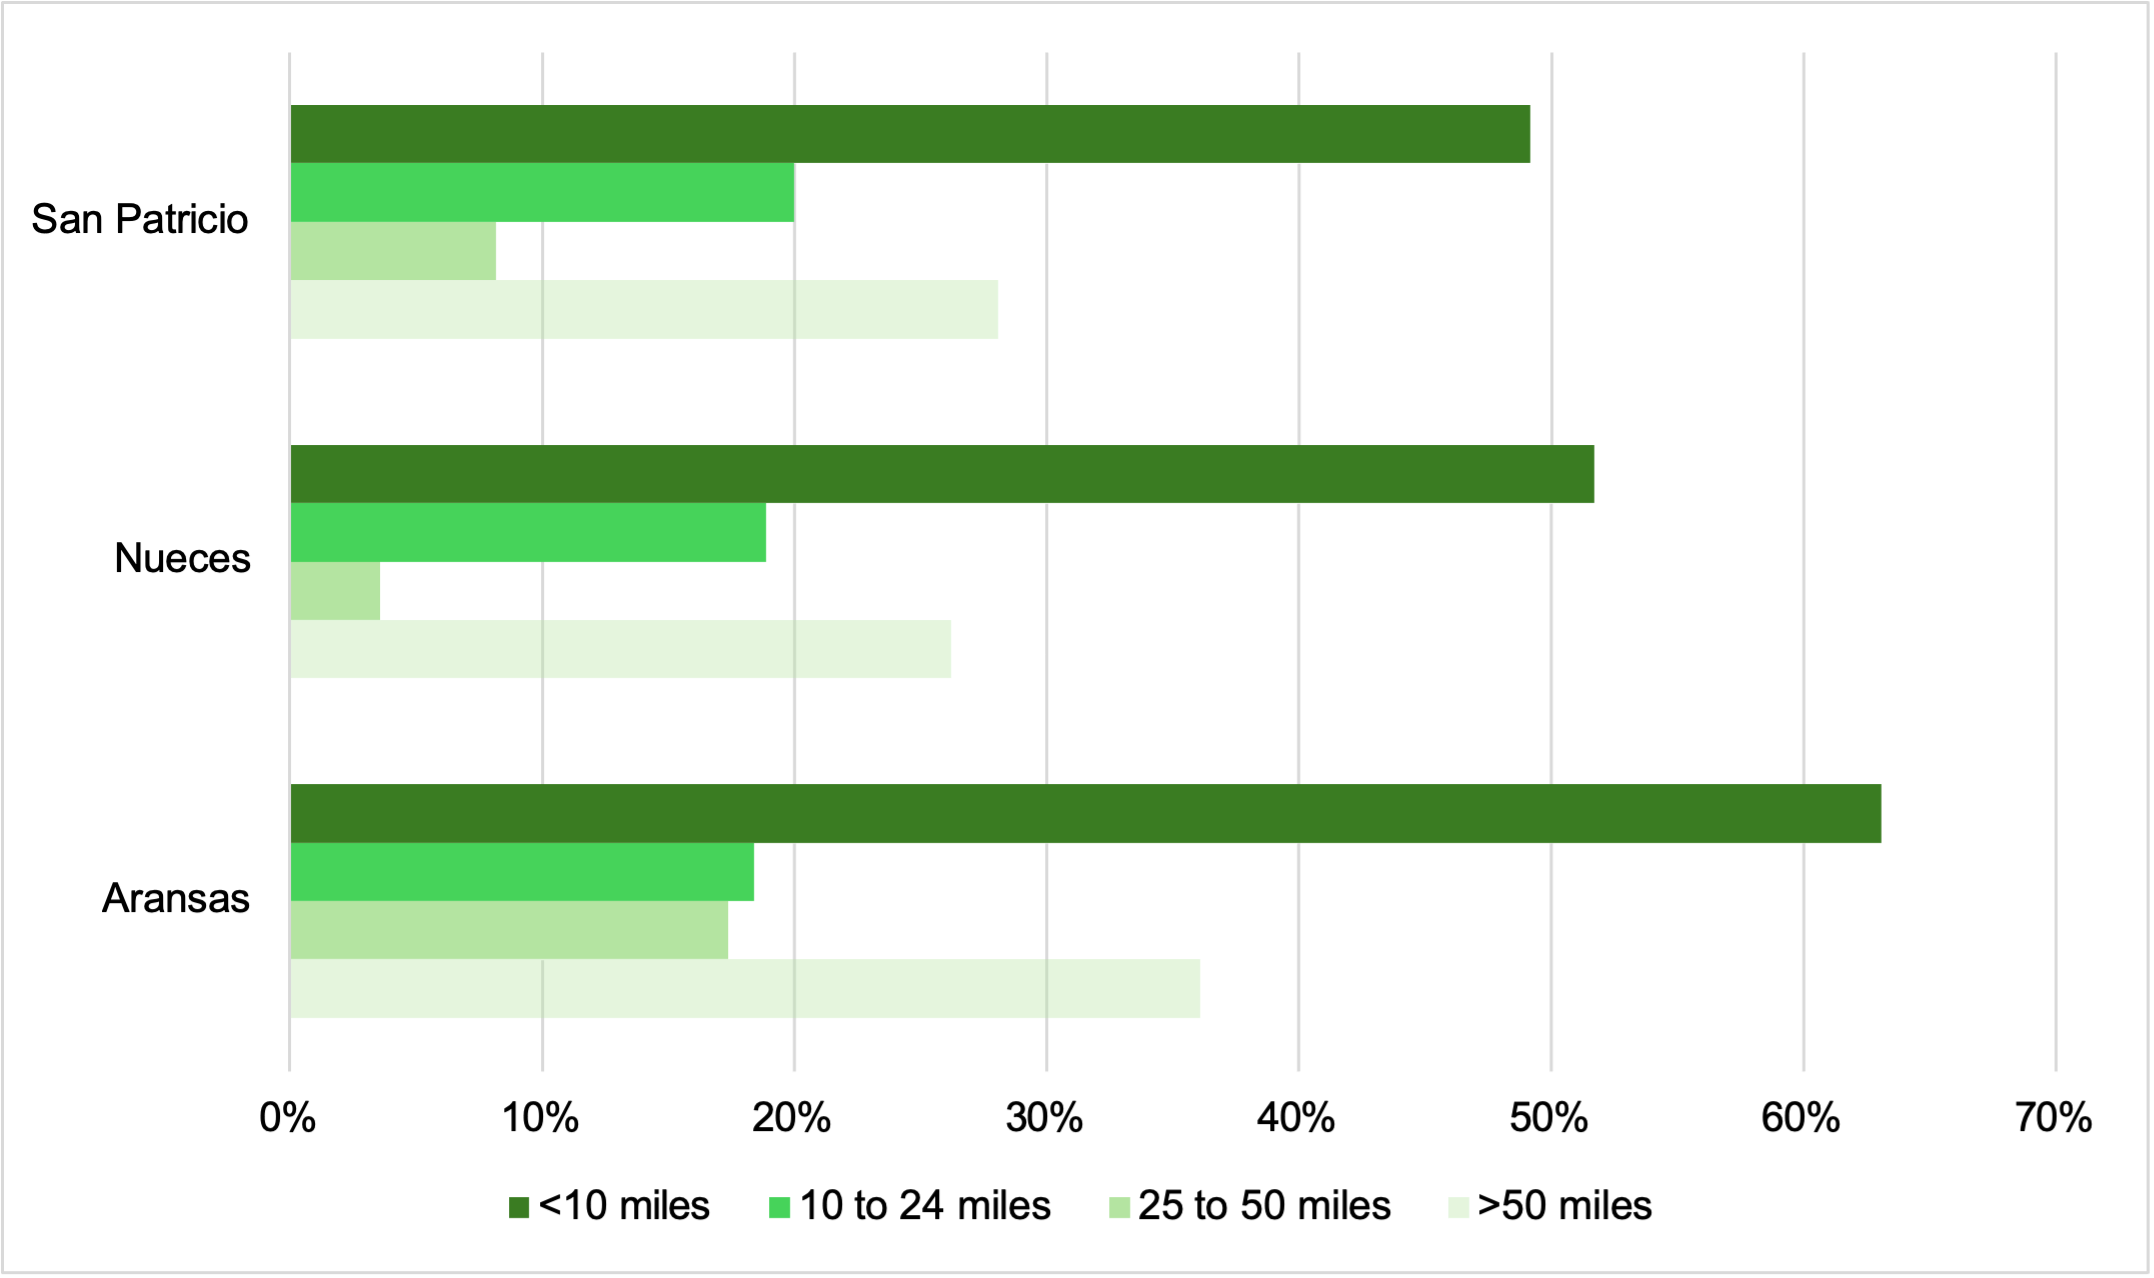 Source: U.S. Census Bureau LODES; LightcastCommuting Flows in Corpus Christi
To better understand commuting patterns across the MSA, it’s important to look deeper than county-level data. Within each county, commuting patterns can vary from neighborhood to neighborhood due to an imbalance between available jobs and number of workers.
Patterns can be identified by examining the net inflow and outflow of commuters by ZIP code area. In the Northwest and Central districts of Corpus Christi, and the coastal communities of Port Aransas and Aransas Pass, the net commuters as a share of resident workers were positive. This means on a typical workday there is more traffic flow among commuters who travel into these areas than those commuting out. In most other ZIP codes, there was a net outflow of commuters to jobs located outside the ZIP code of their residence.
Commuting patterns can also be identified by looking at the eight major employment clusters across the region (Figure 2):
Figure 2: Map of Selected Employment Locations
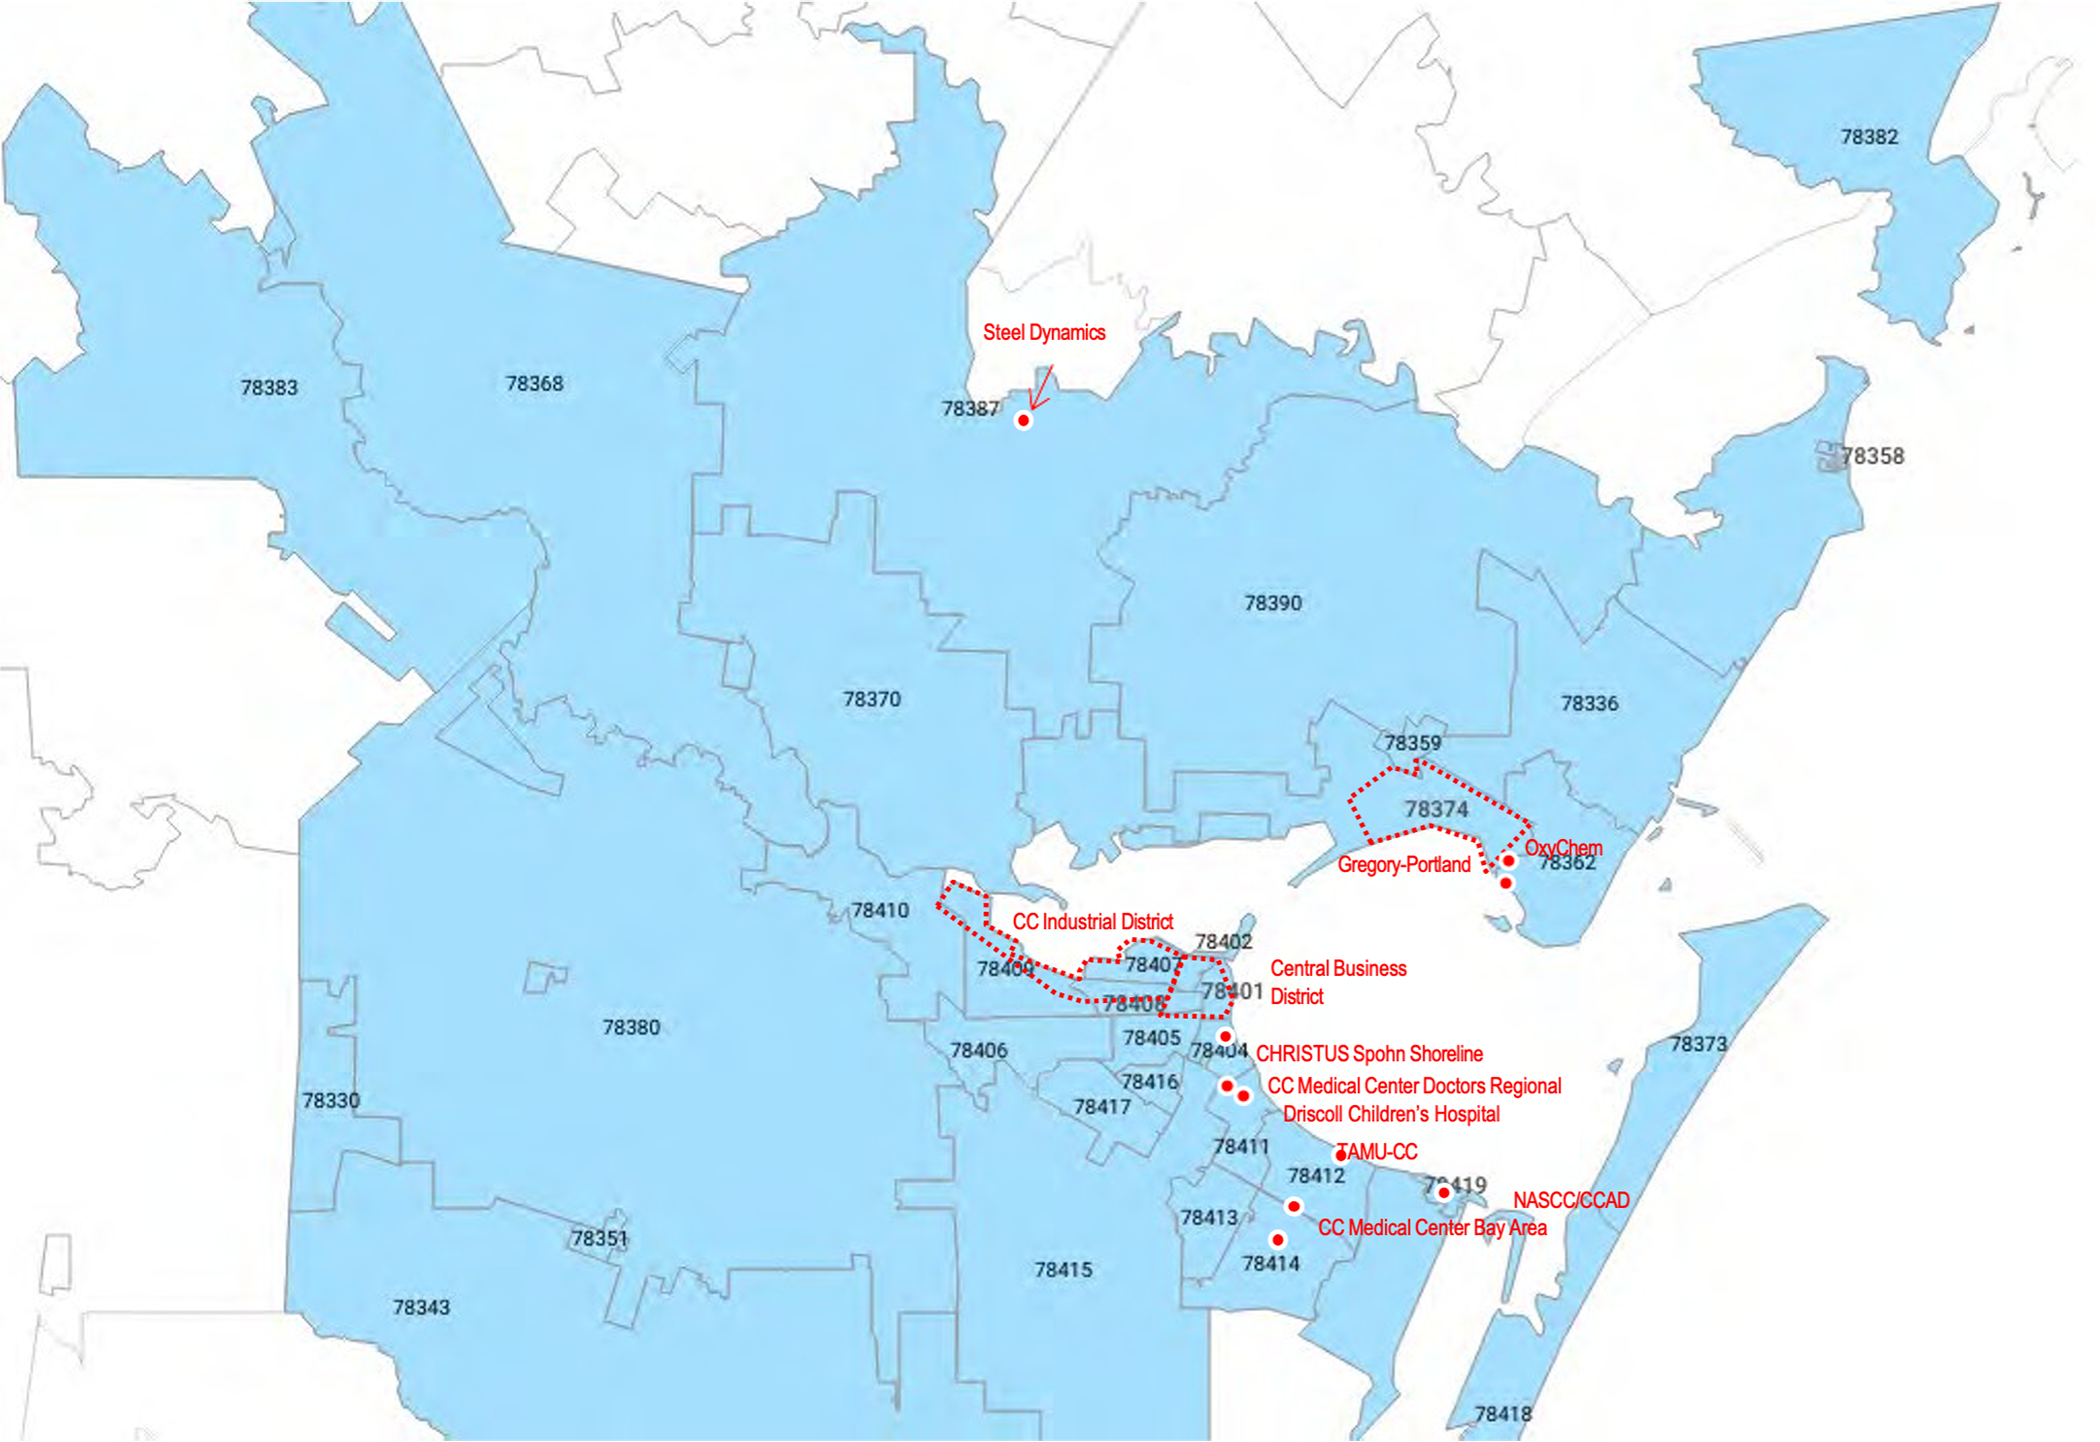
Corpus Christi Industrial District
Home to Refinery Row along the Port of Corpus Christi’s Inner Harbor between Corpus Christi Bay and Nueces Bay, this is the largest industrial district in the city. Oil and petrochemical refineries owned by companies like Citgo, Valero, and Bay Limited combine to employ approximately 3,000 workers, many of whom reside outside those facilities’ ZIP codes 78407 and 78409.
Around 20 percent of workers in the industrial district commute from ZIP code 78410 in Northwest Corpus Christi, which includes Calallen and Annaville. Other workers do not reside in the adjacent and more affordable neighborhoods on the West Side. Instead, 15 percent of workers commute from ZIP code 78414 in the city’s suburban South Side, and approximately 10 percent commute from ZIP code 78415, known as the Deep South area.
Hospitals
The largest health care providers along the Coastal Bend are in Corpus Christi. These include two hospitals of the CHRISTUS Spohn system, Driscoll Children’s Hospital, and two campuses of Corpus Christi Medical Center. Around 11,000 employees work at these facilities, and most of them live within the city of Corpus Christi, particularly ZIP code 78414 (20 percent). ZIP codes 78412, 78413, and 78415 account for roughly 10 percent of the hospital workforce. Compared to other industries in Corpus Christi, relatively fewer hospital employees live outside the city.
Central Business District
Spanning the downtown and uptown areas of Corpus Christi, the Central Business District accounts for more than one in 10 jobs (12 percent) in the city. Business in the downtown region includes hotels, restaurants, engineering and business managements firms. Uptown, you’ll find attorneys, local government agencies, and other service-oriented businesses. Most of the 20,736 workers in the district, located in ZIP code 78401, commute to their job locations from ZIP codes 78414 (11 percent), 78413 (9 percent), 78415 (8 percent), and 78412 (8 percent).
Texas A&M University-Corpus Christi
Approximately 1,500 full-time employees work at Texas A&M University-Corpus Christi. Most employees commute to the main campus from adjacent ZIP codes 78412 (17 percent), 78414 (15 percent), 78413 (9 percent), and 78418 (8 percent).
Military Base
The military base in Flour Bluff is the city’s largest local employer. Along with the U.S. Coast Guard and other military units, the base is home to Naval Air Station Corpus Christi with approximately 5,000 military personnel and civilian contractors, and Corpus Christi Army Depot with an estimated 2,900 employees on site. Many military and civilian employees live in ZIP code 78418 (14 percent). Newly developed residential divisions in ZIP codes 78414 (13 percent), 78413 (6 percent), and 78412 (5 percent) are popular with military base workers as well.
Gregory-Portland Industrial Sites
The Coastal Bend region’s largest industrial hub is the Gregory-Portland community in San Patricio County. The industrial facilities there employ about 1,500 workers onsite with an estimated 6 percent living in the Portland ZIP code of 78374. Nearby, an estimated 3 percent commute from ZIP code 78362 (Ingleside). Workers also commute from the suburban or peripheral areas of the city, such as ZIP codes 78415 (5 percent) and 78414 (4 percent).
Ingleside Industrial Sites
Adjacent to Gregory-Portland are two major industrial sites in Ingleside (ZIP code 78362): Kiewit and OxyChem. Kiewit’s fabrication facility employs more than 2,000 workers onsite, and OxyChem has 222 employees and an additional 150 contractors onsite. Compared to the Gregory-Portland industrial site, most Kiewit and OxyChem employees live within a short driving distance. Ten percent of workers live in the City of Ingleside (ZIP code 78362), 8 percent reside in Portland’s new residential neighborhood (ZIP code 78374), 7 percent in Aransas County (ZIP code 78336), and 5 percent in Rockport and other parts of Aransas County (ZIP code 78362).
Steel Dynamics
Steel Dynamics is the third steel mill built in San Patricio County. Its facility near Sinton has approximately 600 workers, and about one in 10 (10 percent) workers live in the residential neighborhoods in Portland about 15 miles away. The number of workers (7 percent) who commute from ZIP code 78410 also exceeds those living in Sinton and its surrounding communities. Rockport (ZIP code 78382) is home to another 5 percent of Steel Dynamics employees. These percentages underscore the lack of adequate housing development near the industrial site.
Corpus Christi residents are mobile, and the majority have decided to live in neighborhoods that are not necessarily next to their place of work. In Nueces County, the largest residential neighborhoods are Corpus Christi suburbs in the Northwest and South Side regions. In San Patricio County, commuters mostly live in newly developed residential divisions in Portland. In Aransas County, housing developments are more evenly spread comparatively, particularly in the twin cities of Rockport-Fulton.
Examining commuting behavior by industry, we can tell that workers in San Patricio County’s newly built industrial sites live in nearby neighborhoods while workers in the industrial district and Central Business District have longer commutes from suburban neighborhoods.
Travel distance matters to commuters, but where they live matters more. There is a strong preference given to amenities within a neighborhood, such as schools, retail stores, and restaurants. Crime also plays a role. For example, houses in Corpus Christi’s Central and West Side neighborhoods are more affordable, but commuters opt for more affluent neighborhoods in the South Side with lower crime rates.
�
Did you know?
In 2023, 89.1 percent of workers in the Corpus Christi metro area were employed outside the ZIP code areas in which they lived.
Where High- and Low-Wage Workers Live
Looking at the commuting patterns of residents in Corpus Christi by what industry they work in shows evidence of disparities in local housing affordability. However, it’s important to note that even within the same industry or location, not all jobs have the same skill requirements or salaries. For instance, an oil refinery needs not only blue-collar engineers and technicians, but also white-collar administrative staff and office clerks. Depending on their earnings, preference for amenities, family situation, and other factors, their housing needs and commuting behavior are likely very different.
The net commuting flows of different occupations can help illustrate the imbalances between employment and housing needs by ZIP codes. The number of net commuters by occupation is calculated by applying the staffing patterns of different industries to the estimates of commuters in different industries. If there are more resident workers in a particular occupation than there are jobs in that occupation, the number of net commuters is negative as the result of workers commuting out of the ZIP code for work. A positive net commuting value for a ZIP code happens when there is a net inflow of workers from other ZIP codes to that specific ZIP code, which typically has more jobs than resident workers in a specific occupation.
Disparities in local housing needs can be identified by comparing the top three paying occupations against the bottom three in the metro area. The top paying occupations include management, architecture and engineering, and legal, which paid $41, $43.1, and $40.2 in median hourly wages in 2023, respectively.
The ZIP codes with the most net commuters of highest paying occupations are in Central Corpus Christi and San Patricio County, particularly areas dominated by the presence of industrial facilities north of Corpus Christi Bay. The share of net commuter inflows among those highly paid workers is nearly 100 percent for ZIP codes in the Central Corpus Christi district. This means they make up most of the highly paid workers in those communities. For other ZIP code areas, the figure of net commuters is negative, meaning an outflow of workers who travel to other ZIP codes for work.
The same analysis can be applied to the occupations that pay the least. Healthcare support, food preparation, and personal care all paid less than $13 per hour in 2023. Similar to the highest-paying occupations, the number of net commuters was negative in rural areas, indicating a net outflow of workers into other ZIP codes. The largest value of net commuters, or worker inflow, is found in the city of Corpus Christi, particularly ZIP codes 78412 and 78411, where there are more restaurants and healthcare facilities.
When comparing the highest and lowest paying occupations, several trends emerge:
Most rural areas in Corpus Christi experience net commuting outflow of workers in both highest and lowest paying occupations. Portland (ZIP code 78474), and several ZIP codes in the city of Corpus Christi (78402, 78404, 78405, 78406, 78407, 78412) have net commuting inflows of both highest and lowest paying workers.Several areas, notably ZIP codes 78410 and 78408, have a positive net commuting flow of highest paying workers but a negative net commuting flow of lowest paying workers. This means that most of the highest paying workers living in those ZIP codes work elsewhere, but there are more lowest paying jobs than there are workers living in those ZIP codes.How Housing Affordability Impacts Commutes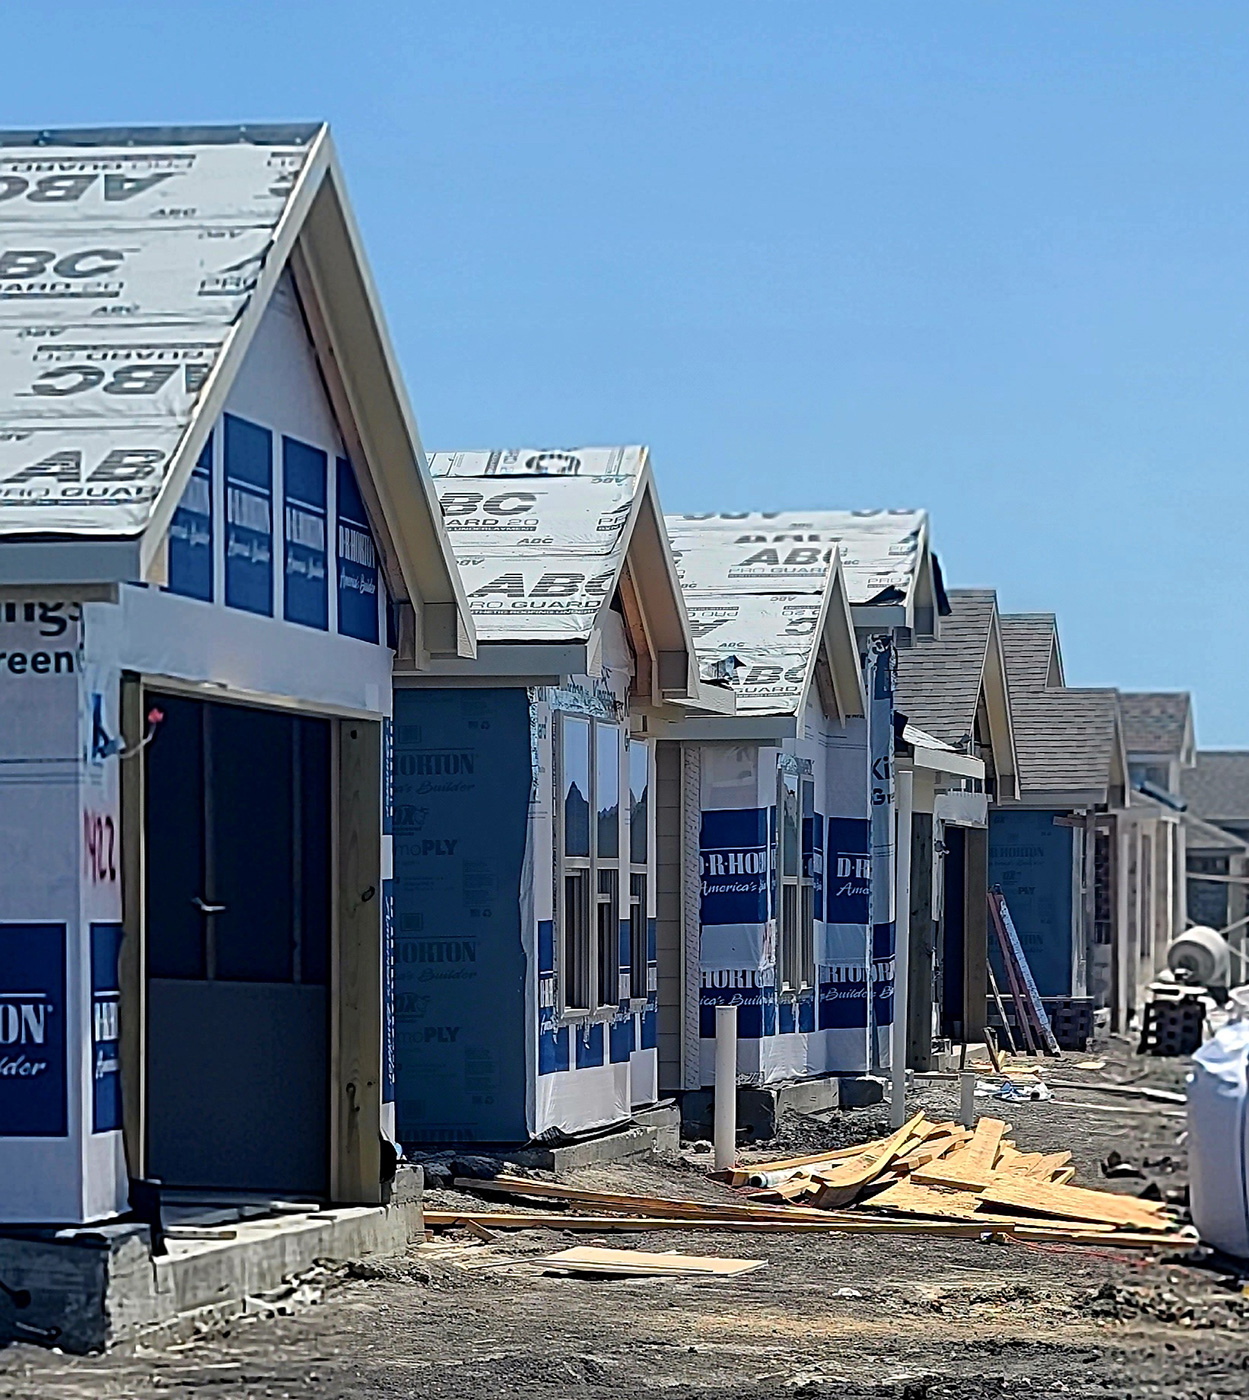 Photo courtesy of Barton Bailey
It’s clear from recent research that spatial mismatches between housing and employment in an area contribute to longer, more expensive commutes and limited access to high-employment areas. This is especially true for racial and ethnic minorities and low-income residents. In Corpus Christi, the imbalance between employment and housing opportunities exacerbates the lack of affordable housing options for low-income workers.
When there is a lack of affordable housing in an area, it reduces the number of available resident workers there. The correlation between the 2023 Home Affordability Index of ZIP code areas in the metro area and the net commuters relative to resident workers is –0.42. This suggests that home affordability explains 42 percent of the variation in net commuter flows across the Corpus Christi metro area. Since the correlation is negative, one can also tell that ZIP codes with relatively fewer affordable homes tend to face a greater inflow of workers from other areas. Areas with relatively high home prices and low home affordability have more low-paying workers commuting to those areas.
How Remote Work Impacts Housing Affordability
One of the outcomes of the COVID-19 pandemic was the increased popularity of remote work. However, the share of remote workers varies greatly depending on industry and occupation. For example, construction and hospitality must be done in person whereas office-related white-collar jobs can be done remotely. Overall, remote work is more common among high-skilled and high-paid workers.
In Corpus Christi, remote work is more popular among rural communities, notably ZIP codes in Aransas and San Patricio Counties with more than 10 percent of the remote workforce. In Nueces County, the share of the remote workforce is 8 percent, which is lower than that in the coastal communities of Port Aransas and North Padre Island.
Examining data from the shares of fully remote workers in different ZIP codes against median home prices in ZIP codes in 2023 reveals a positive relationship, which can be interpreted in multiple ways. The first explanation is that remote work increases housing demand. Remote workers are mobile and, as we saw during the pandemic, many migrated from cities with high cost of living and housing costs to smaller, more affordable cities.
Another interpretation is “reverse causality.” Because remote workers are typically more educated and earn higher incomes, they may be more able to afford more expensive homes than others. This leads to in-person workers being forced out of areas with rising home prices, which results in a larger share of remote workers without the relocation of remote workers into that area. According to research from the Economic Innovation Group, a one-percentage point increase in the share of remote workers in an area is associated with about a two-percentage point increase in the appreciation of local home values between 2019 and 2022. If this causal effect is true for Corpus Christi, it likely means that remote workers played a significant role in driving up home prices along the metro area’s coastal communities.