
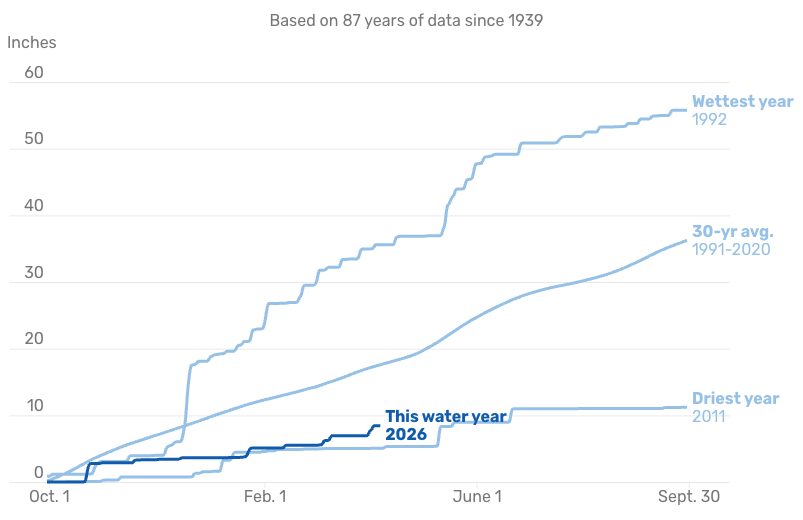
The chart above illustrates precipitation recorded in cities across Texas over water years, tracked from Oct. 1 through Sept. 30. Lines reflect cumulative rainfall totals since the start of the water year. Labels indicate the calendar year at the end of the 12-month period.
The running total for this water year, which began Oct. 1, 2025, is shown in dark blue.
Austin’s wettest water year on record was 1919, when more than 65 inches of rain fell across the city. More than half of that total came between May and July, followed by another notably wet month in October.
The drought also fueled the destructive Bastrop Complex Fire, and triggered a prolonged dry period for Central Texas lakes and streams that came to an end with destructive floods in 2015.
The dropdown menu provides options for tracking precipitation across the state. If you toggle to Houston Intercontinental Airport, you’ll notice that Houston averages more than 50 inches of rain every year. But if you take a look at Midland, average rainfall is generally less than 15 inches.
Precipitation since October for select Texas stations
Tap or click the map for more details on each area. All years apart from the 30-year average are water years, which run from Oct. 1 of the previous year through Sept. 30.
Austin-Camp Mabry’s annual precipitation (inches)
Light blue bars indicate years missing a week or more of data.
Austin-Camp Mabry’s cumulative precipitation (inches)
Source: Applied Climate Information System / NOAA
These charts provide additional context for rainfall that has fallen over the course of this water year. The column chart on the upper right shows the ups and downs of annual precipitation over each location’s period of record. The dark blue line indicates a sliding 5-year average.
The past few years have brought one of Austin’s worst multi-year droughts on record. Central Texas has been in a persistent long-term drought since late 2021, and Austin is currently running a rainfall deficit from normal of about 34 inches — nearly an entire average year’s worth of rain — since the drought began.
Fortunately, the Lower Colorado River Authority’s Highland Lakes, which supply Austin’s drinking water, have partially recovered from low levels, thanks to the July 2025 rain event in the Hill Country. As of April 2026, Lake Buchanan is about 94% full, while Lake Travis is around 74% full, for a combined storage of approximately 83%.
However, the Edwards Aquifer — San Antonio’s primary source of drinking water — still needs significant rainfall in its recharge zone, which includes parts of Austin and the Hill Country. In previous years, summer declines in the aquifer were typically offset by increases in the fall and early winter. In 2025, however, limited rainfall led to a continued drop, and by 2026, aquifer levels had fallen to about 35 feet below the historical average of 660 feet.
Rainfall trends in Austin over the past several decades show a clear cyclical pattern. This seesawing nature of precipitation is evident when looking at five-year averages. Based on that pattern, it’s reasonable to expect rainfall totals to trend upward again over the next several years.
However, there are still uncertainties about how climate change could permanently alter rainfall patterns in Central Texas.
 Get your morning forecast from newsroom meteorologist Mary Wasson.
CreditsReporting by Mary Wasson. Editing by Roberto Villalpando, Caroline Ghisolfi and Danielle Rindler/Hearst DevHub. Design and development by Janie Haseman/Hearst DevHub. Production by Alice Bazerghi.