
Houston prides itself on being an affordable city.
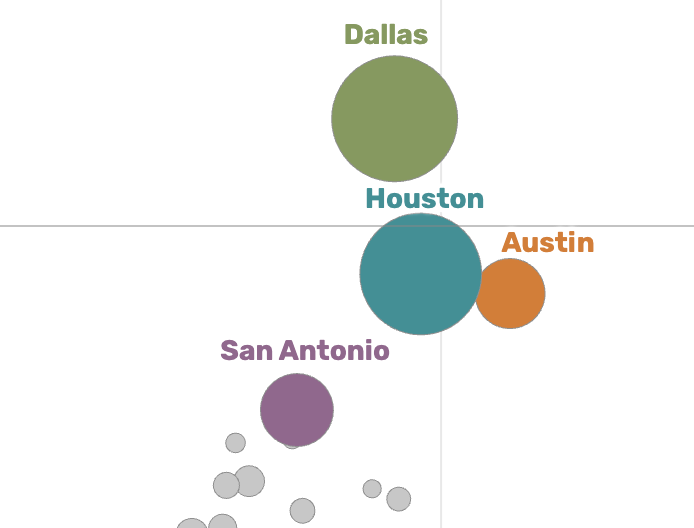
But the average Houstonian’s purchasing power is actually lower than that of the average Austinite, though higher than the average Dallasite’s, according to a Houston Chronicle analysis.
To compare affordability in Texas’ four largest metropolitan areas, the Chronicle used price and personal income data from the Bureau of Economic Analysis to calculate purchasing power for each metro. The data were for 2024, the most recent year available.
Purchasing power takes into account each area’s average income, and its cost of living, to reflect how far an average resident’s income can actually stretch. That metric helps to explain why a salary that feels comfortable in one city could feel challenging to live on in an area with higher prices.
Prices in the Houston and Austin areas, for example, were roughly similar in 2024, coming in just short of the national average. That’s according to BEA regional price parity data for “all items,” a wide-ranging bundle of goods and services that includes food, housing, education and transportation.
But the Austin area felt more affordable for the average resident thanks to the metro’s higher income — $86,000 compared to $77,000 for Houston, according to BEA data. That’s why the average Austinite in 2024 could buy $9,000 more in goods and services that year than the average Houstonian, the analysis shows.
By contrast, prices in the Dallas area were 3% above the national average in 2024, more expensive than in the Houston, Austin and San Antonio areas.
Those higher prices meant Dallas felt less affordable than Houston, even though its average income was slightly higher. The average Dallasite made about $79,000 in 2024 – $1,000 more than the average Houstonian – but her purchasing power was $3,000 less.
Meanwhile, prices in the San Antonio area were much lower than in the other metros — 5% below the national average in 2024.
But San Antonio didn’t feel as affordable as its lower prices would suggest because of its low incomes. The average San Antonio area resident earned $63,000 in 2024, much less than the other three metros. Thanks to the metro’s affordability, that stretched to $67,000 worth of purchasing power, but the area’s low baseline average income meant San Antonio still lagged behind.
What drives income differences
What accounts for the differences in average income between metro areas? One reason is the job mix available in each place.
Austin’s average income is the highest among Texas’ four largest metros which might not be surprising — in recent decades, the city has attracted technology companies that employ highly-paid workers.
“Incomes are definitely higher and have gone up faster in Austin,” Texas A&M economist Daniel Oney told the Houston Chronicle. “It has one of the highest college-educated percentages in the country, so this makes sense.”
Dallas also has plenty of high-income jobs, especially since the city has seen significant growth in sectors like financial services and IT in the last 15 years, he said.
Houston’s job offerings are more of a “mixed bag” in terms of salaries, said Joyce Beebe, a fellow at Rice University’s Baker Institute for Public Policy. Houston’s booming healthcare sector, for example, employs highly-paid doctors but also plenty of lower-paid support staff, she said.
San Antonio’s economy is stable but tends to be lower-paid, Beebe said, with its job mix fueled by tourism and a military base.
How prices factor in
While Austin’s higher incomes might not be a shock, its relatively low prices might be more puzzling.
Austin’s housing prices, a category measured by the BEA, were the highest of the four metros in 2024 at 20% higher than the national average. That’s largely because the influx of high-income workers in recent years drove housing demand, Beebe said.
But its high housing prices were balanced out by lower prices in the BEA’s other three categories: utilities, goods and a miscellaneous category for other services.
By contrast, Houston’s housing prices were about 5% above the national average in 2024 — 12.5% lower than Austin’s. But its higher costs for utilities and goods balanced out its housing edge.
It’s hard to determine precise causes from broad cost categories, Beebe said. But, she said, Houston’s higher utility costs could reflect energy companies’ higher costs in a disaster-prone region.
And Houston’s and Dallas’ higher costs for the goods category — which includes everyday purchases like groceries and clothing — could reflect the higher cost of delivery in larger cities, Beebe said.
What the data can’t capture
Of course, purchasing power is only one way to measure affordability.
Average income doesn’t capture every person’s experience, and it can be skewed by especially high earners. And households’ spending habits are more diverse than one price index can capture; cost-of-living is not a one-size-fits-all measure.
For example, lower-income households often spend a larger portion of their paycheck on essentials, like housing and groceries, than higher-income households do, Oney, the Texas A&M economist, said. That means that inflation at the grocery store, perhaps unnoticed by a wealthy family, could be “an existential crisis for somebody that makes $45,000 a year,” he said.
About the data
Chronicle reporters derived personal income per capita for each metro area from the personal income of the counties that made up that area, according to the Bureau of Economic Analysis.
Per capita income is calculated by dividing the total personal income of an area by its population. Income is then adjusted for the price of goods using the Regional Price Parities index.
The Bureau of Economic Analysis calculates RPP to compare buying power across different regions. RPP is expressed as a percentage of the overall national price level.
CreditsReporting by Maliya Ellis. Reporting and data analysis by Adriana Rezal. Editing by Caroline Ghisolfi and Alan Fossler. Powered by the Hearst Newspapers DevHub.