
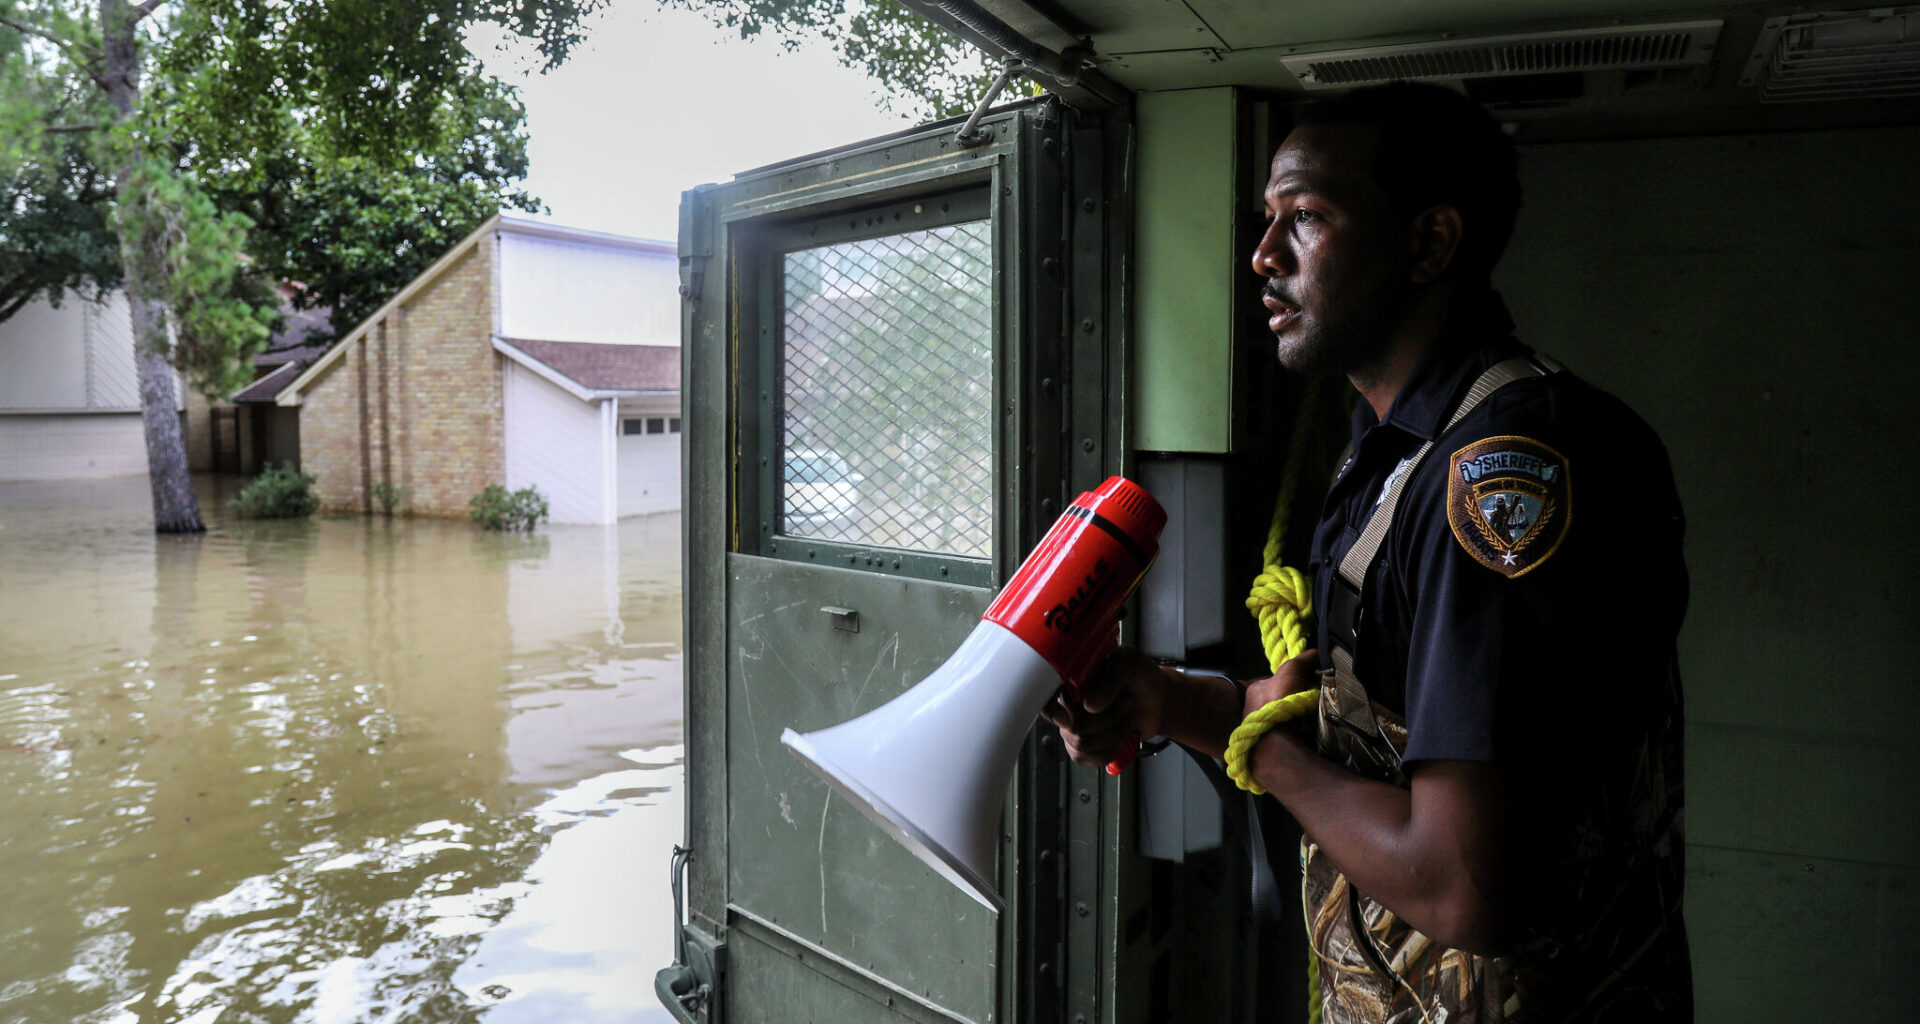
Harris County Sheriff’s Deputy Rick Johnson pauses to listen for people’s voices as they search for people in a neighborhood inundated after Hurricane Harvey by water from the Addicks Reservoir, Wednesday, Aug. 30, 2017, in Houston.
Jon Shapley/Houston Chronicle
When Harris County officials shared drafts of the area’s new FEMA flood maps in February, flood experts said they were long overdue — but could also quickly become outdated.
“We have known for a long time that our 100-year floodplain was in error,” said Jim Blackburn, an environmental lawyer and co-director of Rice University’s SSPEED center. He added that the Houston region has continued to build based on flood maps that haven’t been updated in years.
The maps define high-risk flood zones by putting individual plots into categories: Floodways, 100-year floodplains and 500-year floodplains. Floodplains are defined by whether the areas have at least a 1% or 0.2% chance of flooding each year, and can impact insurance requirements.
Article continues below this ad
But experts such as Blackburn warn that while the new draft flood maps do a better job than previous versions illustrating the area’s current risks, they are poor predictors of the future.
“Even with these expanded maps, they’re still just capturing the tip of the iceberg,” said Jim Elliott, a Rice University sociologist who specializes in flood risk.
SEARCHABLE MAP: Is your Houston home outside of the floodplain? New research says think again.
Elliott explained that the draft FEMA maps rely on Houston-area data from the past few decades, excluding extremes that are difficult to model. This strategy, he said, imagines risk through “a rear view mirror” and leaves out future projections for rapid development and climate change.
Article continues below this ad
“We’re still looking backwards,” he said.
Underestimating flooding is risky at a moment when, for coastal Texas, factors like climate change are “loading the dice in favor of more frequent and severe floods,” said Natural Resources Defense Council environmental attorney Joel Scata.
This tension between what regulatory maps say and Houstonians’ true risk can leave residents with “a false sense of security,” co-director of Rice University’s Center for Coastal Futures and Adaptive Resilience Dominic Boyer said.
Here are key things to know about the new maps – and what they leave out:
Why did FEMA update its floodplain maps?
By law, FEMA is required to review or revise its county-by-county flood maps every five years. In practice, it happens far less frequently. Harris County’s last comprehensive update was in 2007.
Article continues below this ad
Since then, local authorities have realized how poorly the 2007 maps reflected rapidly-changing flood risk in the area. Over just three years, from 2015 to 2017, the region had three 500-year storms, culminating in Hurricane Harvey.
According to the Harris County Flood Control District, the pattern of extreme weather made it “clear that existing floodplain maps were not fully reflecting flood risk,” and the county started working with the federal government to design new maps.
What do the draft FEMA maps tell me about my flood potential?
The updated maps from FEMA, once enacted, will impact households by requiring many more Houstonians to buy flood insurance. But researchers and local officials have said for years that the maps should not be necessary to prompt coverage; rather, everyone in Harris County should have flood insurance.
Once finalized, the FEMA maps can also be used as a basis for building codes, and were originally designed to dissuade people from developing or living in the county’s most-risky plots. Instead, experts say, they are often looked at through the lens of financial harm.
Article continues below this ad
“People assess the risk more as a risk of their insurance premiums going up than as a risk of actually flooding,” Elliot said.
What is different about the maps this time?
In a June public session on the FEMA update process, the flood control district’s Planning Division Director, Ataul Hannan, said the newly drafted maps “go way past just a routine update.”
“The most significant driver of this study is that rainfall amounts are also increasing,” Hannan said.
Officials included new federal data that indicates a 30% increase in rainfall. The draft maps also incorporate nuanced topographic data and account for the benefits of new flood control infrastructure.
Article continues below this ad
INSURANCE COSTS: How much does FEMA flood insurance cost in your Houston neighborhood? Search our map to find out.
But Houston-area experts have cautioned that other factors, including future impacts from the changing climate, were not reflected in the maps.
Why don’t FEMA flood maps consider climate change?
FEMA is required to create regulatory maps based on the rainfall and storm data from the past several decades, using this historical information to predict the statistical likelihood of future outcomes. Increasingly, climate researchers are arguing that the world is changing too quickly for these techniques.
“Climate change is suggesting that the models of the past and the data of the past are mostly inadequate,” Rice’s Elliott said. “That backward casting isn’t working as effectively as it used to.”
EXCLUSIVE: FEMA maps may be missing over 200K high-flood-risk Harris County properties, study shows
The global Intergovernmental Panel on Climate Change has released comprehensive reports showing that already climate change “has detectably influenced” multiple contributing factors that cause flooding.
Three potential impacts on coastal Texas include the role that atmospheric warming triggered by greenhouse gas accumulation has played in rainfall intensity, hurricane frequency and sea-level rise. Still, these are not the only reasons Texas flood maps get quickly outdated.
What else do the maps leave out?
FEMA flood maps’ use of historical data leaves another major gap: As development explodes across the region and more of the naturally-absorbent prairie grasses and riverbanks get paved over, nearly everyone’s likelihood of flooding goes up.
The map data includes the impacts of past development, but does not consider future projects. And those are likely to be significant.
“Right now, the biggest changing driver of risk is the development of communities, not necessarily the environmental conditions,” said Sam Brody, director of the Institute for a Disaster Resilient Texas at Texas A&M University.
The FEMA analysis is also built around flood incidents for which we have enough data to determine statistical probability. They do not include all areas that could be impacted by what researchers refer to as “worst credible floods,” such as the Tax Day flood in 2016 or Harvey in 2017.