
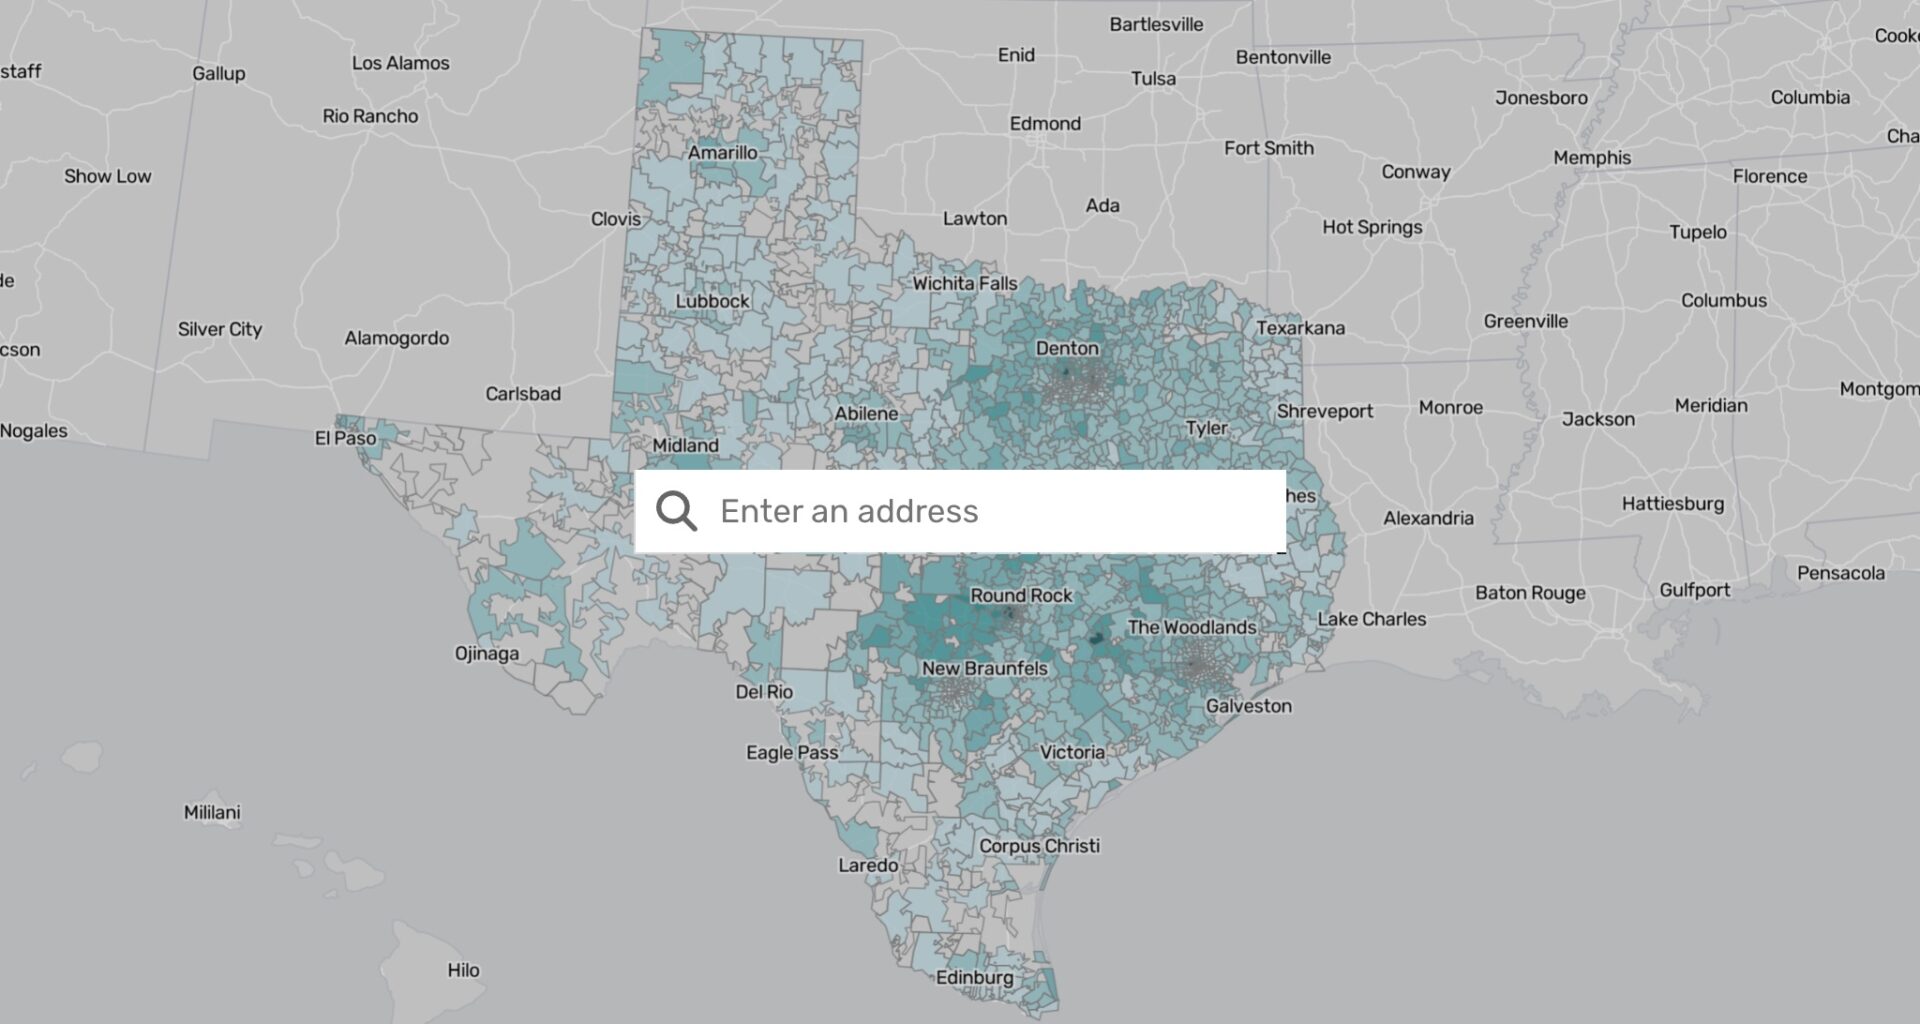
How much is a home worth in your corner of Austin? And how much are buyers actually paying compared with the rest of Texas?
The Austin American-Statesman’s home value tracker puts those answers in one place, allowing buyers, sellers and curious homeowners to compare home values, sale prices and other measures of the housing market across ZIP codes and metro areas statewide.
The latest numbers reveal some striking differences, even in neighboring cities.
ZIP code 78746, which includes West Lake Hills and parts of Austin west of downtown, has the highest typical home value of any ZIP code in Texas at $1.73 million, according to Zillow data used in the tracker. But that figure hardly represents the broader Austin area, where home prices have retreated considerably from their pandemic-era highs.
By mid-2025, the median home price in the Austin area had fallen 22% from its pandemic-era peak, a steeper decline than in Dallas-Fort Worth, Houston and San Antonio, according to the Texas Real Estate Research Center at Texas A&M University. Even after that correction, however, Austin-area prices remained 23% higher than in 2020.
The slide isn’t over yet. Vaïke O’Grady, market research advisor for Unlock MLS and ABoR, projected in September that the median sale price across the Austin-Round Rock-San Marcos metro area would land between $410,000 and $420,000 by the end of 2026. That’s down from $435,000 in July and from its 2022 peak of $525,000.
Further south along the Interstate 35 corridor, San Antonio offers a comparatively affordable housing market. Home values there generally trail those in Austin and the state’s other metropolitan areas.
Some of Texas’ priciest real estate, however, lies well beyond its major cities.
Take Round Top, a small Fayette County community of around 100 people, nestled between Austin and Houston. In ZIP code 78954, the typical home value topped $1.1 million in August, while the median sale price was even higher at $1.25 million, according to Zillow. That’s more than twice the typical value across Fayette County and nearly four times the statewide figure.
Whether you’re seeking to buy or sell a home in the Austin area, the Austin American-Statesman real estate tracker can help you understand and navigate the housing market here and across Texas.
The map above shows which ZIP codes have the highest home values, current sales prices and largest sale-to-list ratios. Clicking on a particular ZIP code will show you whether these values are increasing or decreasing. You can also peruse neighborhoods in other cities to see how prices compare in places like Houston or Dallas.
What do each of these housing market values mean for potential buyers and sellers?
Median sale price in Texas metro areasHover over the chart to see monthly values
Chart: Alejandra Arevalo/DevHub • Source: Redfin
First, let’s look at prices. This data comes from real estate company Redfin and reflects the median price of homes that have sold during the given month.
For buyers, monthly sales data can help you understand how much you might expect to pay right now for a home in a given ZIP code. For those wondering which areas of the state are the most affordable, exploring sales at the metro level may also prove beneficial.
For sellers, this data can help you understand how much homes in your area are currently selling for and whether that value is historically high or low for the area as you figure out a listing price for your home.
Average home value in Texas metro areasHover over the chart to see monthly values
Chart: Alejandra Arevalo/DevHub • Source: Zillow
Now let’s consider home values. This measure may seem strikingly similar to price, but the two actually measure different things.
The data for home values comes from real estate company Zillow and harnesses the power of the company’s property-level “Zestimates.” Zestimates factor in past sale amounts as well as tax assessments, square footage and location to assess a home’s value.
Zillow aggregates these estimates for both on- and off-market homes to generate values at the metro and ZIP code levels. In order to look at the “typical” home in an area, only homes priced between the 35th and 65th percentile in a market are used.
Unlike Redfin’s home sale prices, Zillow’s home values are seasonally adjusted. The adjustments smooth out the differences between increases that happen during the spring and summer seasons, when the housing market is at its most competitive, and decreases during the slow winter months.
For buyers, home values are a way to explore the general quality of homes in an area rather than just considering what homes happen to be selling for right now. Tracking these values over time can help you understand how fast or slow the housing stock in a given area is changing compared to other places.
For sellers, home values can give you a sense of what the typical home in your area is worth and which neighborhoods in your city might be similarly affordable if you’re planning to buy another home.
Median days on market in Texas metro areasHover over the chart to see monthly values
Chart: Alejandra Arevalo/DevHub • Source: Redfin
This data also provides a picture of the shifting housing market.
During the pandemic, buyers rushed to take advantage of historically low mortgage rates and sellers watched offers rapidly roll in. Some eager buyers submitted offers sight unseen just to secure a home in the fast-paced environment.
The market has slowed over the past two years as rates and prices have risen, putting homeownership out of reach for more families. Those who can afford to purchase a home have more time to make a decision and more options to choose from as inventory expands.
For buyers, the days on market metric provides an estimate of how much time you’ll have to consider your options before making an offer.
For sellers, it’s a way to get a sense of how hot the market is in your area. If you’re looking to buy elsewhere, median days on market can also indicate whether homes in your desired neighborhood are moving faster or slower than in your current neighborhood.
About this data
The data for home values comes from real estate company Zillow, whose estimates factor in past sale amounts as well as tax assessments, square footage and location to assess a home’s value.
Zillow aggregates these estimates for both on- and off-market homes to generate values at the metro and ZIP code levels. In order to look at the “typical” home in an area, only homes priced between the 35th and 65th percentile in a market are used.
Unlike Redfin’s home sale prices, Zillow’s home values are seasonally adjusted. The adjustments smooth out the differences between increases that happen during the spring and summer seasons, when the housing market is at its most competitive, and decreases during the slow winter months.
 Start your day with the stories you need to know from Austin’s most trusted news source.