
Major weather headlines this year included the fires in Sinton and Gregory, baseball-sized hail, and a destructive thunderstorm that produced Category 3-force winds.
It was a busy year of weather. Some major weather headlines this year were the fires in Sinton and Gregory, multiple occurrences of baseball-sized hail, and a destructive thunderstorm that produced Category 3-force wind gusts. We’ll get to those shortly, but first, let’s see how this year stacked up overall.
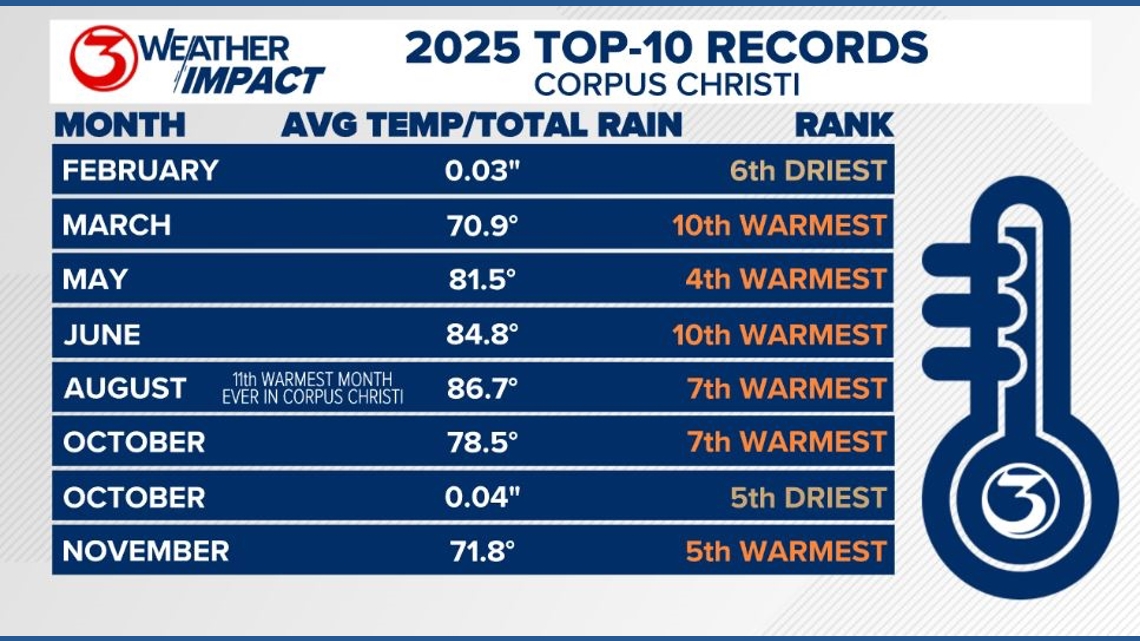
This year, seven months made it into their respective months’ top-ten records. Six of those were for having some of the warmest average temperatures, and two of those were also for rain-related top-tens. With only a few hundredths of an inch of rain, February and October were the sixth and fifth driest on record, respectively. We set no first-place monthly records this year.
August was the seventh warmest on record, and it was also the eleventh warmest month ever in Corpus Christi.
Note: All temperatures, rainfall totals, and other climate variables in this article are all from observations at the Corpus Christi International Airport.

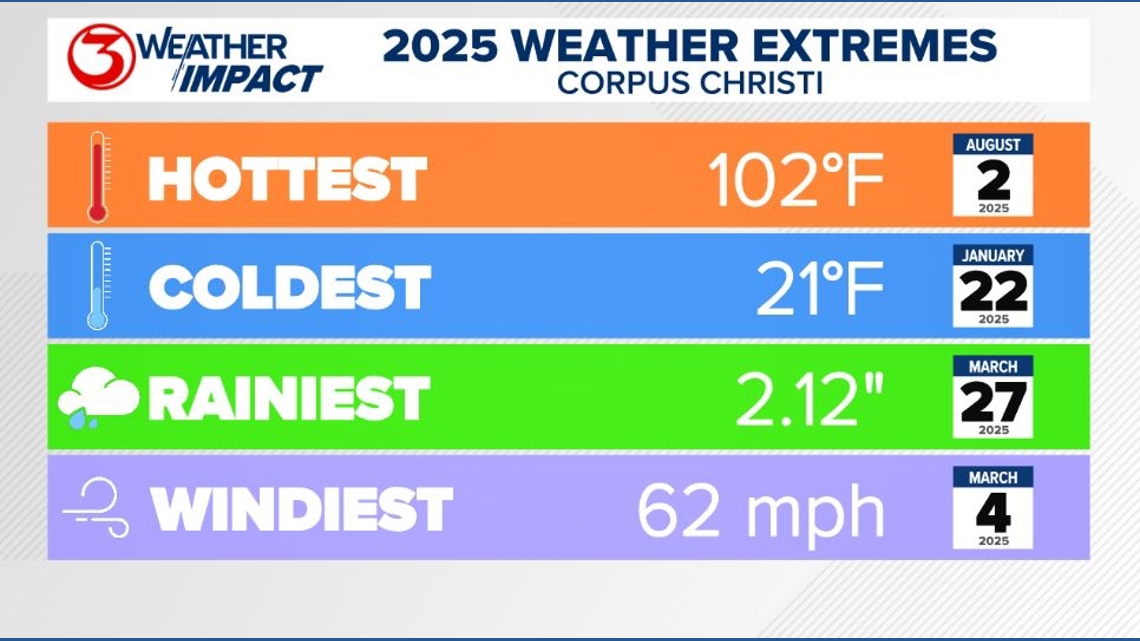
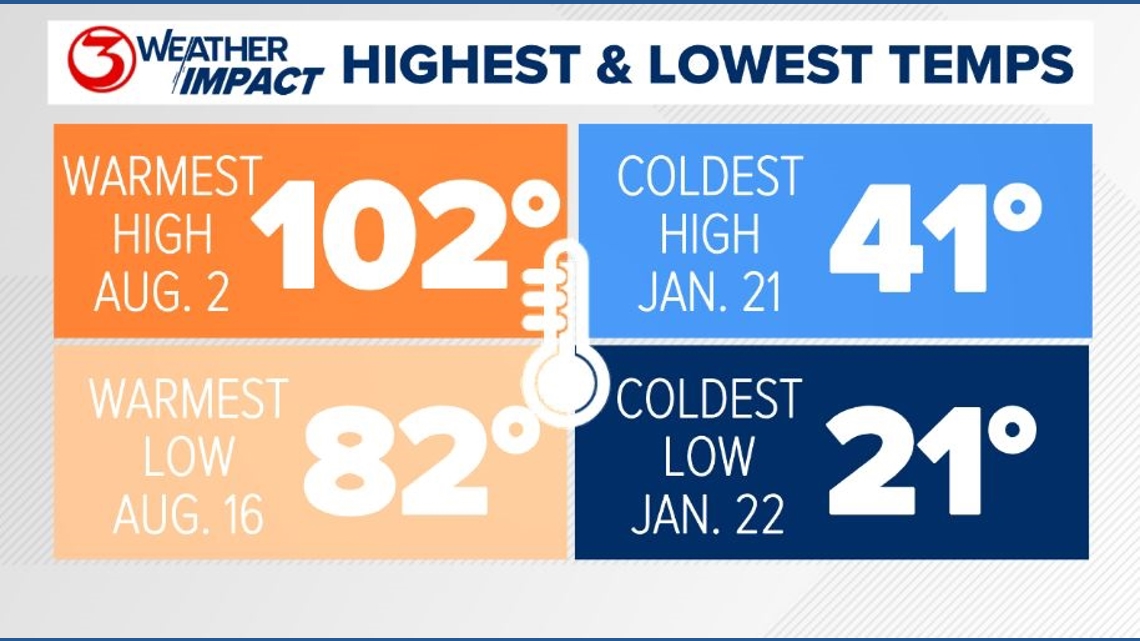
Like last year, our hottest temperature of 2025 came in August. Our afternoon high soared to 102°F on August 2. Our coldest temperature this year was 21°F on January 22.
Unlike the last two years, our rainiest day did not come from a tropical storm. Heavy rains dropped 2.12″ of rain at the Corpus Christi International Airport on March 27, which was the only day this year to measure more than 2″.
While some places in the Coastal Bend experienced 100+ mph wind gusts on May 8, the strongest wind gust observed in Corpus Christi this year was 62 mph on March 4.
We also saw two wake lows on March 27 and May 8 (behind the storm that produced 100+ mph gusts). Wake lows are nearly impossible to predict, and can produce winds that rival straight-line winds in severe thunderstorms.

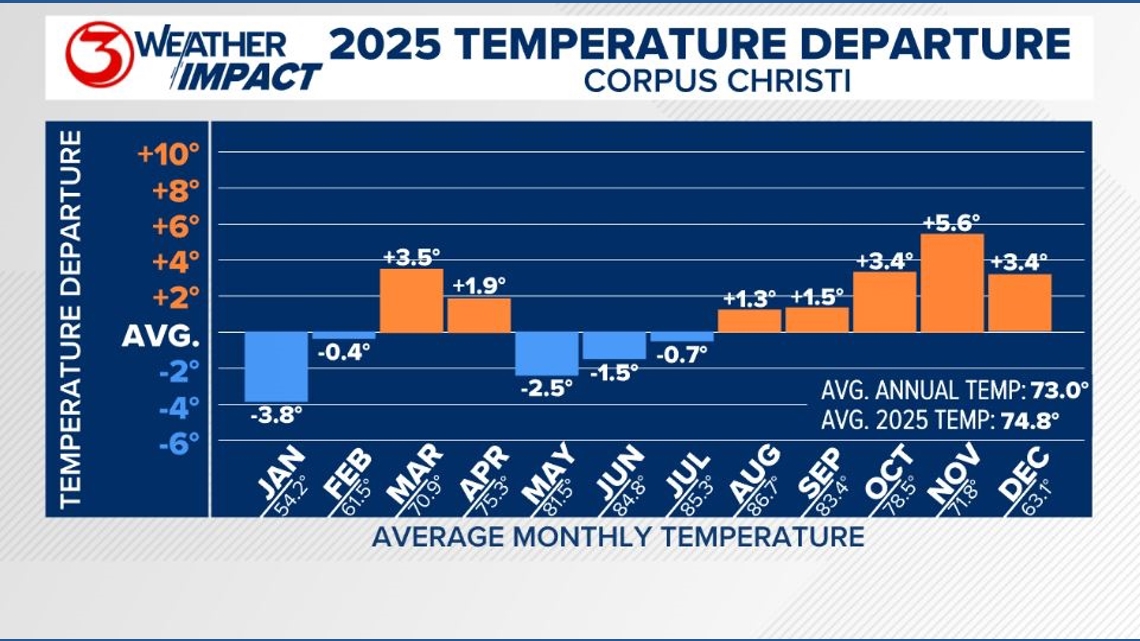
At the end of 2024, we finished with an average temperature of 75.8°F, tying 2012 as the hottest year on record. This year our average annual temperature was 74.8°F, going down as the fifth-warmest year on record. This marks the third consecutive year that the average annual temperature has placed in the Top 5 warmest years on record.
Our average annual temperature based on 1991-2020 climatology is 73.0°F.

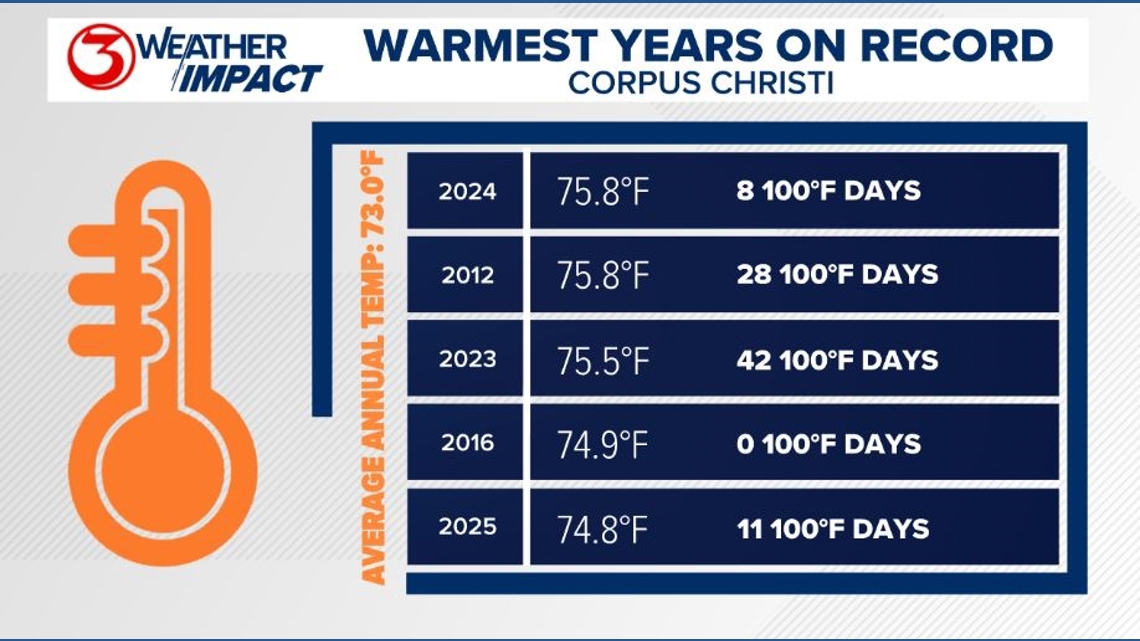
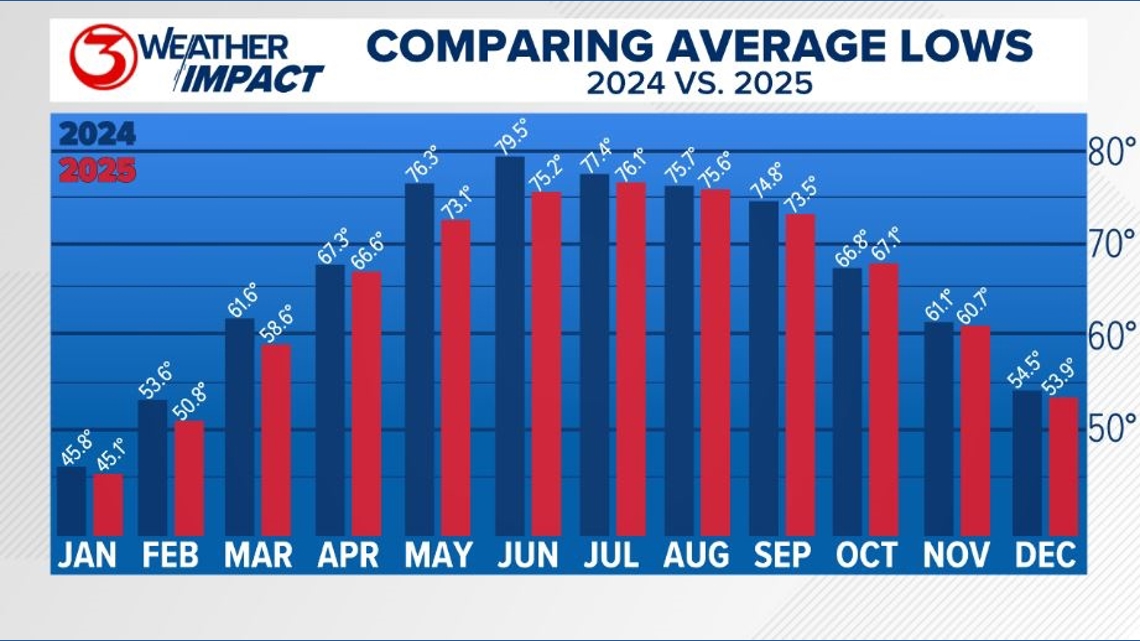
Even though we saw three more 100-degree days this year, the lower humidity levels (and therefore lower morning temperatures) led to our average annual temperature falling below last year’s. The only month that saw a warmer average low temperature in 2025 than in 2024 was October.

Seven months were above-normal in their average monthly temperature and five were below-normal, which includes both highs and lows. Last year, January was the singular month that was below-normal. This year’s coldest month was again January, and the warmest was August.
November was again the most above-normal by a decent margin. It ended over five degrees above normal.

This year, we set 34 total temperature records. For perspective, last year we set 34 warmest minimum temperature records alone.
Overall, we set 16 new highest maximum temperature records, with May and October each contributing four to the tally. May set the most records this year (eight). Of the 16 new high temperature records, only one of them came from a temperature over 100°F.

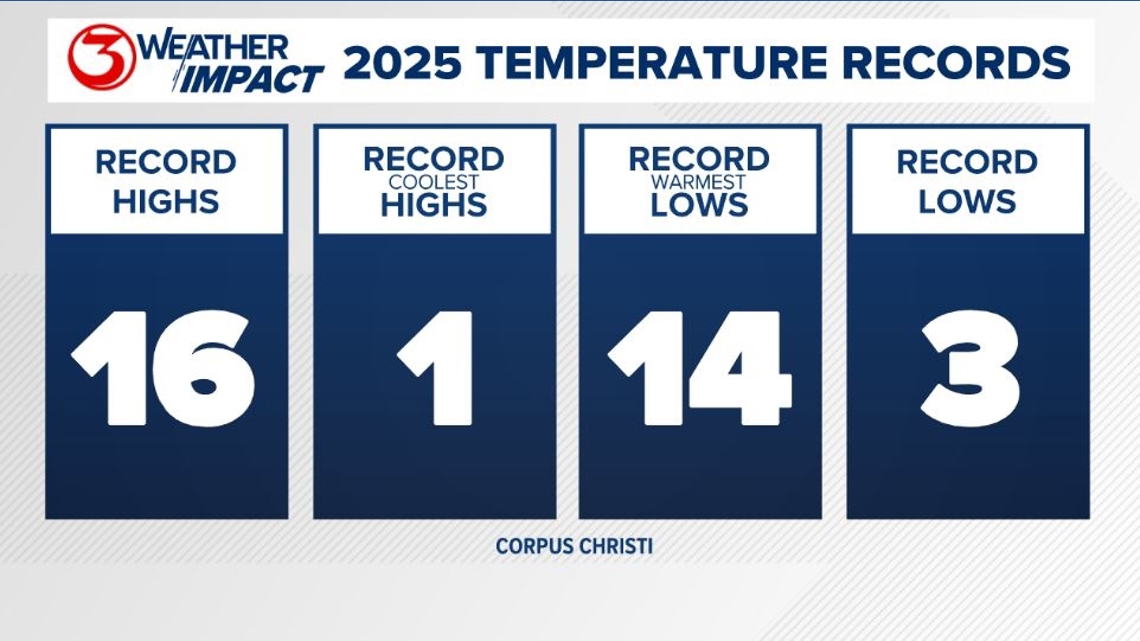
While we weren’t quite as humid or hot as last year, we still saw some decently high temperatures. We experienced 14 morning lows in the 80s from May through August, with the warmest morning being 82°F on August 16.
This year, our temperatures ranged rom a high of 102°F to a low of 21°F, an 81°F variation – the same as last year.

On the day before our coldest temperature, we saw trace amounts of snow and ice across the Coastal Bend. Some locations saw morning lows dip into the teens.
We saw a grand total of five freezes in Corpus Christi this year: January 21, 22, 24 and February 19 and 20.
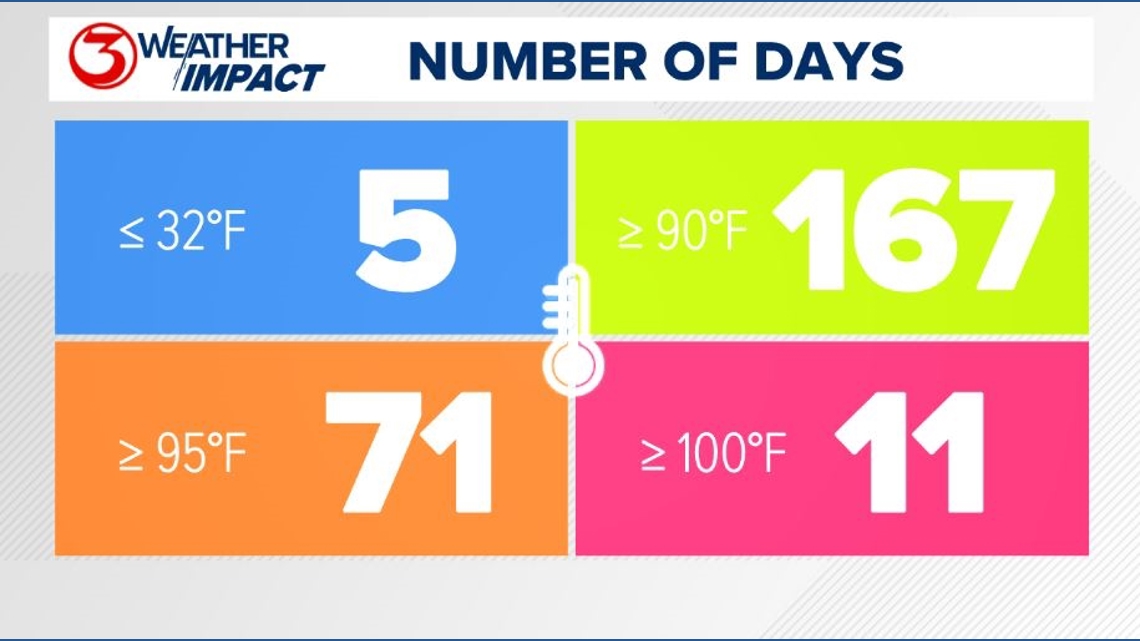
The past two summers have gradually toned down from what we saw in 2023, but it was still hot this year. Putting numbers to it helps emphasizes that. Out of 365 days, this year we reached:
• 32°F or below – 5 days
• 90°F or above – 167 days
• 95°F or above – 71 days
• 100°F or above – 11 days
That means about 46% of the year (approximately 5.5 months), our high temperature was above 90°F, and 19% of the year (about 2.3 months), our temperatures got to 95°F. Compared to last year, we spent a nearly equal amount of time at or above 90°F but a little less time above 95°F.
We saw two less days at or above 90°F this year, which means we set the second-place record for the number of 90°F+ days this year. The next highest amount is 155 days (2012 and 2022).
We saw the fourth-warmest spring (March-May) on record, the ninth-hottest summer (June-August), and the third-warmest fall (September-November) on record.

Continuing with the unfortunate topic of the heat: We managed to see more 100-degree afternoons this year than last year.
With this year’s count of eleven 100-degree days, that pushed 2024 to seventh place and moved 2025 into fourth place for the most 100-degree days in a year.
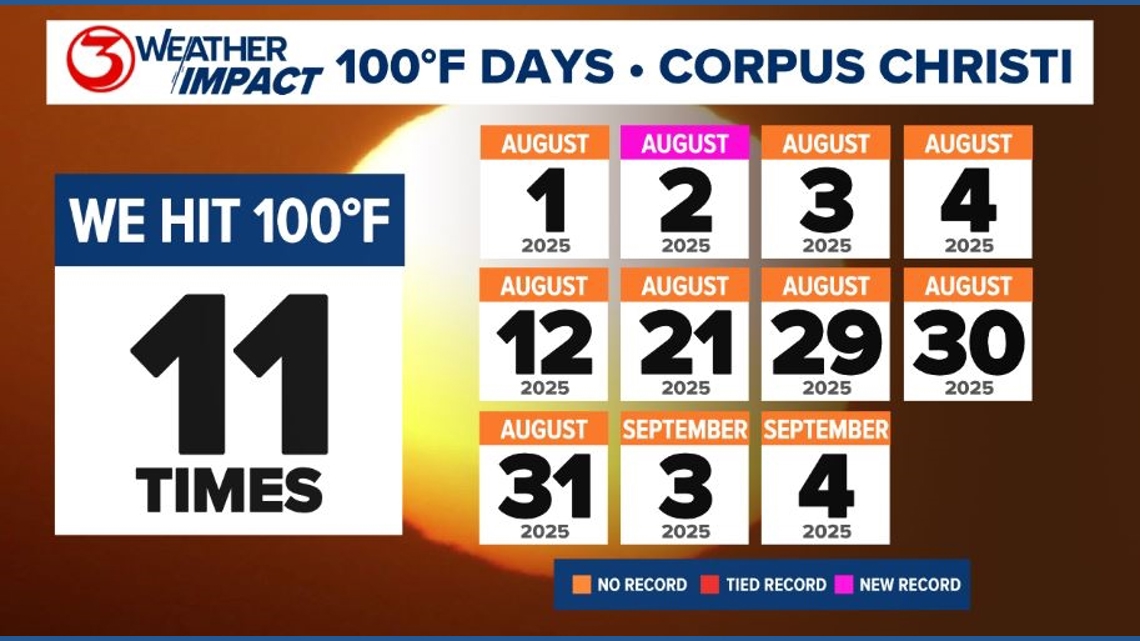
By temperature: this year we reached daily highs of 102°F and 101°F one time each and 100°F nine times.

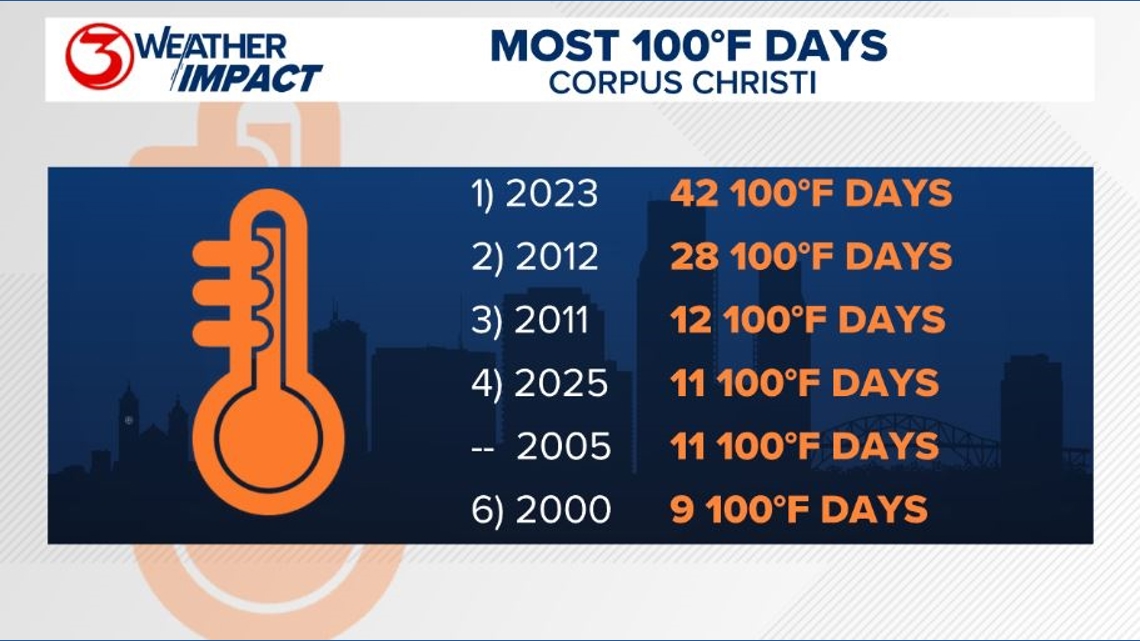
The first 100-degree day came with the arrival of August. August saw nine 100-degree afternoons, with the first four of those occurring consecutively. Corpus Christi’s longest 100-degree day streak on record is 12 days, set in 2012.
This August also registered the third-most 100-degree days on record. Only 2023 (22 days) and 2012 (13 days) have seen more 100-degree afternoons in August.

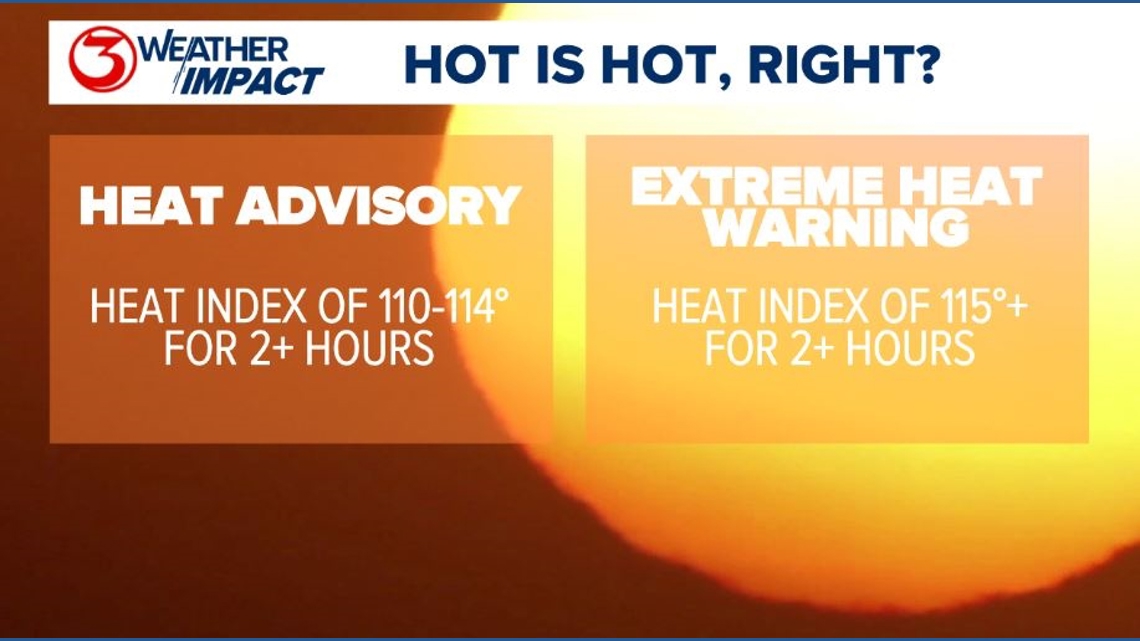
While the air temperatures were definitely hot at times, the heat index is really what matters in the summer. Not only is the heat index the temperature that our bodies react to, it’s the qualification for heat-related advisories and warnings. Thankfully, we didn’t see many this year.
Heat Advisories are issued when the forecast calls for heat indices of 110-114°F for two or more hours.
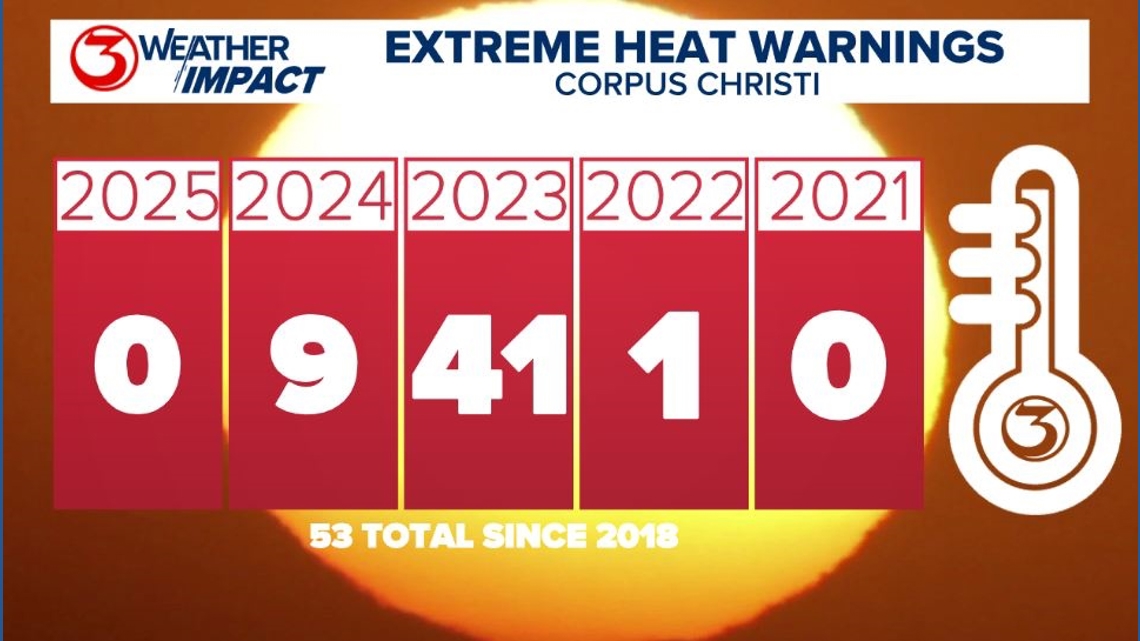
Extreme Heat Warnings (previously Excessive Heat Warnings) are a step above, issued when the heat index is expected to be 115°F+ for two or more hours.

Last year, we saw around half of the amount of Heat Advisories as we had in 2023, and this year, we saw a sixth of the Heat Advisories from last year.
Our first Heat Advisory was issued on May 12, and the last was issued August 3. In total, we had only seven Heat Advisories this year. The first five were in May and the last two in August.

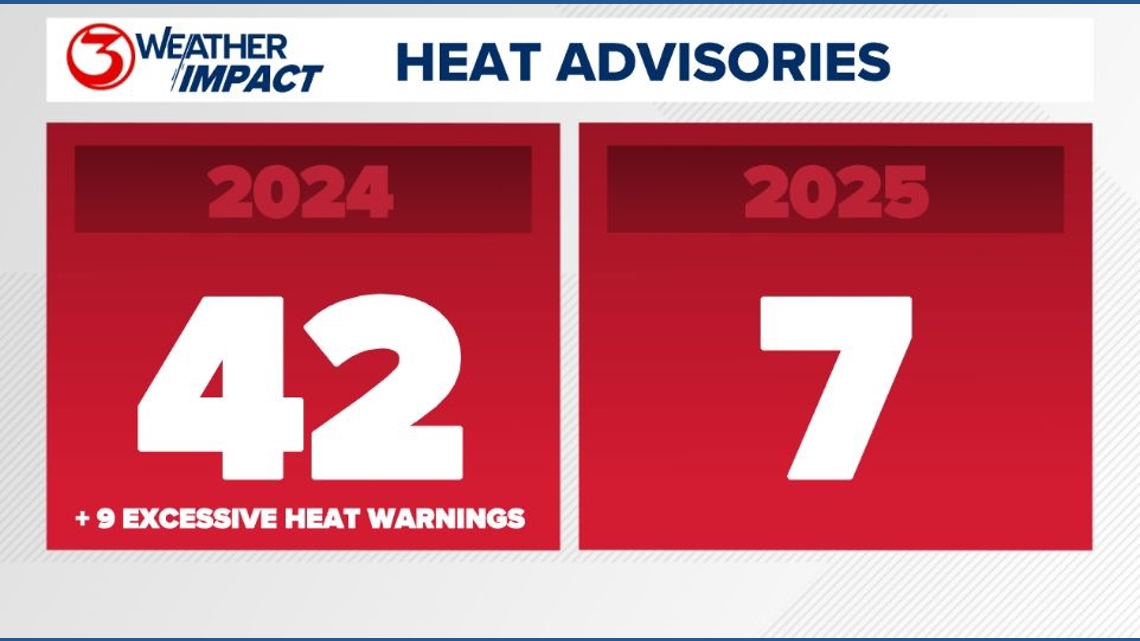
For the first time since 2021, we saw no Extreme Heat Warnings this year. (Yay!)

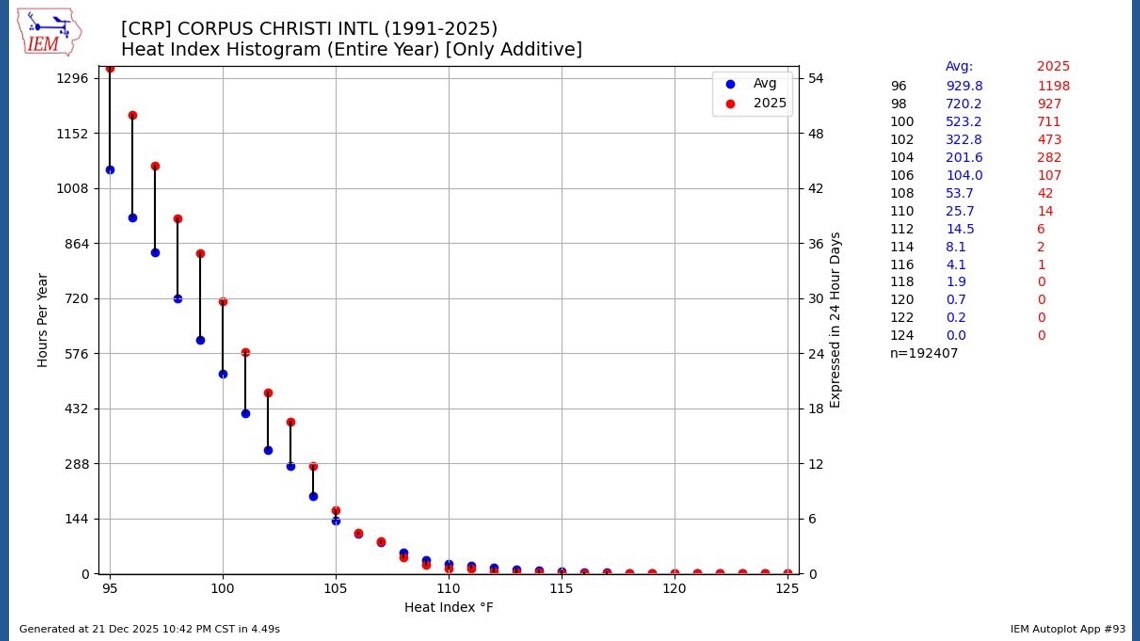
Over the course of the year, we spent only 14 hours with a heat index at or above 110°F. Last year, that number was 123 hours, and in 2023, it was 425 hours. You can see in the graph below we spend on average (since 1991) 25 hours with a heat index of 110°F+ per year.
The graph below shows the difference between the average amount of time spent at a certain heat index over the course of a year [blue] compared to what actually occurred in 2025 [red].

Enough of the heat. Let’s move on to rainfall.
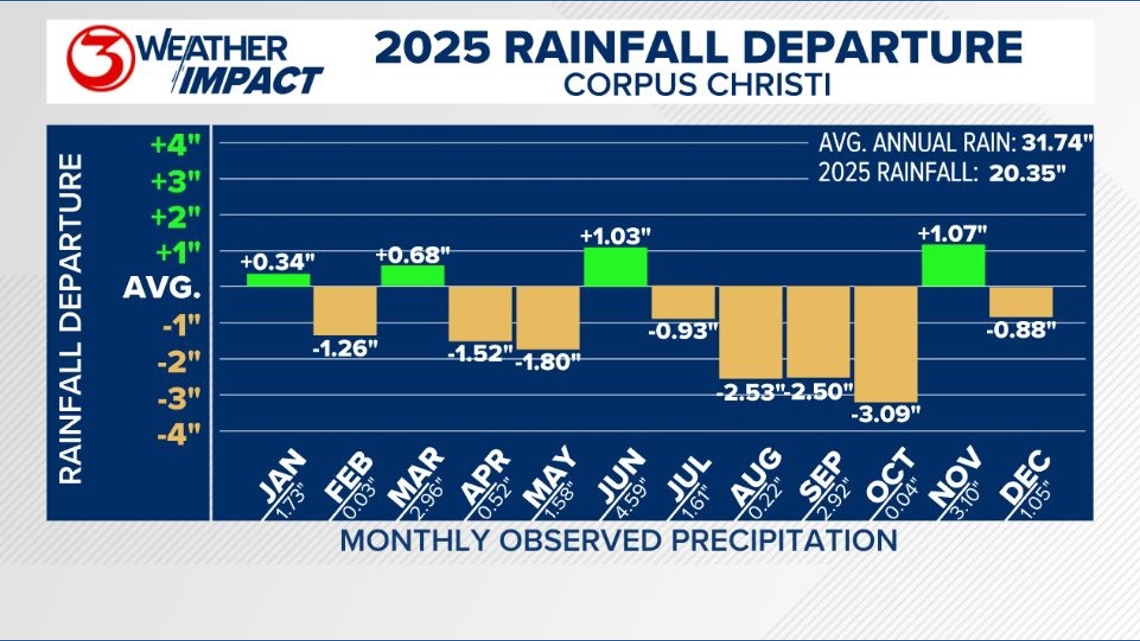
At the end of 2024, Corpus Christi had received 26.77″ of rain. This year was drier; we received 20.35″ of rain. This marks the third consecutive year where our total annual rainfall has decreased. Our average annual total is 31.74″.
Four months were above-normal and eight months were below-normal in their average monthly rainfall.
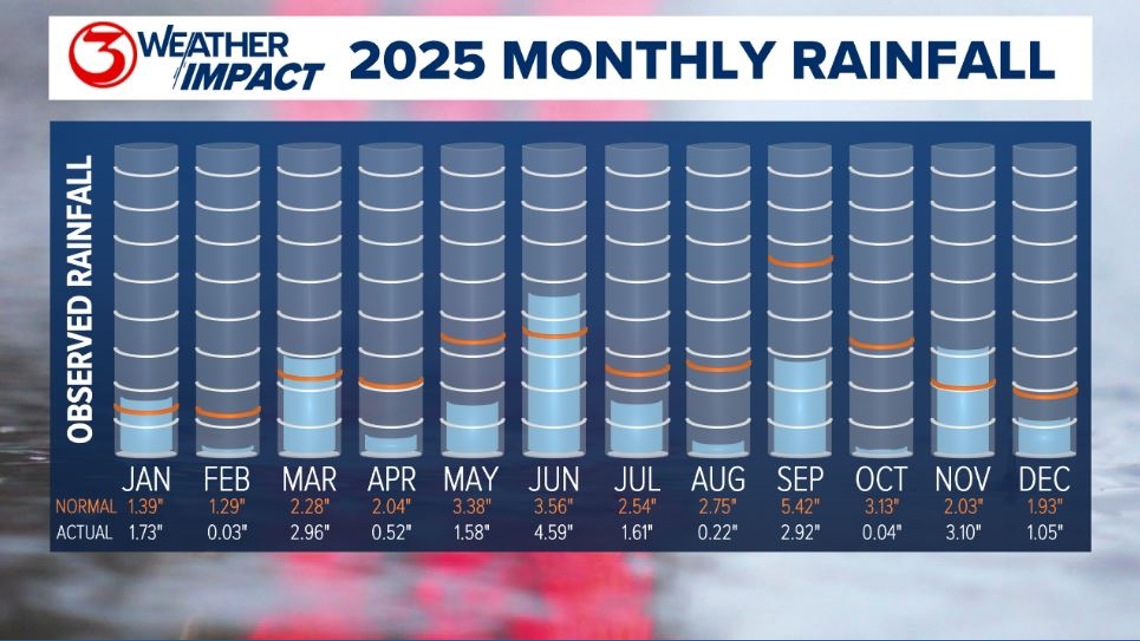
June was again the wettest month this year, seeing over 4.50″ of rain. February was the driest month with only 0.03″ recorded at Corpus Christi International Airport the entire month. October was a close second with just a hundredth of an inch more.

The wettest day of the year was in March – 2.12″ on March 27, accounting for 72% of that month’s total rainfall.
Around 67% (13.57″) of our 2025 rain fell within four months – March, June, September, and November. Even more impressive, 57% (11.54″) of our annual rainfall fell within nine days (January 9, March 27, May 8, June 11, 12, & 16, September 6, November 22 & 23). Five of these days each saw over an inch of rain.

While the annual rainfall total has fallen each year for the past three years, that’s not the sole reason our watershed is suffering. We explored the Coastal Bend’s water consumption habits in our Water Woes series from this past spring. The video below is a quick crash-course on the data we discovered. The short of it: we’re using more water than nature provides.
RELATED: Corpus Christi at risk of running out of water by Spring 2027
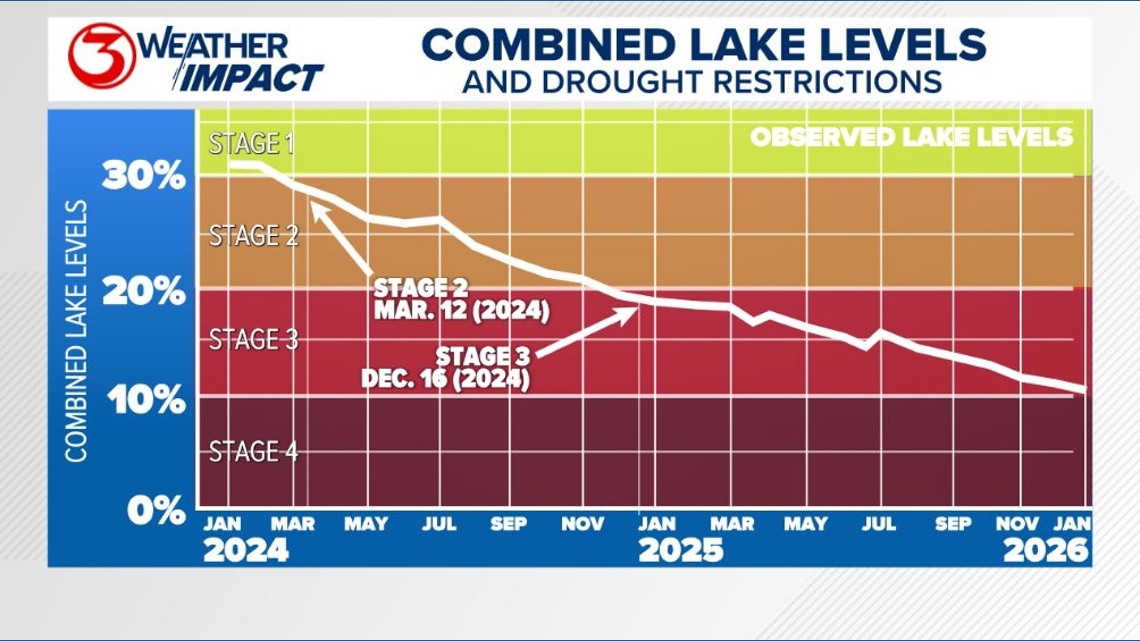
We began 2025 in Stage 3 Water Restrictions and with a little over 19% in our combined watershed (Lake Corpus Christi and Choke Canyon). At the close of the year, lake levels sat at just over 10%. This is the lowest our combined lake levels have ever been.
Stage 4 Water Restrictions – a water emergency – begin at 10%.
We have been in
• Stage 1 Water Restrictions (<40%) – since June 2022
• Stage 2 Water Restrictions (<30%) – since March 12, 2024
• Stage 3 Water Restrictions (<20%) – since December 16, 2024
Prior to last year, the last time we saw Stage 2 Water Restrictions was 2015.

Now let’s talk about how the lack of rainfall affected our drought conditions throughout the year. At any point during 2025, there was at least one part of the Coastal Bend experiencing severe drought.
The drought monitor saw minimal changes during the first month of the year. By the end of February, severe drought conditions expanded, and by late March all of the Coastal Bend was in severe drought. From January 1 – March 25, Corpus Christi had only received 1.76″ of rain. The last drought monitor of the first quarter added extreme drought in parts of the northern Coastal Bend.
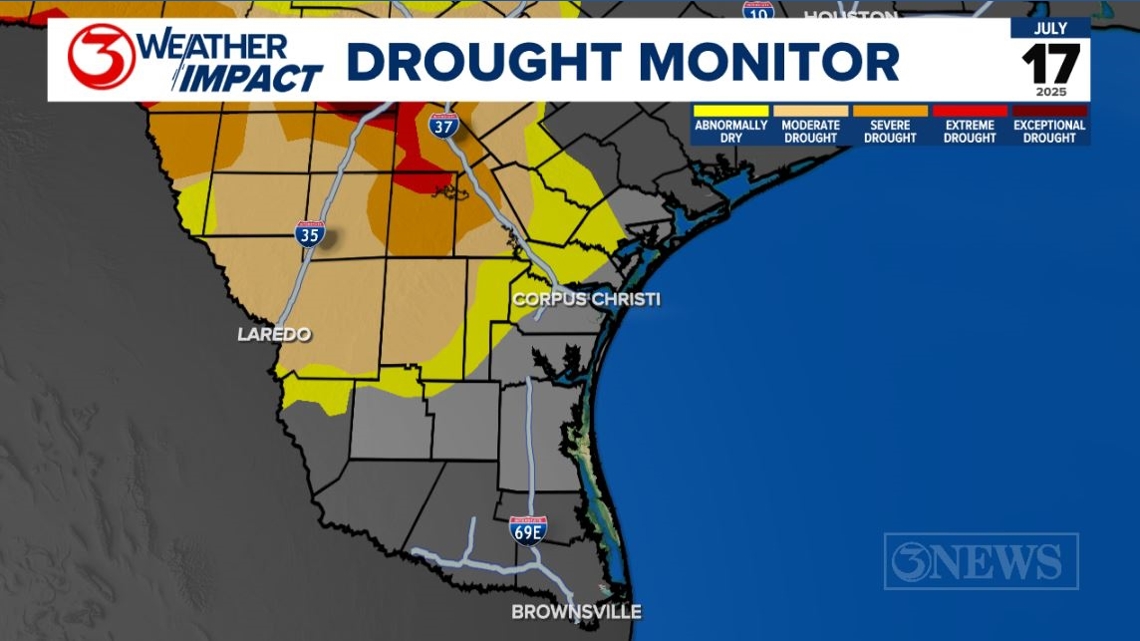
A rain episode in late March reduced the coverage of the extreme drought. Every two to three weeks in the period from April through July, drought conditions were pulled back due to sporadic wet periods. The drought monitor below is from July 17. This is the best it looked all year.
Limited rainfall in August led to the re-expansion of drought conditions. The expansion continued through September, even though we never went more than five days without measurable rainfall. The drought monitor went unchanged for the first half of October, but with only 0.04″ measured by the end of the month, the drought worsened. Five consecutive weeks saw a worsening drought monitor, at which point extreme drought conditions were re-introduced. We made it five months without extreme drought.
Late-November rains briefly improved drought conditions, with the same amount of rain falling on November 22 and 23 as in the entire month of September. Extreme drought conditions were expanded to include the northern Coastal Bend by the end of the year, even with another inch of rain in December.

The drought conditions did not help matters when it came to dealing with wildfires.
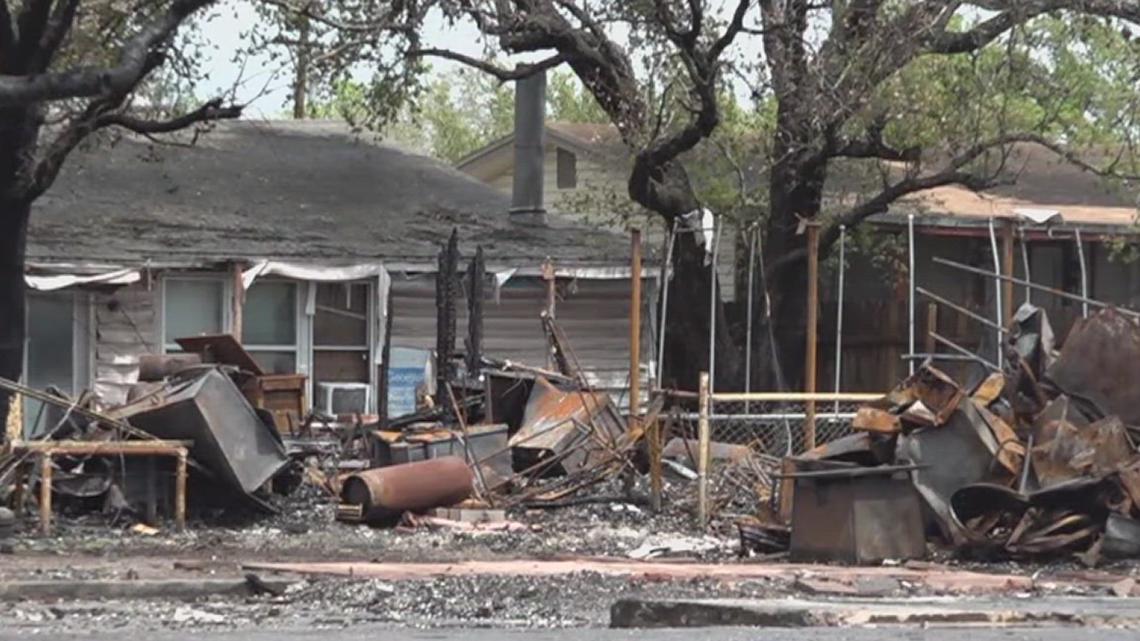
The Welder Fire in Sinton was the most notable, which burned 175 acres and nearly two dozen homes. The fire was started by leaves and dust being blown into a transformer, causing it to spark.
On the same afternoon, a fire near the National Weather Service office and Corpus Christi International Airport led to NWS employees evacuating. Several flights were either cancelled or delayed.
Other fires this spring included the Duval 1256 Fire north of Freer, the Lake Pasture Fire east of Refugio, and the Road Runner Fire northeast of Alice. In late October, a cotton gin fire in Gregory claimed a handful of homes.

In addition to the fires, we saw our fair share of destructive storms this year, too.
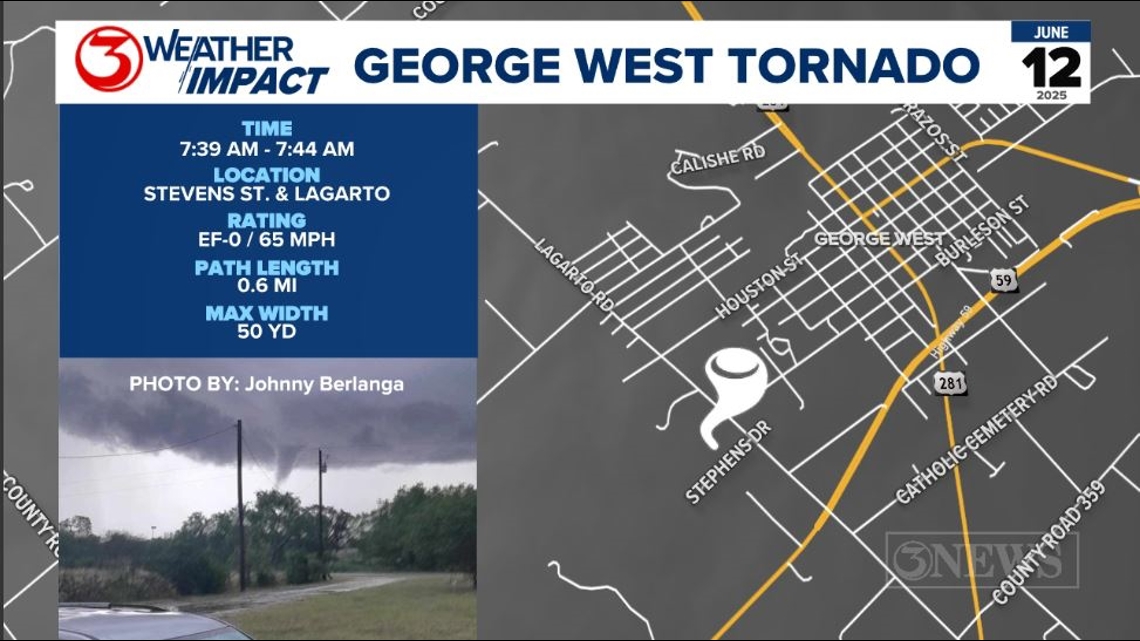
A June tornado left a trail of damage in George West. The EF-0 damaged two porches, snapped tree branches, and pushed a tree onto a truck. Its winds were estimated to be 65 mph.

On May 8, a late-night severe thunderstorm moving through the central Coastal Bend triggered cell phone emergency alerts. The storm was warned for winds up to 90 mph.
The storms originated to our north and grew into a line of storms called a mesoscale convective system. As the storm moved through, strong winds rushed down to the surface, creating a bulge on radar called a bow echo.
As the storm moved over Highway 77, winds of over 100 mph were being estimated by radar.

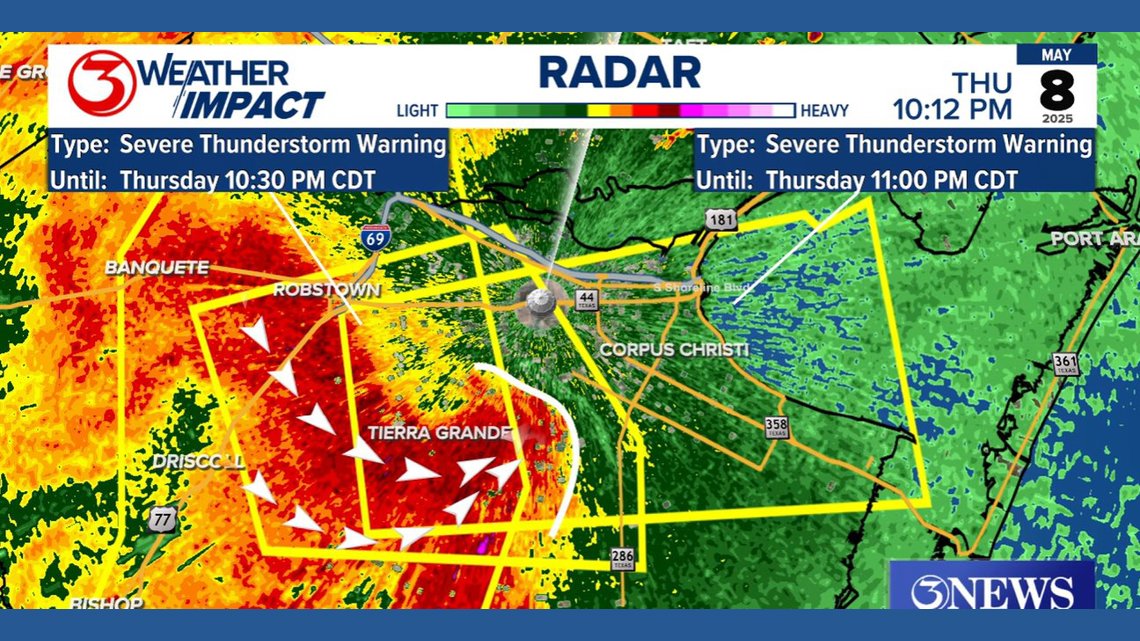
The National Weather Service damage survey determined that a maximum wind gust of 115 mph occurred between Alice and Petronila – that’s the equivalent of a Category 3 hurricane.
Wind speeds of 70-90 mph were reported in an area 54 miles long and 16 miles across. Alice recorded a wind gust of 89 mph. These straight-line winds were responsible for hundreds of powerlines and transmission poles being snapped, leaving thousands without power. At least four injuries were reported.
There were two other evenings of note regarding thunderstorms in 2025 – but for baseball-size hail.
The first was just one week prior to the destructive straight-line winds and was a single storm rather than a line. This storm dropped 2.75″ hail in Pawnee in northern Bee County.

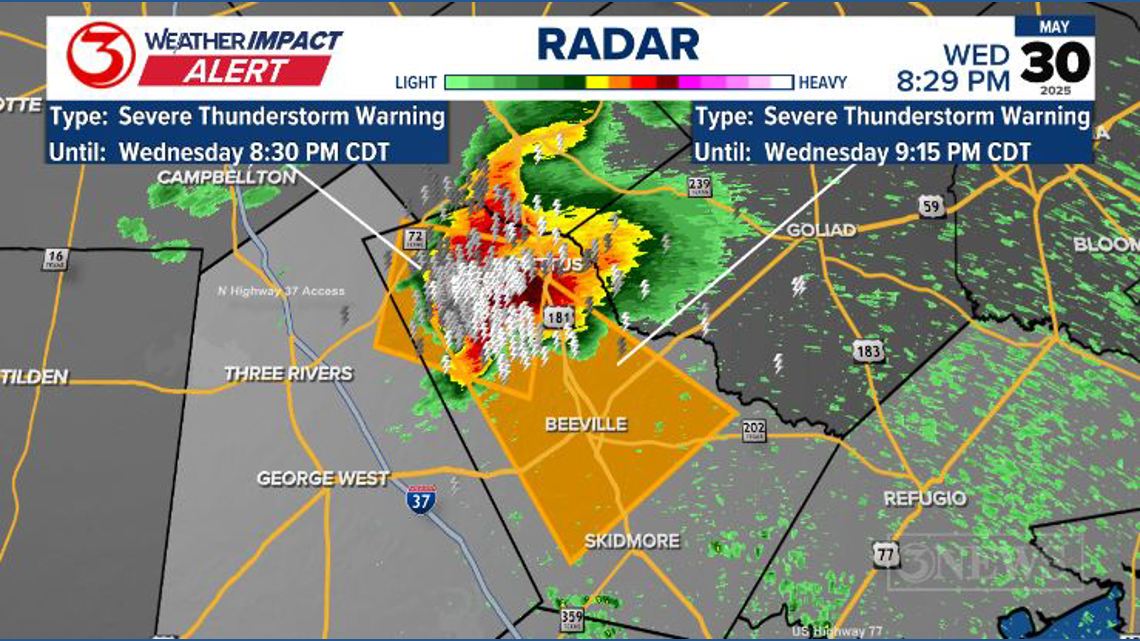
A Bee County Sheriff’s unit took a beating from the baseball-size hail while the officer was inside. Thankfully, they were okay.


The second happened six months later. This time, though, multiple storms were dropping large hail at the same time.
Storms originating in the northwestern Coastal Bend were able to tap into a favorable atmosphere to produce baseball-size hail again. In order for a storm to keep hail aloft long enough for it to grow to the size of a baseball, the storm must have an updraft of at least 81 mph.

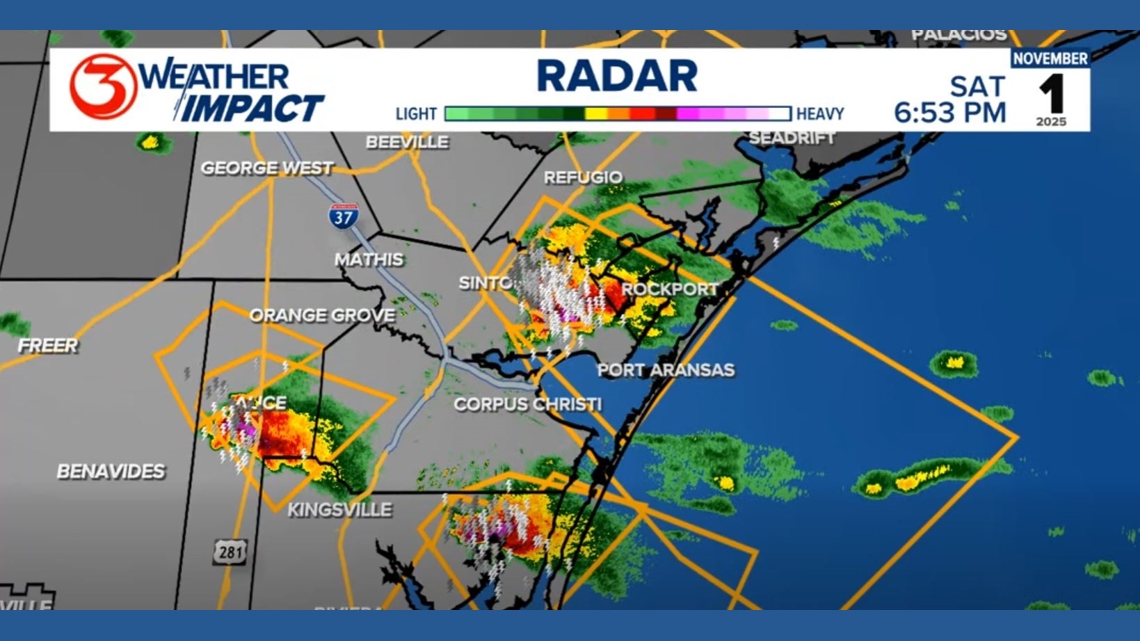
There was sizeable hail dropped across parts of Bee, Refugio, San Patricio, Jim Wells, and Kleberg Counties as well as on Padre Island in Nueces County.
Widespread damage to vehicles, buildings, and other property was evident in places like Taft and Portland.


That wraps up the 2025 weather wrap up! Hopefully we see fewer destructive storms and fires and more rainfall as we head into 2026.