
Ryder Harrington and Savitha Shan never made it home from their night out on West Sixth Street. A gunman opened fire along the bar-lined street early Sunday, killing both of them and wounding 16 others in a burst of violence that stunned the city.
By Monday, the death toll had climbed again. Jorge Pederson, who had been on life support, died from his injuries, authorities said.
The gunman was pronounced dead at the scene after a gunfire exchange with police. In all, 19 people were shot — four fatally and 15 injured.
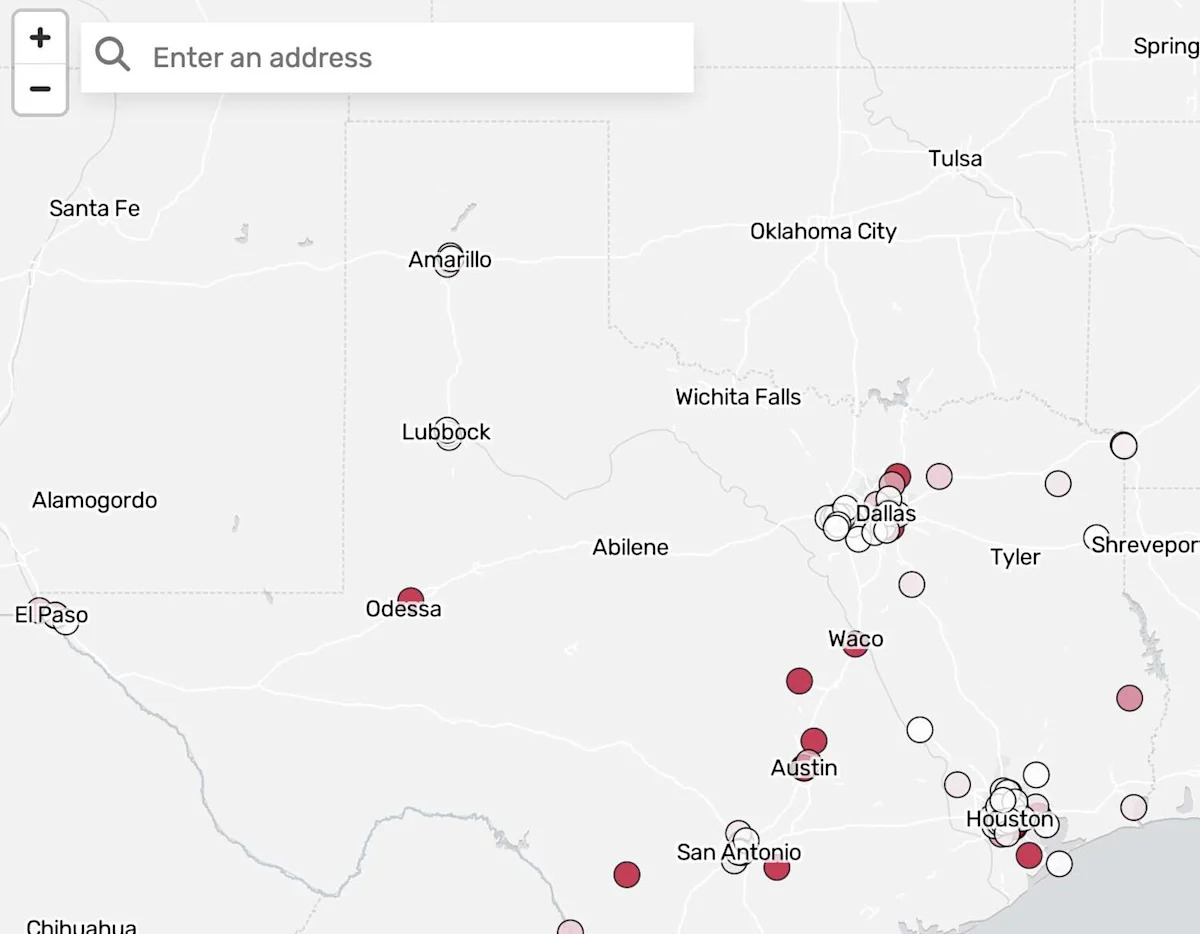
The bloodshed marks the shooting with the most casualties in Travis County in at least 12 years and among the highest victim counts of shootings in Texas during that period, according to an American-Statesman analysis of Gun Violence Archive data.
{ “__type”: “devHubFreeformEmbed”, “__id”: “Datawrapper”, “__fallbackImage”: “https://datawrapper.dwcdn.net/r7xJR/mobile.png”, “__data”: { “datawrapper_id”: “r7xJR” } }
It also underscores a recurring pattern along Austin’s Sixth Street entertainment district, where large crowds spill onto the sidewalks at bar closing. Since 2014, four of the Travis County shootings with the highest victim counts have unfolded somewhere along Sixth Street.
Outside of downtown, the county’s most catastrophic recent shooting occurred Dec. 5, 2023. Prosecutors allege that a young man later deemed mentally incompetent to stand trial killed his parents in San Antonio before driving to South Austin, where he fatally shot four more people. In total, nine people were shot across multiple scenes, and a police officer was injured near Northeast Early College High School in Northeast Austin.
Statewide, the West Sixth shooting ranks eighth in total victims in recent years.
{“__type”: “devHubFreeformEmbed”,”__id”:”SearchableMap”,”__data”:{“story_settings”:[{“Market_Key”:”Austin”,”Subhead”:”Where have shootings with the most victims happened recently in Texas?”,”Chatter”:”The West Sixth Street shooting had the 8th highest number of victims in the state since January 2014, with a total of 18 victims. “,”Fallback_Image”:””,”Test_URL”:”https://preview-prod.w.statesman.com/interactives-embed/1772495203562-devhub-test-proj/SearchableMap?width=600″,”Freeform_ID”:”104626″,”Freeform_Link”:”https://wcm.hearstnp.com/index.php?_wcmAction=business/item&id=104626″,”Unique_ID”:”1772495203562″,”Template”:”none”,”WCM_Embeds”:”SearchableMap”,”Subtype”:”Base”,”Slug”:”devhub”}],”map_settings_wcmprops”:[{“Market_Key”:”Automatically pulled from story_settings”,”Homepage_Embed”:”Optional: Check this box if you want to create a second freeform to use on homepage or section front. This freeform will exclude the hed, dek, notes, source, and byline. “,”Width”:”Optional: How wide you’d like your map to appear on desktop. Will default to text width, but you can make it wider (large is 928px, wide is 1200px).”,”Map_Notes”:”Optional: A line of notes that will appear under the map, above the byline and source lines.”,”Map_Byline”:”Byline for the map. Omit \”By\””,”Map_Source”:”Omit \”Source:\”. Accepts HTML for links.”,”Alt_Text”:”For accessibility: A description of the map. Here’s some tips on how to write it. “,”Style_URL”:”URL for the base map style; use https://maputnik.github.io/ to make your own. Otherwise, don’t change this. A list of som existing styles lives here.”,”View_Zoom”:”OPTIONAL: Zoom level to initiate map at; 0 is most zoomed-out, 22 is most zoomed in. If you do not have a center latitude and longitude set, this will be overriden and the zoom level will be calibrated to show all points on the map.”,”View_Latitude”:”OPTIONAL. Latitude to initialize the map at. Use the Zoom level and Center Coordinates console logs to select the values you want. Leave blank to default to show all markers on map”,”View_Longitude”:”OPTIONAL. Longitude to initialize the map out. Use the Zoom level and Center Coordinates console logs to select the values you want. Leave blank to default to show all markers on map”,”Bounding_Box”:”OPTIONAL. A specific bounding box to set the map bounds. Overrides View_Zoom, View_Latitude, and View_Longitude.”,”Symbol_Radius”:”Optional: Default size of symbols on the map. Default is 5, make it bigger or smaller.”,”Symbol_Fill_Color”:”Default color for symbols – dropdown is connected to our palette, but can be overriden with a hex code if desired.”,”Symbol_Fill_Opacity”:”Default transparency of symbol fills, enter a value 0-1.”,”Symbol_Stroke_Color”:”Default color for symbol stroke.”,”Symbol_Stroke_Opacity”:”Default transparency of symbol strokes, 0-1″,”Min_Zoom”:”OPTIONAL. Minimum level to which user can zoom out on the map (increase this value if you want the user to be able to zoom out less)”,”Max_Zoom”:”OPTIONAL. Maximum level to which user can zoom in on the map (decrease this value if you want the user to be able to zoom in less).”,”Tooltip_Zoom”:”OPTIONAL. Zoom level to zoom to when the user clicks a tooltip. If you don’t want to change the zoom for tooltips, leave this blank.”,”Geocoder_Zoom”:”OPTIONAL: How far to zoom into an address that’s been geocoded. 0 is most zoomed-out, 22 is most zoomed in.”,”Show_Geocoder”:”Check the box to show an address search tool.”,”Geocoder_Region”:”Defaults to your market’s state. Change to \”United States\” if desired.”,”Geocoder_Popup”:”Check the box if you want a popup to automatically appear after the user uses the map search function. Only works with polygons/shapes on the map (not points).”,”Show_Popups”:”Check the box if you’d like to use popup boxes.”,”Legend_HTML”:”If you want to write custom HTML for your legend, add that here. Overrides all defaults. Current code here.”,”Citynames_Top”:”Check the box if you want city and place names to be shown above the points / polygons on the map instead of behind it. “,”Layer_Top”:”If you want a specific layer to appear above all other layers, add that below.”,”External_Files”:”OPTIONAL. Use this to add the data for the points or shapes that will make up your map if you already have a geojson. If not, you can also upload spreadsheet data into the map_data sheet. \n\nAdvanced users: If you want to include points / line / polygon on your map, upload your geojson file here and paste your return URL in this cell. If you have multiple geojson files, separate them with a comma (no spaces). Links to mbtiles will work as well. Leave the map_data sheet blank if you have no data. “,”Using_Albers”:”Check this box if you are using an Albers projection to make sure the geocoder goes to the right places”},{“Market_Key”:”Austin”,”Homepage_Embed”:”FALSE”,”Width”:”large”,”Map_Notes”:”The 100 gun violence incidents with the most total victims in Texas from Jan. 1, 2014 to March 1, 2026. The death and injury counts do not include suspects injured or killed. “,”Map_Byline”:”Karina Kumar”,”Map_Source”:”Gun Violence Archive”,”Alt_Text”:”A map showing the 100 shooting incidents in Texas with the most victims colored darker for more victims and lighter for less. “,”Style_URL”:”https://files.sfchronicle.com/static-assets/tiles/pale-northam-plat-fonts.json”,”View_Zoom”:”6″,”View_Latitude”:”31.493572″,”View_Longitude”:”-96.966775″,”Bounding_Box”:””,”Symbol_Radius”:”7″,”Symbol_Fill_Color”:”grey”,”Symbol_Fill_Opacity”:”0.8″,”Symbol_Stroke_Color”:”black”,”Symbol_Stroke_Opacity”:”0.8″,”Min_Zoom”:””,”Max_Zoom”:””,”Tooltip_Zoom”:””,”Geocoder_Zoom”:””,”Show_Geocoder”:”TRUE”,”Geocoder_Region”:”Market’s state”,”Geocoder_Popup”:”FALSE”,”Show_Popups”:”TRUE”,”Legend_HTML”:””,”Citynames_Top”:”TRUE”,”Layer_Top”:””,”External_Files”:””,”Using_Albers”:”FALSE”}],”map_styles_wcmprops”:[{“LayerName”:”This tab is if you want to add a legend to the map for certain layers.\n\nEnter the exact file location of the geojson in used in the map_setting’s \”External_Files\” column. This may be entered in multiple rows (one per category). If you’re referencing data in map_data, type spreadsheet.”,”VariableName”:”Exact name of variable: The name should be same for each row below (the same variable will decide all colors)”,”LegendLabel”:”Optional: Name of the variable in the way you want it to show up on the legend label — this may be the same as column B.”,”Data”:”Content of variable for item — each number/entry below should be different.”,”DataLabel”:”Optional: The way you want the Data variable to appear on the legend; defaults to Data variable.”,”Color”:”Color for the legend. Colors below correspond to our palette, but you can override with a hex code.”,”ScaleType”:”Do you want your legend and styles to be continuous (numerical) or categorical for this layer?”,”LegendNotesPrefix”:”Optional: Add extra notes before a variable value in the legend — for example \”at least \” may be helpful for numeric scales.”,”LegendNotesSuffix”:”Optional: Add extra notes after a variable value in the legend — for example \” or more\”, or \” or less\” may be helpful for numeric scales.”,”Hide_Legend”:”Check this box to hide the legend for this entry”},{“LayerName”:”spreadsheet”,”VariableName”:”victims_total”,”LegendLabel”:”Number of Victims”,”Data”:”6″,”DataLabel”:””,”Color”:”white”,”ScaleType”:”Continuous”,”LegendNotesPrefix”:””,”LegendNotesSuffix”:””,”Hide_Legend”:”FALSE”},{“LayerName”:”spreadsheet”,”VariableName”:”victims_total”,”LegendLabel”:”Number of Victims”,”Data”:”15″,”DataLabel”:””,”Color”:”red”,”ScaleType”:”Continuous”,”LegendNotesPrefix”:””,”LegendNotesSuffix”:” or more”,”Hide_Legend”:”FALSE”},{“LayerName”:””,”VariableName”:””,”LegendLabel”:””,”Data”:””,”DataLabel”:””,”Color”:””,”ScaleType”:””,”LegendNotesPrefix”:””,”LegendNotesSuffix”:””,”Hide_Legend”:”FALSE”},{“LayerName”:””,”VariableName”:””,”LegendLabel”:””,”Data”:””,”DataLabel”:””,”Color”:””,”ScaleType”:””,”LegendNotesPrefix”:””,”LegendNotesSuffix”:””,”Hide_Legend”:”FALSE”},{“LayerName”:””,”VariableName”:””,”LegendLabel”:””,”Data”:””,”DataLabel”:””,”Color”:””,”ScaleType”:””,”LegendNotesPrefix”:””,”LegendNotesSuffix”:””,”Hide_Legend”:”FALSE”},{“LayerName”:””,”VariableName”:””,”LegendLabel”:””,”Data”:””,”DataLabel”:””,”Color”:””,”ScaleType”:””,”LegendNotesPrefix”:””,”LegendNotesSuffix”:””,”Hide_Legend”:”FALSE”}],”map_tooltips_wcmprops”:[{“LayerName”:”Enter the exact file location of the geojson in used in the map_setting’s \”External_Files\” column. This may be entered in multiple rows (one per category). If you’re referencing data in map_data, type spreadsheet.”,”VariableName”:”Exact name of variable in data sheet”,”DataName”:”Optional: How you’d like this variable to show up in the tooltip”,”DataPrefix”:”Optional: Anything to add before the data in tooltips and legends — a dollar sign, for example. This will also show up in the legend if the variable is used there.”,”DataSuffix”:”Optional: Anything to add after the data in tooltips and legends — \”lbs\”, for example. This will also show up in the legend if the variable is used there.”,”FormatData”:”If you’d like to add a formula to format this field, you can use vanilla JS to do that here. Use variable to indicate the variable. Anything here should be able to go after a return statement in a function. Example (for adding commas to large numbers): variable.toString().replace(/\\B(?=(\\d{3})+(?!\\d))/g, \”,\”)”,”Header”:”If this is a title column that should appear first and doesn’t need a colon, check the box”,”Image”:”If this is an image column (if its content is an image link or WCM image ID), check the box. “,”Include_Colon”:”If you want a colon here, check the box”,”Highlight”:”Check the box to highlight this field with the color of the dot, line, or polygon it corresponds to. “,”Show_On”:”Do you want to show this layer on click or on hover? Defaults to click.\n\nThe same option should be selected for all rows in a layer.”},{“LayerName”:”spreadsheet”,”VariableName”:”incident_date”,”DataName”:”Date of incident”,”DataPrefix”:””,”DataSuffix”:””,”FormatData”:””,”Header”:”FALSE”,”Image”:””,”Include_Colon”:”TRUE”,”Highlight”:””,”Show_On”:”Hover”},{“LayerName”:”spreadsheet”,”VariableName”:”victims_total”,”DataName”:”Total victims”,”DataPrefix”:””,”DataSuffix”:””,”FormatData”:””,”Header”:”FALSE”,”Image”:”FALSE”,”Include_Colon”:”TRUE”,”Highlight”:”FALSE”,”Show_On”:”Hover”},{“LayerName”:”spreadsheet”,”VariableName”:”victims_killed”,”DataName”:”Victims killed”,”DataPrefix”:””,”DataSuffix”:””,”FormatData”:””,”Header”:”FALSE”,”Image”:”FALSE”,”Include_Colon”:”TRUE”,”Highlight”:”FALSE”,”Show_On”:”Hover”},{“LayerName”:”spreadsheet”,”VariableName”:”location_label”,”DataName”:””,”DataPrefix”:””,”DataSuffix”:””,”FormatData”:””,”Header”:”TRUE”,”Image”:”FALSE”,”Include_Colon”:”FALSE”,”Highlight”:”FALSE”,”Show_On”:”Hover”},{“LayerName”:””,”VariableName”:””,”DataName”:””,”DataPrefix”:””,”DataSuffix”:””,”FormatData”:””,”Header”:”FALSE”,”Image”:”FALSE”,”Include_Colon”:”FALSE”,”Highlight”:”FALSE”,”Show_On”:””},{“LayerName”:””,”VariableName”:””,”DataName”:””,”DataPrefix”:””,”DataSuffix”:””,”FormatData”:””,”Header”:”FALSE”,”Image”:”FALSE”,”Include_Colon”:”FALSE”,”Highlight”:”FALSE”,”Show_On”:””},{“LayerName”:””,”VariableName”:””,”DataName”:””,”DataPrefix”:””,”DataSuffix”:””,”FormatData”:””,”Header”:”FALSE”,”Image”:”FALSE”,”Include_Colon”:”FALSE”,”Highlight”:”FALSE”,”Show_On”:””},{“LayerName”:””,”VariableName”:””,”DataName”:””,”DataPrefix”:””,”DataSuffix”:””,”FormatData”:””,”Header”:”FALSE”,”Image”:”FALSE”,”Include_Colon”:”FALSE”,”Highlight”:”FALSE”,”Show_On”:””}],”cluster_settings_wcmprops”:[{“LayerNames”:”Enter a comma-separated list of exact file location(s) of the geojson in used in the map_setting’s \”External_Files\” column. This may be entered in multiple rows (one per category). If you’re referencing data in map_data, type spreadsheet.”,”Cluster”:”Check box if you want to cluster nearby datapoints together; only valid for point data. This will automatically set the circle-radius property based on cluster size.”},{“LayerNames”:””,”Cluster”:”FALSE”}],”map_data_wcmfeed”:”https://files.sfchronicle.com/wcm-feeds/2026/1er4cp5sl6da5efQ9cPVPfy0EtjCe4e8vN4NiEDfMDt0map_data_wcmfeed.json”,”map_toggles_wcmprops”:[{“LayerName”:”Enter the exact file location of the geojson in used in the map_setting’s \”geojson\” column. This may be entered in multiple rows (one per category). If you’re referencing data in map_data, type spreadsheet.”,”LayerField”:”If you only want to variable shown on the map, NOT swap the actual layer, add the field you want to use here. “,”LayerLabel”:”Name of the variable in the way you want it to show up on the toggle/filter buttons — this may be the same as column A.”,”Toggle_Filter”:”Content of variable for item — each number/entry below should be different.”}]}}
The highest tolls in Texas over the past decade came at First Baptist Church in Sutherland Springs in 2017 and at a Walmart in El Paso in 2019. Each left 46 people shot. They were followed by the 2022 massacre at Robb Elementary School in Uvalde, where 38 people were shot, and a 2019 shooting spree across Odessa and Midland that impacted 30 victims.
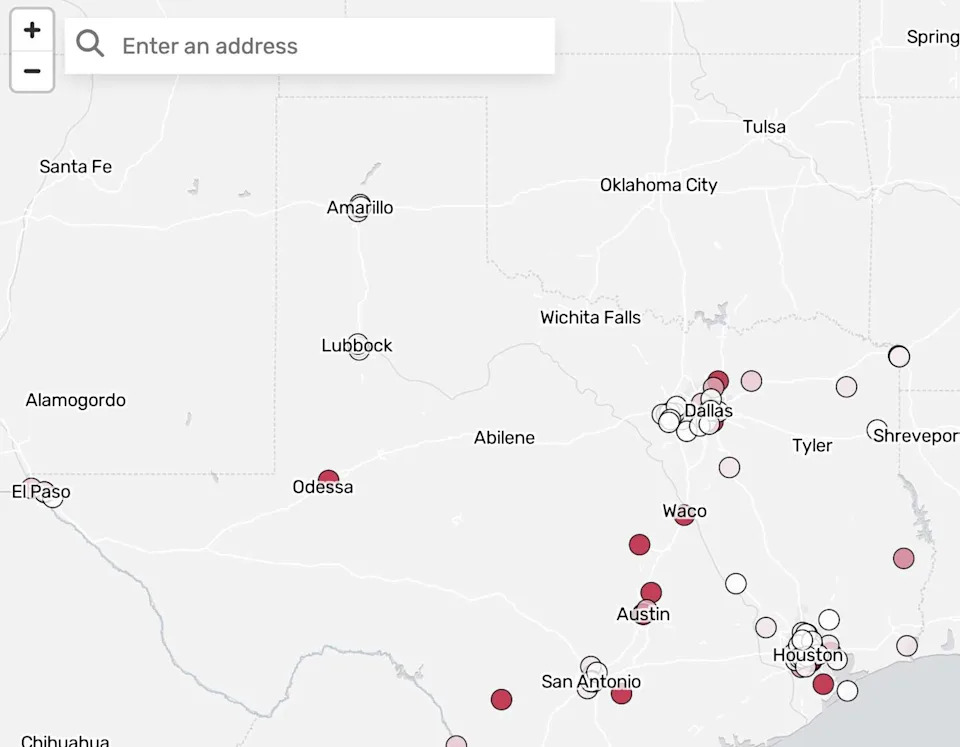
Mass shootings in Texas over the past 12 years (Karina Kumar)
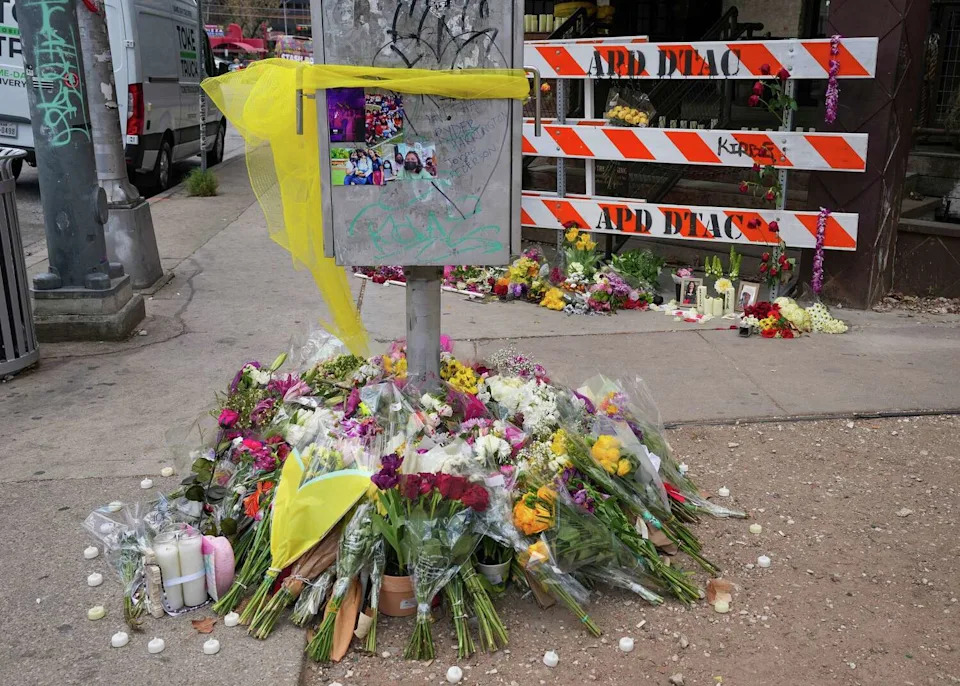
A growing memorial of flowers, candles and photographs honors the victims of the mass shooting outside Buford’s Backyard Beer Garden in Austin on Thursday, March 5, 2026. Ryder Harrington, 19; Savitha Shan, 21; and Jorge Pederson, 30, were killed in the shooting early Sunday. The gunman also died. (Jay Janner/Austin American-Statesman)