
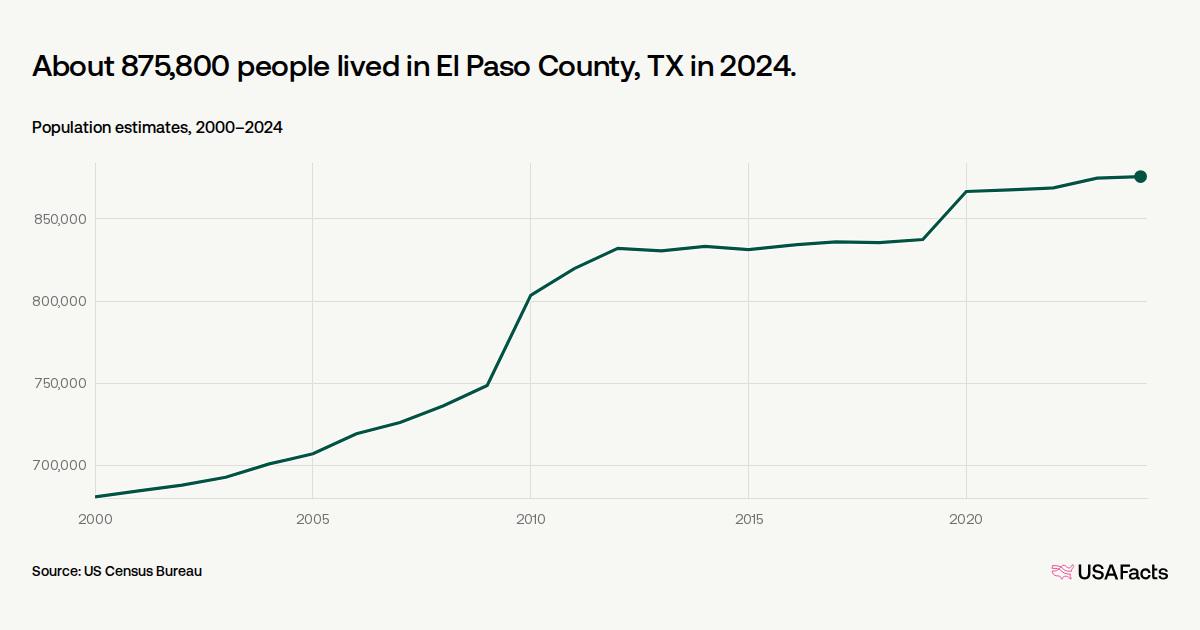
In 2024, there were about 875,800 people living in El Paso County, TX. That makes El Paso County the 10th-most populous county in Texas. It is home to 2.8% of people living in the state.
876K
population of El Paso County, TX (2024)
2.8%
County share of the Texas population (2024)
About 875,800 people lived in El Paso County, TX in 2024.
Population estimates, 2000–2024
What are El Paso County, TX’s age demographics?
About 120,300 El Paso County residents are aged 65 and older in 2024. That represents 13.7% of its population. For comparison, the age group represents 14% of Texas’s population and 18% in the US overall.
Another 220,900 El Paso County residents, or 25.2% of the population, were children under 18. For comparison, the age group represents 24.6% of Texas’s population and 21.6% in the US overall.
Subscribe for weekly, data-driven insights. No spin, just the facts.
A lower share of El Paso County, TX’s population is aged 65 or older than the US as a whole.
Population estimates by age group, (2024)
What are El Paso County, TX’s racial and ethnic demographics?
Hispanic residents make up 82.8% of the El Paso County, TX population, higher than the national share of 20%.
In contrast, El Paso County’s non-Hispanic white population accounts for 11%, below the 57.5% nationwide, and the non-Hispanic Black or African American population makes up 3.6% of the county, compared with 12.6% nationally.
Racial and ethnic make up differ based on location. These figures reflect how people identified their race alone (not in combination with other races), and separate out Hispanic or Latino ethnicity, following Census reporting standards.
El Paso County, TX has a higher share of a Hispanic population than Texas as a whole.
Population estimates by race and ethnicity, (2024)
The largest city or town in El Paso County, TX is El Paso with about 681,700 residents in 2024.
Cities and towns in El Paso County, TX ranked by population
Population (2024), includes only portions within county
Cities and towns in El Paso County, TX ranked by populationCity or townPopulation1. 681,7232. 38,6423. 24,8024. 10,1285. 4,5426. 2,0137. 1,0698.
Balance of El Paso County
112,865Keep exploring