
Whether you’re seeking to buy or sell a home in the Austin area, the Austin American-Statesman real estate tracker can help you understand and navigate the housing market here and across Texas.
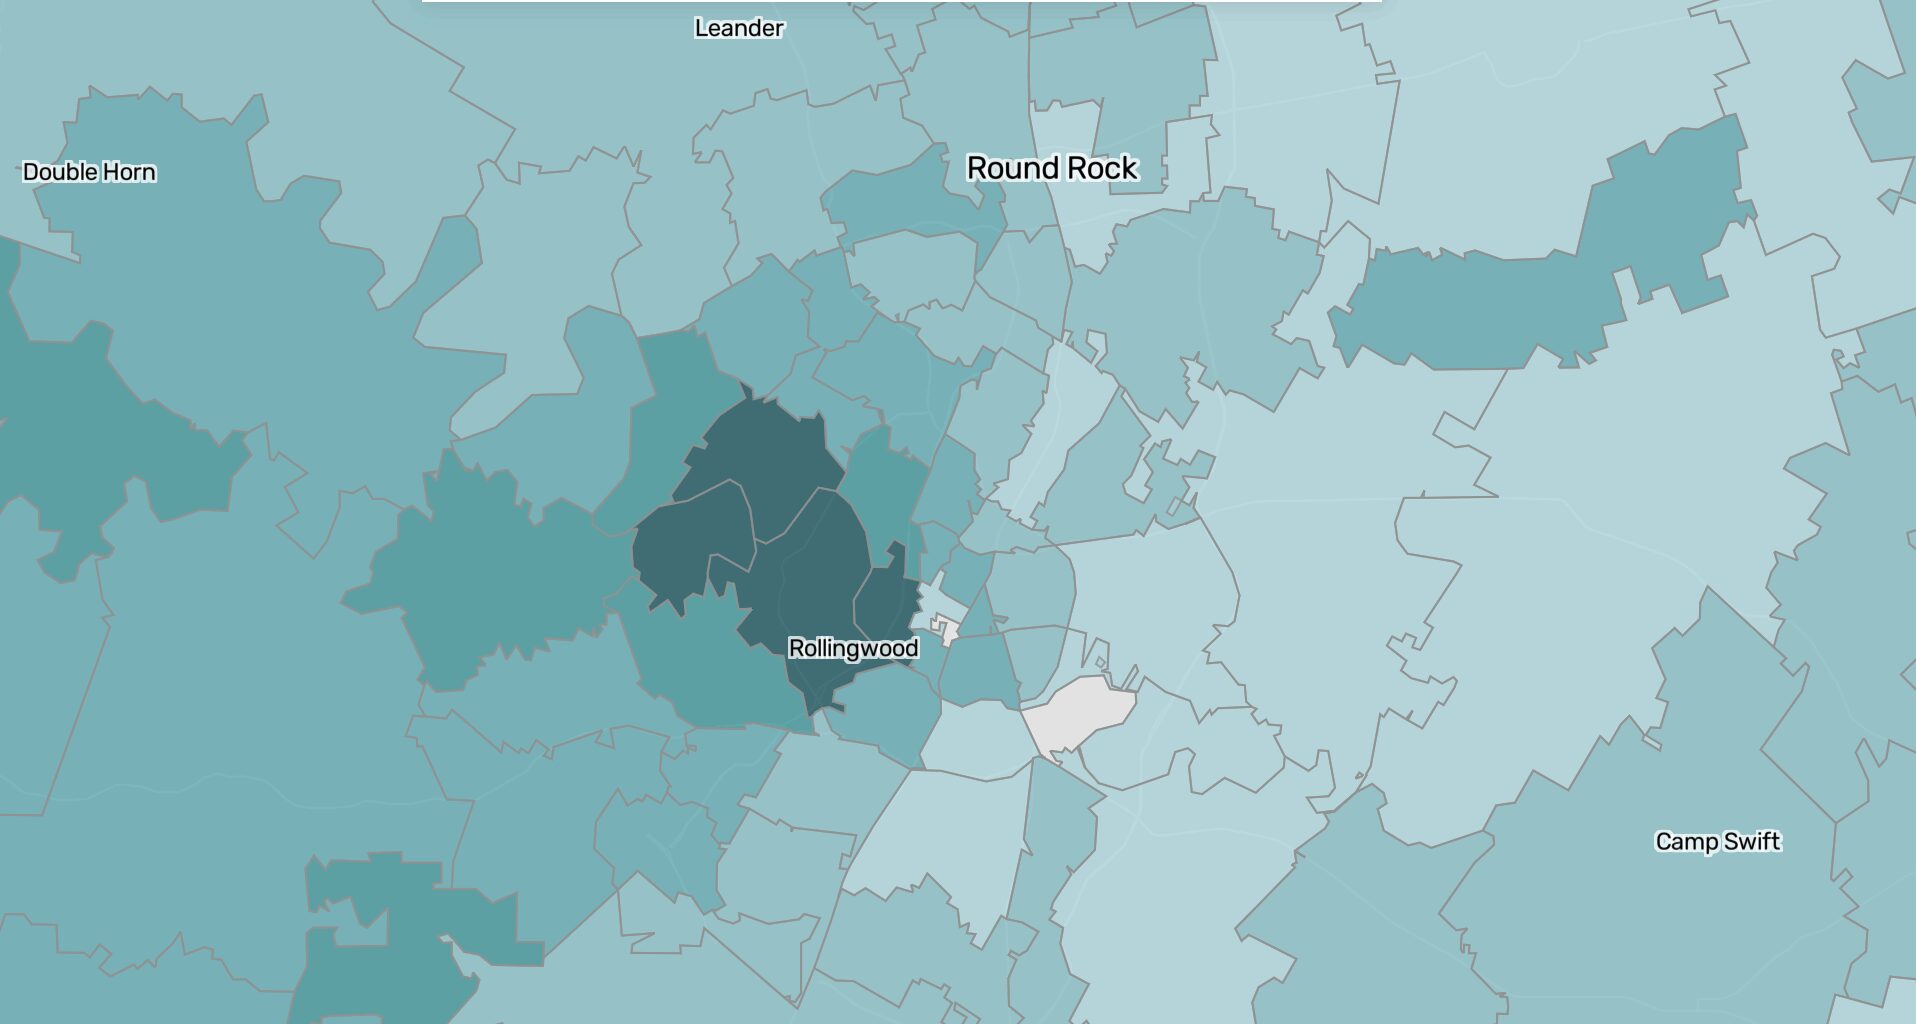
The map above shows which ZIP codes have the highest home values, current sales prices and largest sale-to-list ratios. Selecting a specific ZIP code will show you the historical trends for these values in that area. You can also peruse neighborhoods in other cities to see how prices compare in places like Dallas or Houston.
Chief economist at Redfin, Daryl Fairweather, said the gap between sellers and buyers grew in part because of new construction during the pandemic.
“Once home prices started to soar, that’s when the builders dropped in and wanted to take advantage of that excess home demand,” Fairweather said. “That’s why Austin is such a buyer’s market right now … because of its ability to expand its supply.”
While rent prices aren’t included in this tracker, Fairweather said those have also dropped in Austin due to the new construction during the pandemic. Lower rents could also be a contributing factor to the buyer-seller gap because potential buyers might be more inclined to rent for longer before buying, Fairweather said.
The Austin housing market is expected to remain a buyer’s market through at least the spring of 2026, although Fairweather said a drastic fall in mortgage rates could change that. The Federal Reserve has reduced interest rates twice in 2025.
Median sale price in Texas metro areasHover over the chart to see monthly values
Chart: Alejandra Arevalo/DevHub • Source: Redfin
The median home sale price can give buyers a sense of how expensive buying a house is and sellers an idea of how much houses in the area are selling for.
Austin home prices peaked in May 2022, but have declined since. In September, the median sale price was down $10k from the same time last year.
The highest median home prices can be found in ZIP codes 78746, 78733 and 78703. The 78746 zip code, which includes exurbs like Rollingwood and West Lake Hills, has had the highest median home price every year since 2012. In 78733, which includes neighborhoods like Senna Hills, Cuernavaca and Barton Creek West, and 78703, which includes Tarrytown and Old West Austin, median home prices have remained among the highest in the city almost every year since 2012.
Average home value in Texas metro areasHover over the chart to see monthly values
Chart: Alejandra Arevalo/DevHub • Source: Zillow
Home values can give buyers and sellers a better look at what a home is worth because they are adjusted for seasonal housing market changes. Home values also differ from home sale prices because they include both on- and off-market homes.
Overall, Austin home values have seen a steady decline since May 2022. Still, they are 32% higher than they were in January 2020 before the pandemic.
Median days on market in Texas metro areasHover over the chart to see monthly values
Chart: Alejandra Arevalo/DevHub • Source: Redfin
Another indicator of the buyer-seller ratio is how many days homes linger on the market. In Austin, the median has been increasing as the city also sees a drop in home prices and values.
“Homes that are priced too high, or that aren’t move-in ready, or that are just unappealing for whatever reason, are not going to get bought as quickly as those homes that are priced at the market rate,” Fairweather said.
About this data
Home price data comes from real estate company Redfin and reflects the median price of homes that have sold during the given month.
The data for home values comes from real estate company Zillow, whose estimates factor in past sale amounts as well as tax assessments, square footage and location to assess a home’s value.
Zillow aggregates these estimates for both on- and off-market homes to generate values at the metro and ZIP code levels. In order to look at the “typical” home in an area, only homes priced between the 35th and 65th percentile in a market are used.
Unlike Redfin’s home sale prices, Zillow’s home values are seasonally adjusted. The adjustments smooth out the differences between increases that happen during the spring and summer seasons, when the housing market is at its most competitive, and decreases during the slow winter months.