
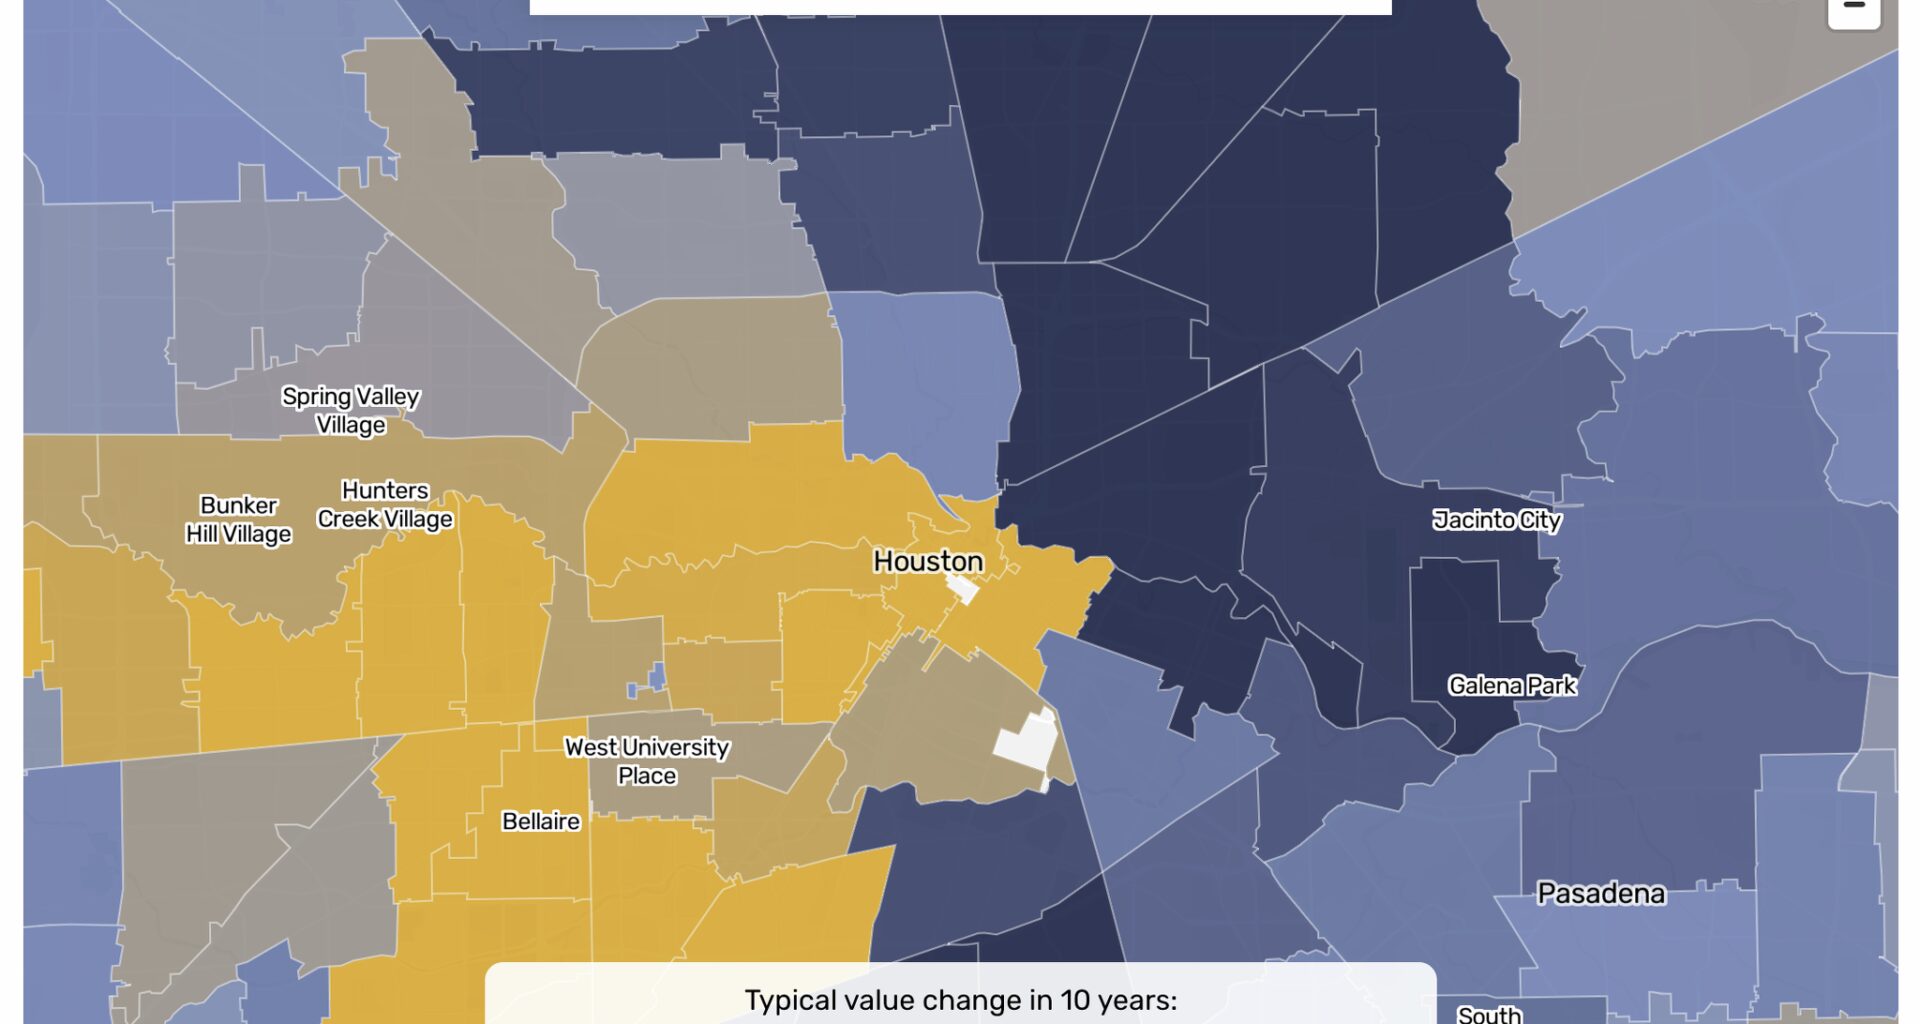
This map uses Harris Central Appraisal District data to track market value changes for single-family homes from 2017 to 2026.
To better track market changes over time, our analysis and the median values listed on this page exclude new construction, both new homes and extensive work on existing homes, including features like pools.
Protest data reflects the number of years a typical homeowner in each ZIP code filed a challenge to their property tax appraisal with HCAD. Homestead exemption data reflects the number of years a typical homeowner claimed the exemption, which caps annual increases in a home’s taxed value.
Property tax jargon can be confusing. Here are some key terms you should know.