
College football looks a lot different than it did a decade ago. The College Football Playoff now includes 12 teams. The transfer portal allows for frequent player movement. Power conference rosters have eight-figure payrolls.
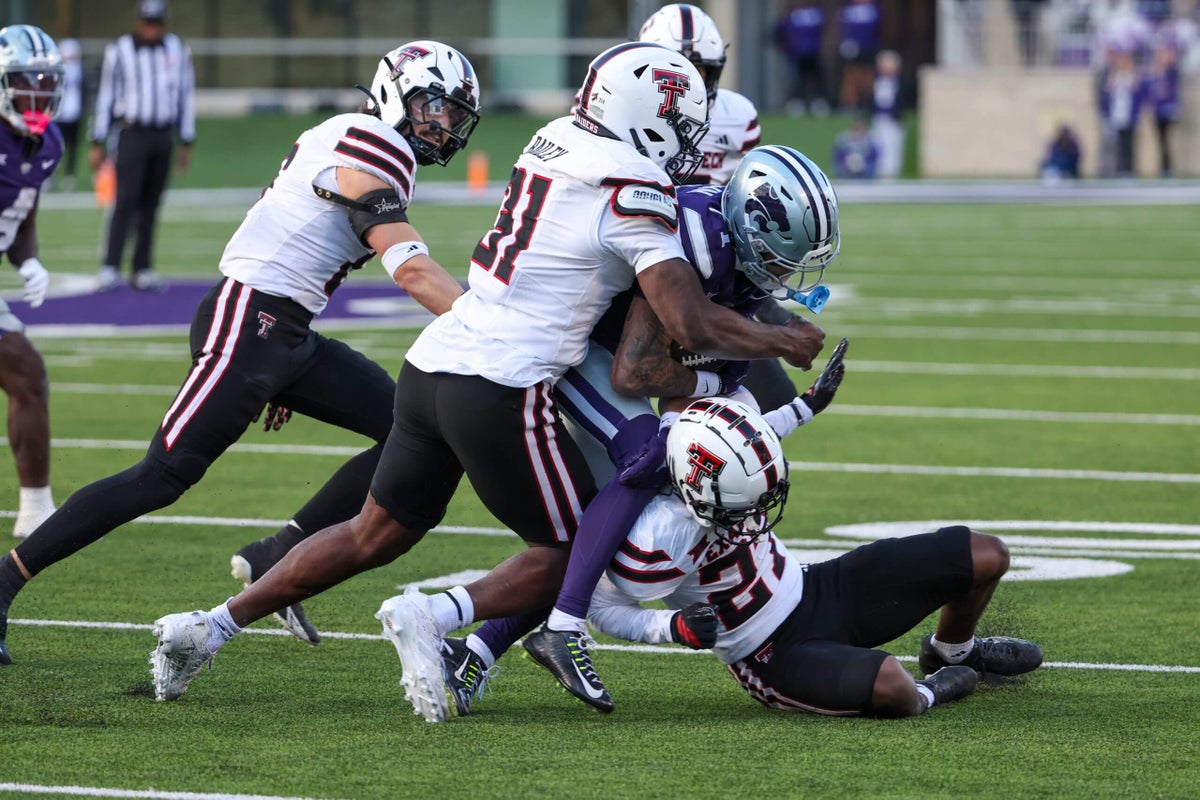
And Texas Tech has an elite defense.
The Red Raiders, a team long known for its offensive prowess, dating to the Mike Leach era of the 2000s, haven’t traditionally fielded defenses that would be considered top tier, or even good. For a while, Texas Tech was the quintessential Big 12 team of the mid-2010s: all offense, no defense.
In 2016, Patrick Mahomes’ final season in Lubbock, he led the FBS with 421 passing yards per game (63 more than the No. 2 passer) while Texas Tech ranked first nationally in total offense (566.6 ypg) and fifth in scoring (43.7 ppg). But the Red Raiders finished 5-7 in part because they ranked last nationally in total defense (554.3 ypg) and scoring defense (43.5 ppg).
But it’s a new era, and No. 8 Texas Tech (8-1), which this week made its first appearance in the CFP rankings in program history, is well-positioned for a Playoff berth on the strength of its defense. Ahead of a pivotal clash with No. 7 BYU (8-0), Texas Tech is having one of its best defensive showings in decades.
The Raiders are allowing only 13.2 points per game, fifth best in the FBS and the program’s lowest average since the 1971 team gave up 12.5 per game. And their 271.3 yards allowed per game (10th nationally) would be their best showing since 1977.
But Tech’s success goes beyond basic counting stats. Let’s dive deeper into the metrics to explore the Raiders’ defensive turnaround.
Note: All stats are through Week 10 games only.
Defensive success rate
Texas Tech is No. 4 in the FBS, No. 2 among Power 4 teams and No. 1 in the Big 12 in defensive success rate, according to TruMedia. Defensive success rate measures the percentage of plays that a defense allows less than 50 percent of the yardage an offense needs for a first down on first or second down and denies third- and fourth-down conversions.
Defensive success rate
RankTeamDef. success %
1
Oklahoma
67.7
2
San Diego State
66.9
3
James Madison
66.7
4
Texas Tech
66.6
5
Indiana
66.1
6
Pittsburgh
63.0
7
Missouri
62.8
8
Wake Forest
62.8
9
Texas A&M
62.4
10
Louisville
62.3
Pressure
One of the biggest contributors to Tech’s defensive success is the pressure it generates on quarterbacks. Texas Tech has the 12th-best pressure rate in the country, pressuring QBs on 38.9 percent of defensive snaps, according to Pro Football Focus. The Red Raiders lead all FBS teams with 144 total pressures this season.
But the most impressive aspect of that number is how frequently Tech blitzes. The Red Raiders send five or more rushers on just 19.3 percent of snaps, the lowest blitz rate of any team in the top 12 of pressure rate. The No. 1 team in overall pressure rate, Utah (46.1 percent), blitzes almost half the time (49.2 percent of snaps).
The ability to get pressure with just four rushers is a credit to Tech’s talented defensive line — which did not come cheaply. Stanford transfer David Bailey leads all FBS players with 58 pressures, and Georgia Tech transfer Romello Height is tied for fifth nationally with 41 pressures, according to Pro Football Focus.
Here’s a look at the top 12 teams in pressure rate and how often they blitz.
Pressure rate
RankTeamPressure %Blitz %
1
Utah
46.1
49.2
2
Louisville
44.1
39.1
3
Missouri
43.9
29.5
4
Oklahoma
42.2
36.0
5
Indiana
41.8
20.8
6
Ohio State
40.8
26.9
7
Virginia
39.8
24.7
8
Miami (Fla.)
39.7
34.6
9
Wake Forest
39.5
25.9
10
LSU
39.4
38.5
11
Boise State
39.1
42.5
12
Texas Tech
38.9
19.3
And here are the top 12 teams in pressure rate that blitz 25 percent of the time or less.
Pressure rate < 25% blitz rate
RankTeamPressure %Blitz %
1
Indiana
41.8
20.8
2
Virginia
39.8
24.7
3
Texas Tech
38.9
19.3
4
Kentucky
38.7
18.1
5
Duke
38.1
22.7
6
Texas A&M
38.1
23.1
7
Alabama
37.7
18.7
8
Southern Miss
37.7
24.7
9
BYU
37.3
23.5
10
Hawaii
36.9
17.8
11
Toledo
36.4
20.8
12
Texas
35.9
24.5
Explosive plays
It’s not just Tech’s defense that is doing the heavy lifting. The offense has remained effective, if not quite the level that it used to be in the Red Raiders’ Air Raid heyday.
Texas Tech has one of the best offensive explosive play rates in the country. TruMedia defines an explosive play as a pass of 16 or more yards and a rush of 12 or more yards. Tech has an FBS-high 106 explosive plays this season and an explosive play rate of 16 percent (11th best in the FBS).
Combine that with a defense that limits explosives — Texas Tech has allowed 48 explosive plays, the 15th-lowest total in the FBS — and you have a pretty dangerous team.
On average, Texas Tech has 6.4 more explosive plays on offense per game than it allows on defense, the second-best differential in the country behind Oregon (7.6).
Explosive plays
RankTeamOff ExplDef ExplDiff / game
1
Oregon
89
28
7.6
2
Texas Tech
106
48
6.4
3
Toledo
76
30
5.8
4
Missouri
82
37
5.6
5
North Texas
104
54
5.6
5
Indiana
99
49
5.6
7
Florida State
90
48
5.3
8
USC
98
62
4.5
9
James Madison
71
36
4.4
10
Georgia
71
38
4.1
10
Notre Dame
89
56
4.1
10
Washington
83
50
4.1
Comparing Ohio State, Indiana and Texas A&M on defense
One of the talking points that emerged from the first batch of Playoff rankings on Tuesday was the differences between No. 2 Indiana and No. 3 Texas A&M.
CFP selection committee chair Mack Rhoades got some Aggies riled up when noting that the “separator” between the Aggies, the Hoosiers and No. 1 Ohio State was defense.
“You’re talking about really small margins when you think about the difference between Ohio State, Indiana and A&M, and then I think statistically, when we looked at A&M defensively, they’re just lower than both Ohio State and Indiana,” Rhoades said Tuesday. “We had to make a hard decision, and you’re trying to find separators, and that was a separator for us.”
Texas A&M coach Mike Elko was asked about Rhoades’ comments during Wednesday’s SEC coaches teleconference.
“Yeah, I don’t pay much attention to that,” Elko said, with a tinge of sarcasm. “I’m glad Mack has an opinion on why he put teams where he did, and I think it’s awesome.”
Given the Aggies’ historic success on third-down defense this season, the idea that there’s a huge gap between that unit and the Buckeyes and Hoosiers might be a bit surprising, but the metrics back up Rhoades’ assertion.
Ohio State and Indiana are significantly better in multiple defensive metrics than the Aggies. A&M ranks behind both in defensive points per drive, stop rate, yards per play allowed, red zone touchdown rate allowed and takeaways.
Defensive comparison
StatOhio StateIndianaTexas A&M
PPG allowed
6.9
10.8
23.6
Def points/drive
0.68
0.85
1.82
Stop rate
86.4%
80.8%
68.7%
Yards/play allowed
3.8
4.5
5.1
Defensive success rate
61.6%
66.1%
62.4%
Explosive play rate allowed
7.6%
10.0%
11.9%
Pressure rate
40.8%
41.8%
38.1%
Third down conv. % allowed
25.7%
23.7%
21.8%
Red zone TD % allowed
26.7%
15.4%
65.4%
Takeaways
9
18
6
A&M’s defensive performances against UTSA, Notre Dame and Arkansas are definitely factoring in here. The Aggies allowed 203 rushing yards to the Roadrunners and 40-plus points each to the Fighting Irish and Razorbacks.
Ohio State hasn’t allowed an opponent to reach 17 points, and Indiana has held all its foes to 20 or fewer. Now, some may argue in favor of the Aggies’ schedule, which is rated as stronger than the other two teams. According to The Athletic’s model, Texas A&M has the best strength of record and the 14th-toughest schedule. Indiana’s strength of record is third best; Ohio State’s is sixth. And the Buckeyes’ schedule strength ranks 64th, while the Hoosiers’ ranks 45th.
Julian Sayin’s accuracy
Ohio State quarterback Julian Sayin is gaining traction in the Heisman Trophy race as the Buckeyes continue to roll in their national title defense.
Sayin is first in the FBS in passer rating and has an impressive 23-to-3 touchdown-to-interception ratio, which is in the top 10 nationally. But the most impressive aspect of Sayin’s 2025 performance is his accuracy.
This season, Sayin has completed 80.7 percent of his passes, which would shatter Bo Nix’s previous single-season record of 77.4. And yes, Sayin has great receivers in Jeremiah Smith and Carnell Tate. Still, Sayin is putting the ball where it needs to be the vast majority of the time.
Only 6 percent of Sayin’s pass attempts are deemed “off target” by PFF, the lowest percentage in the country. Sayin is a full percentage point better than the second best in that category, Georgia’s Gunner Stockton.
QB off-target percentage (per PFF)
RankPlayerComp %Off Tgt %
1
Julian Sayin, Ohio State
80.7
6.0
2
Gunner Stockton, Georgia
70.3
7.0
3
Fernando Mendoza, Indiana
72.3
8.0
4
Carson Beck, Miami (Fla.)
72.5
8.3
5
Maverick McIvor, WKU
67.3
8.7
6
Behren Morton, Texas Tech
67.9
8.7
7
Cade Klubnik, Clemson
67.2
8.8
8
Garrett Nussmeier, LSU
65.9
9.0
9
Drake Lindsey, Minnesota
62.2
9.1
10
Kevin Jennings, SMU
66.2
9.1
Sayin is stacking up well against some of the recent greats, too. His off-target percentage is better than that of LSU’s Joe Burrow in the Tigers’ 2019 national championship season. Burrow’s was 6.1 percent, though he attempted 527 passes (Sayin has 218 attempts so far). His off-target rate matches Nix’s in 2023 and is below only Alabama’s Mac Jones in 2020.
QB off-target percentage since 2019 (per PFF)
PlayerSeasonOff Tgt %Pass att
Mac Jones, Alabama
2020
5.5%
402
Bo Nix, Oregon
2023
6.0%
470
Julian Sayin, Ohio State
2025
6.0%
218
Joe Burrow, LSU
2019
6.1%
527
Mikey Keene, Fresno State
2024
6.1%
393
Kedon Slovis, USC
2019
6.1%
392
Spencer Rattler, Oklahoma
2020
6.3%
317
Will Rogers, Mississippi State
2020
6.4%
346
Zach Wilson, BYU
2020
6.8%
336
Gunner Stockton, Georgia
2025
7.0%
229